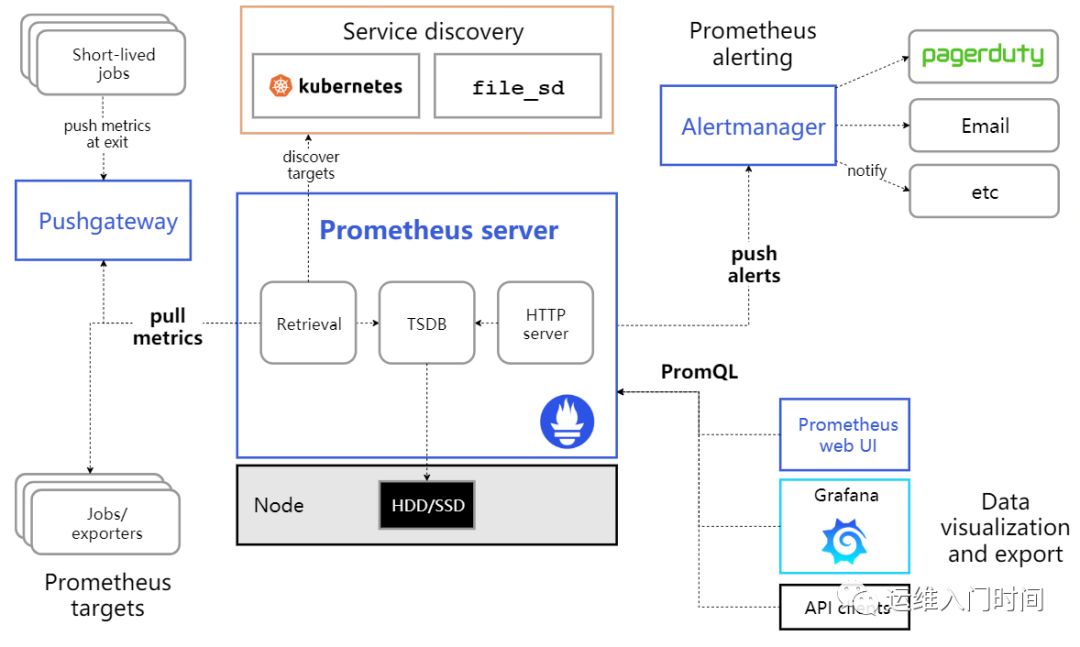
上回已经讲好快速部署prometheus alertmanager 这回接着如果配置报警,本文我主要以接入mysql报警为案例 进行全面的讲解 软加载监控报警
1、首先讲解一下prometheus.yml文件
global:scrape_interval: 1s # Set the scrape interval to every 15 seconds. Default is every 1 minute.evaluation_interval: 1s # Evaluate rules every 15 seconds. The default is every 1 minute.# scrape_timeout is set to the global default (10s).# Alertmanager configuration 主要连接alertmanagealerting:alertmanagers:- static_configs:- targets:- localhost:9093# 这里我设置了默认的alertmanager装在同一机器上# -localhost:9093# 大家可以替换成 alertmanager_server_ip:9093# Load rules once and periodically evaluate them according to the global 'evaluation_interval'.# 装载的 具体报警规则rule_files:- /usr/local/prometheus/rules/*.rules# - "first_rules.yml"# - "second_rules.yml"scrape_configs:# The job name is added as a label `job=<job_name>` to any timeseries scraped from this config.- job_name: 'prometheus'static_configs:- targets: ['172.17.0.159:9090']- job_name: mysql# 这里的加载方式主要用了file_sd_configs# 软加载了配置文件 consul方法更佳 欢迎大神普及file_sd_configs:- files: ['/usr/local/prometheus/mysql/*.json']
2、讲解一下alertmanager文件
可以用邮箱 webhook 企业微信等等 我这里以钉钉为例
global:resolve_timeout: 1msmtp_smarthost: 'smtp.qiye.aliyun.com:465'smtp_from: 'monitor@xx.com'smtp_auth_username: 'monitor@xx.com'smtp_auth_password: 'xxxxxxxx#'smtp_require_tls: falseroute:group_by: ['alertname']group_wait: 10sgroup_interval: 10srepeat_interval: 10mreceiver: 'webhook'receivers:- name: 'webhook'# email_configs:# - to: 'wml@zmjx.com'webhook_configs:# 没有什么可以讲的主要讲一下这个URL- url: 'http://localhost:8060/dingtalk/webhook1/send'send_resolved: trueinhibit_rules:- source_match:severity: 'critical'target_match:severity: 'warning'equal: ['alertname', 'dev', 'instance']
2.1 prometheus-webhook-dingtalk git仓库地址
我躺了很多坑了 当然要感谢作者无限付出 希望作者能努力优化
1、推荐大家不要用会转义的字符
2、postman时候先试一下
3、最后使用releases 自己编译很坑 用docker启动可能会有转义问题(笔者测试的时候坑了 无数次 )
rpm -ivh prometheus-webhook-dingtalk-0.3.0.linux-amd64.tar.gz
2.2 添加机器人获取webhook地址 (该机器需要连接钉钉接口外网)
nohup ./prometheus-webhook-dingtalk --ding.profile="webhook1=https://oapi.dingtalk.com/robot/send?access_token=你机器人的token" &
这样就启动获取了一个URL地址:注意这个webhoo1 很关键的URL路径
http://启动机器的ip:8060/dingtalk/webhook1/send
3、配置服务器的规则及客户端的agent(可以配置任何一台机器)
3.1 prometheus 下面配置如下
###在该文件夹下添加json## - files: ['/usr/local/prometheus/mysql/*.json']### 不要修改其他文件名 必须以*.json为结尾不然动态加载不出来[root@grafana prometheus]# cat /usr/local/prometheus/mysql/usercenter.json[{"targets": ["IP:9104"],"labels": {"alias": "usercenter-master-mysql","group": "mysql"}},{"targets": ["IP:10000"],"labels": {"alias": "usercenter-slave-mysql","group": "mysql"}}]
3.2下载mysql_export(根据自己的需求,下载不同的版本)
https://github.com/prometheus/mysqld_exporter
3.3启动agent代理配置
nohup /usr/local/prometheus/mysql/mysqld_exporter-0.12.0.linux-amd64/mysqld_exporter --config.my-cnf="/usr/local/prometheus/mysql/.trade.11000.master.cnf" --web.listen-address=":11000" &
[root@grafana prometheus]# cat usr/local/prometheus/mysql/.my.cnf[client]user=DB_USERpassword=DB_PASSWORDhost=DB_URL
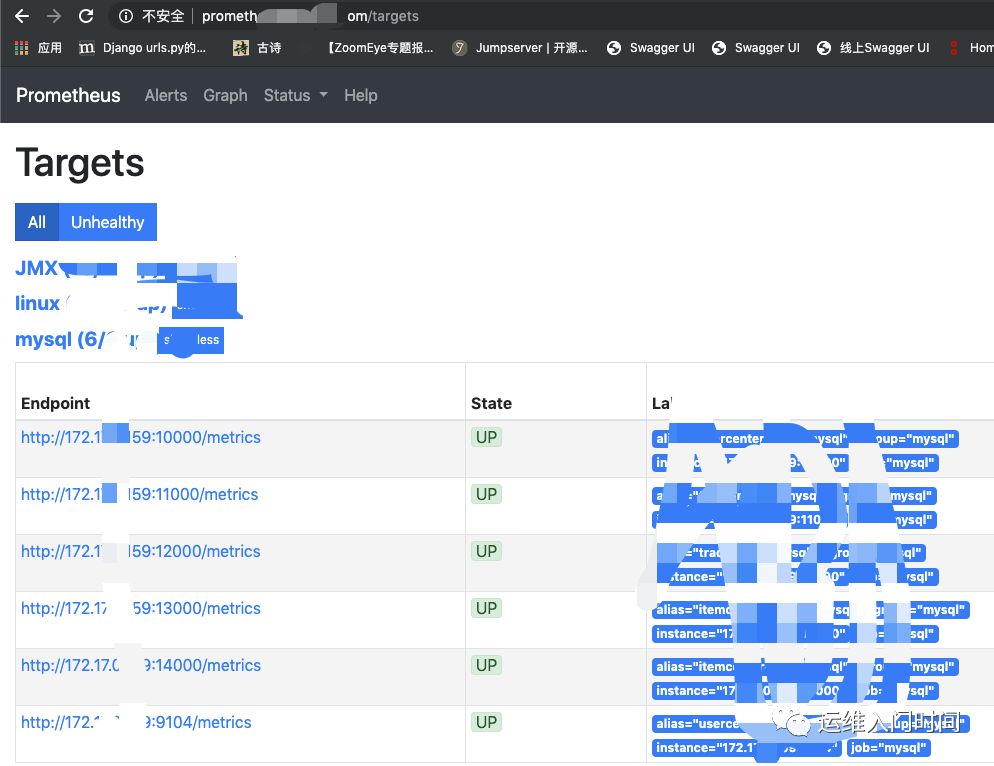
3.4 查看prometheus下面的状态 监控的数据就会出现 state UP 状态证明prometheus已经捕获得DB信息 证明已经连接成功
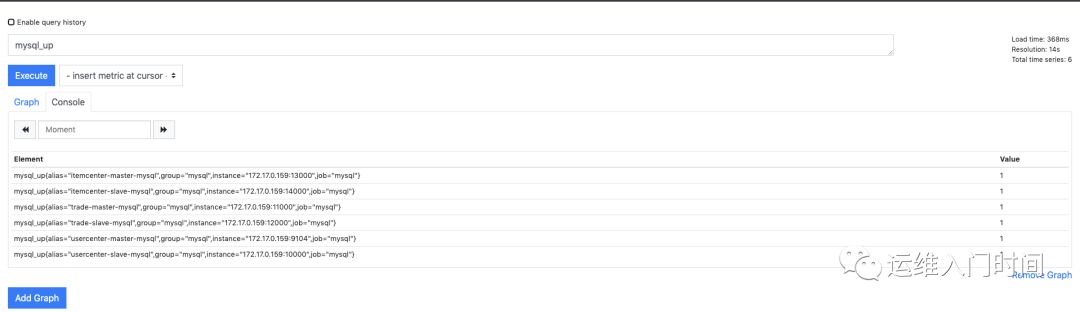
3.5 测试报警webhook报警
首先这个需要要使用prometheus这个语法 以up为例
http://prometheus_server_ip:9093/graph?g0.range_input=1h&g0.expr=mysql_up&g0.tab=
使用例子
mysql_up
3.6最后设置rule规则
(不同的prometheus版本rule规则不一样 大家需要注意)
给个一个样本 大家自己参照
groups:- name: OS info #规则组名称rules:- alert: MYSQL_UPexpr: mysql_up < 1for: 1mlabels:project: aliasannotations:summary: " mysql is down {{$labels.alias}}"description: "mysql is down VALUE = {{ $value }}\n LABELS: {{ $labels }}"
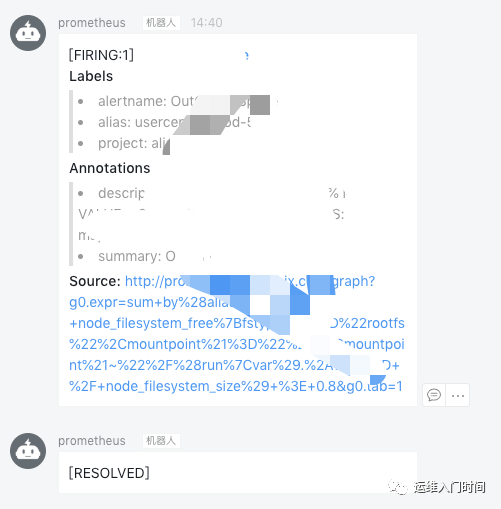
3.7 钉钉出现报警 解决完出现 RESOLVED
另外推荐下面二个rule地址 非常全面 涉及覆盖点linux zk jmx mysql 希望能帮助 大家
https://awesome-prometheus-alerts.grep.to/rules.htmlhttps://github.com/samber/awesome-prometheus-alerts
结合上下文总结 本方案有如下几点缺点
1、rule不能做到动态加载 需要重启prometheus
2、file_sd_config 方法手工配置较为麻烦 随着机器数量增加不足 较为麻烦
3、prometheus本身 对分布式支持不太友好(笔者自己认为)
最后谢谢过程中 帮助我的 好朋友 好基友 我这次踩坑也踩的比较严重!!
兑吧-小徐 二维火-糯米 微拍堂-男神等等基友 过程帮我解决问题的朋友!!!
欢迎关注我的公众号 不定期更新!!!!!