


一.核心程序:
1.计算极限
% 函数表达式f(x)在x0处的极限
L=limit(f,x,x0);
L=limit(f,x,x0,'left');
L=limit(f,x,x0,'right');
2.判断函数在某点的连续性
function continuity(x0,fun_left,fun_x0,fun_right)
    fx0=subs(fun_x0,'x',x0);
    fx0_left=subs(fun_left,'x',x0,'left');
    fx0_right=subs(fun_right,'x',x0,'right');
    if isequal(fx0_left,fx0) && isequal(fx0_right,fx0)
        str='函数在该点连续';
    else
        str='函数在该点间断';
    end
    disp(str);
end
3.判断函数在某点处的间断点类型
function breakpoint(x0,fun_left,fun_x0,fun_right)
    fx0=subs(fun_x0,'x',x0);
    fx0_left=subs(fun_left,'x',x0,'left');
    fx0_right=subs(fun_right,'x',x0,'right');
    if isinf(double(fx0_left)) || isinf(double(fx0_right)) || isnan(fx0_left) || isnan(fx0_right)
       str='第二类间断点';
    elseif ~isequal(fx0_left,fx0_right)
        str='跳跃间断点';
    elseif ~isequal(fx0,fx0_left,fx0_right) || isempty(x0)
        str='可去间断点';
    end
    disp(str);
end
二.极限可视化:
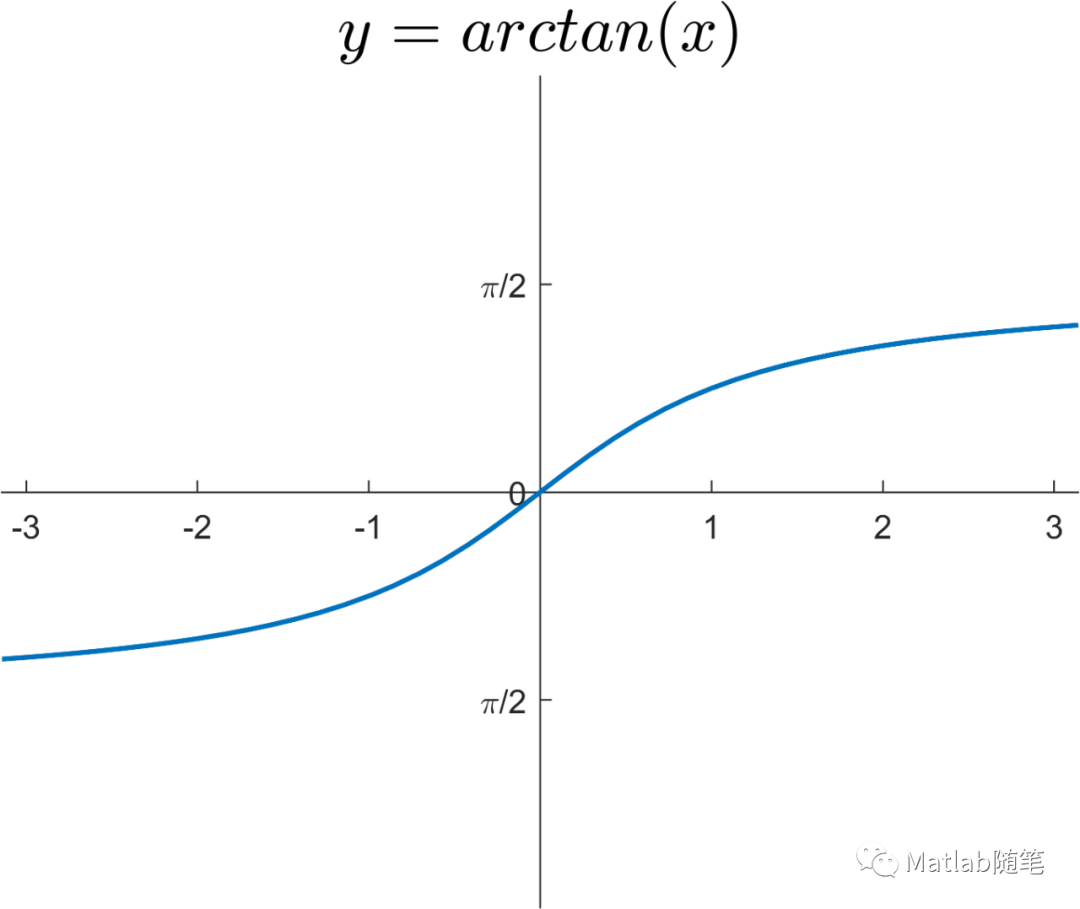
1.绘图
fplot(@(x)atan(x),'LineWidth',1.5);
2.设置坐标轴
ax=gca;
ax.XAxisLocation='origin';
ax.YAxisLocation='origin';
ax.Box='off';
3.设置标题(使用Latex)
title('$y=arctan(x)$','Interpreter','latex','FontSize',20)
4.更改刻度标签
xlim([-pi,pi]);
ylim([-pi,pi]);
yticks([-pi/2,0,pi/2]);
yticklabels({'-\pi/2','0','\pi/2'});
三.请参与下投票吧:
参考资料:《基于MATLAB的高等数学问题求解》
文章转载自Matlab随笔,如果涉嫌侵权,请发送邮件至:contact@modb.pro进行举报,并提供相关证据,一经查实,墨天轮将立刻删除相关内容。
