


闲来无事,最近研究了下TICK运维监控,在这里把部分笔记分享给大家。
简介
InfluxDB是一个由InfluxData开发的开源时序型数据。它由Go写成,着力于高性能地查询与存储时序型数据。InfluxDB被广泛应用于存储系统的监控数据,IoT行业的实时数据等场景。
Chronograf是InfluxData的TICK堆栈的用户界面组件。它使您的基础架构的监控和警报易于设置和维护。
Telegraf是一个插件驱动的服务器代理,用于从数据库、系统和物联网传感器收集和发送指标和事件。
grafana 是一款采用 go 语言编写的开源应用,主要用于大规模指标数据的可视化展现,是网络架构和应用分析中最流行的时序数据展示工具,目前已经支持绝大部分常用的时序数据库。
安装下载
官网界面打开js报错,所以点击下载没有什么效果,后来在网上查了下在网页中其实已经暴露出来了,需要用chrome浏览器开发者模式,搜索windows,找到influxdb,后面我要下载Chronograf也是采取了同样的办法。
点击链接可以下载:
influxdb:https://dl.influxdata.com/influxdb/releases/influxdb-1.7.10_windows_amd64.zip
chronograf:https://dl.influxdata.com/chronograf/releases/chronograf-1.8.0_windows_amd64.zip
telegraf:https://dl.influxdata.com/telegraf/releases/telegraf-1.14.2_windows_amd64.zip
安装Influxd
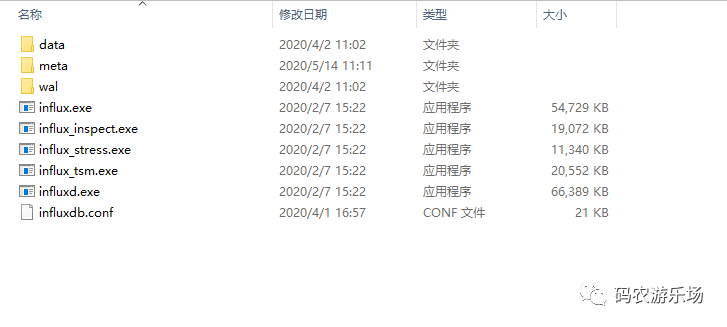
修改配置文件
修改influxdb.conf文件,代码如下,直接复制粘贴,注意修改路径,带D盘的改为你的安装路径就好,一共三个。
[meta]
  # Where the metadata/raft database is stored
  dir = "C:/influxdb/meta"

  # Automatically create a default retention policy when creating a database.
  # retention-autocreate = true

  # If log messages are printed for the meta service
  # logging-enabled = true

###
### [data]
###
### Controls where the actual shard data for InfluxDB lives and how it is
### flushed from the WAL. "dir" may need to be changed to a suitable place
### for your system, but the WAL settings are an advanced configuration. The
### defaults should work for most systems.
###

[data]
  # The directory where the TSM storage engine stores TSM files.
  dir = "C:/influxdb/data"

  # The directory where the TSM storage engine stores WAL files.
  wal-dir = "C:/influxdb/wal"
  ...后面省略一万行
运行
双击influxd.exe启动数据库。
然后双击influx.exe,可以连接数据库进行操作
或进入cmd命令,加载配置文件
cmd >> influxd -config influxdb.conf
安装服务
建议通过nssm工具安装成Windows服务,这样就不需要每次命令行启动了。
下载地址如下:http://www.nssm.cc/download
我们选择win64,进入文件夹后运行cmd,输入nssm install InfluxDB 运行后出现如下界面:重点说一下参数这一栏,Argument里输入:-config influxdb.conf,类似上面在cmd中输入Influxd -config influxdb.conf
安装好后运行起来就好...
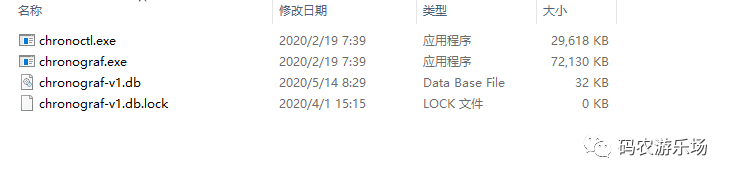
安装Chronograf
解压chronograf
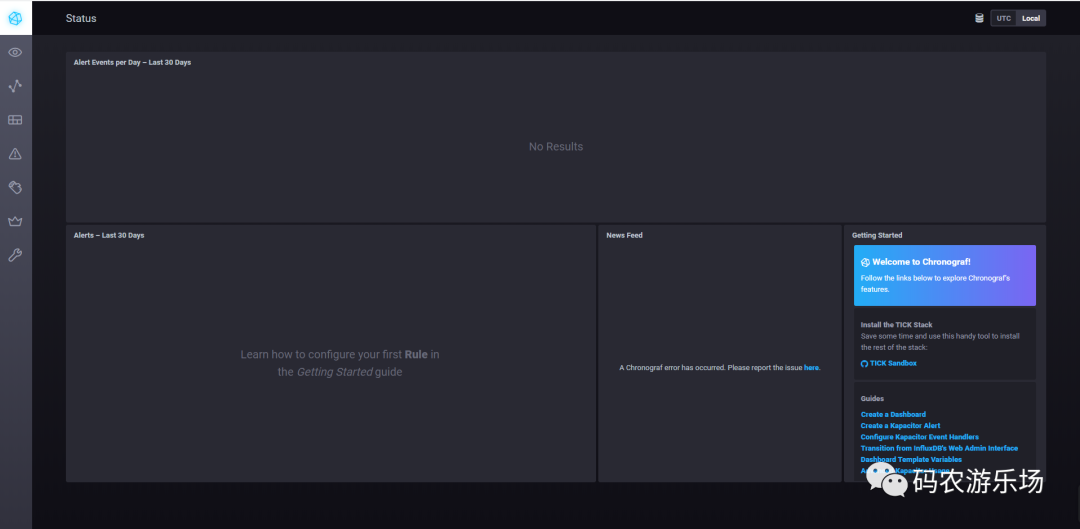
双击chronograf.exe,可以打开网页管理界面,浏览器输入http://localhost:8888/ 可以看到美妙的画面,我用admin/admin可以登入,其实不输密码应该也可以。
同样建议安装服务,chronograf的安装类似上面的操作,只是Argument这一栏不需要输入任何东西,打开浏览器可以看到如下画面。
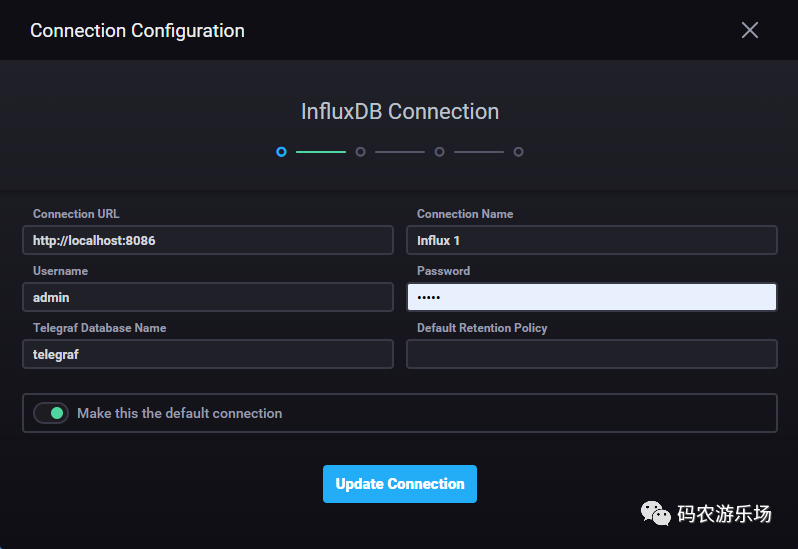
设置界面可以增加数据库连接
安装Telegraf
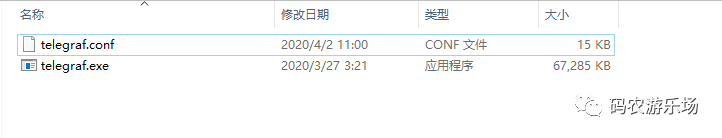
解压telegraf,如下图
修改telegraf.conf配置文件
[[outputs.influxdb]]
## The full HTTP or UDP URL for your InfluxDB instance.
##
## Multiple URLs can be specified for a single cluster, only ONE of the
## urls will be written to each interval.
# urls = ["unix:///var/run/influxdb.sock"]
# urls = ["udp://127.0.0.1:8089"]
urls = ["http://127.0.0.1:8086"]
## The target database for metrics; will be created as needed.
## For UDP url endpoint database needs to be configured on server side.
database = "telegraf"
修改数据库urls和databse名称。
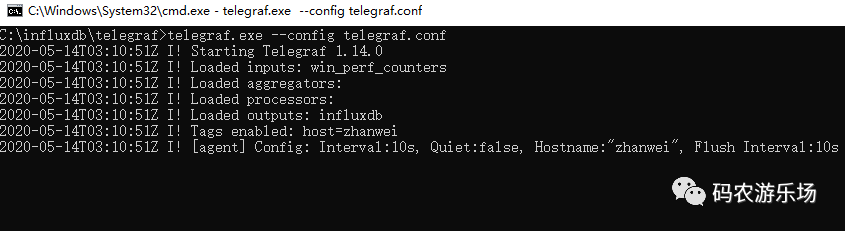
启动telegraf采集数据
打开cmd,输入以下命令:
>telegraf.exe --config telegraf.conf
如下图所示:
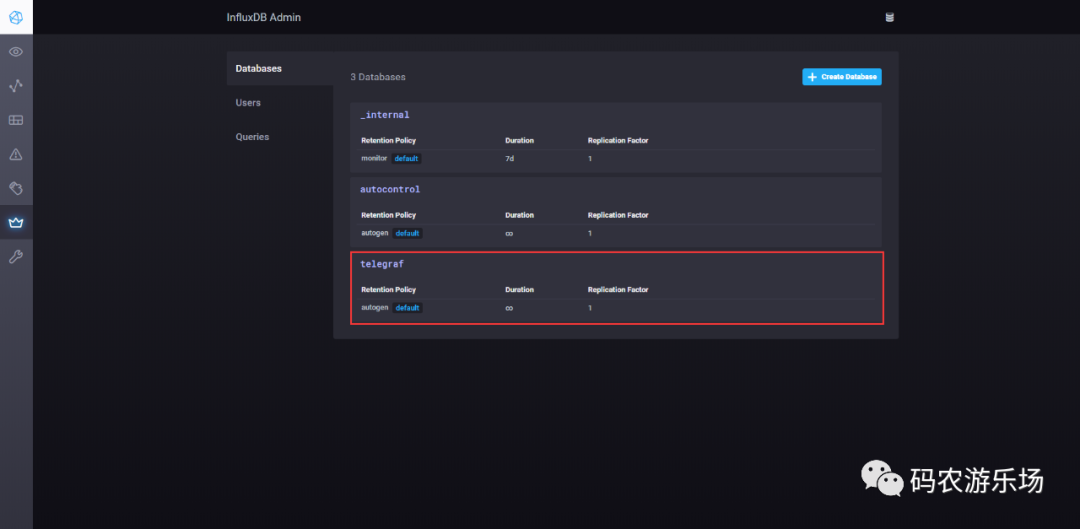
启动之后
我们打开http://localhost:8888/可以看到,数据库中已经增加了一个telegraf的数据库:
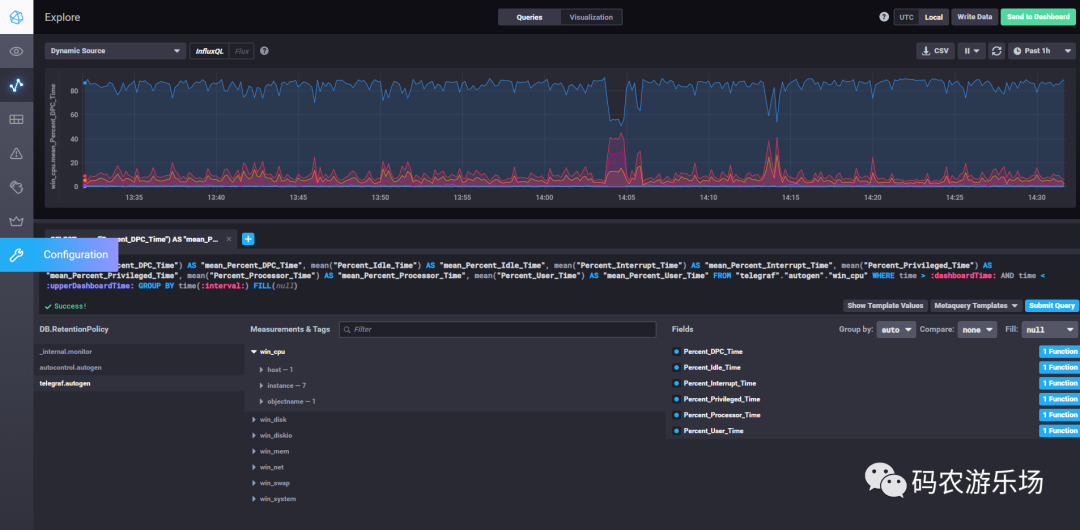
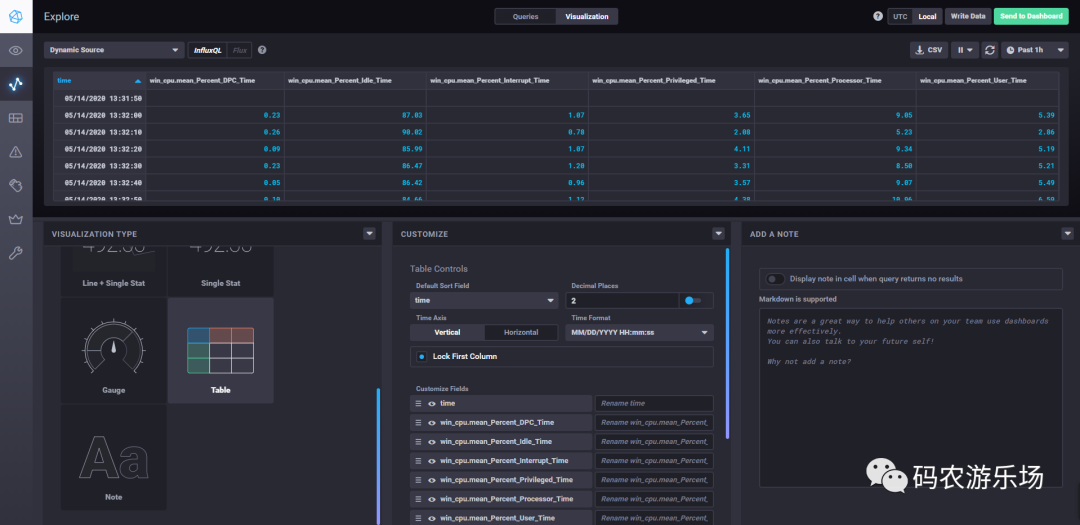
打开Explore,我们可以看到telegraf帮我自动帮我们创建了很多measurements/tag,在这里我们可以查询你想查的fields,可以切换视图,功能还是挺强大的。
安装Grafana
下载安装
官网下载:https://grafana.com/
可视化安装即可,这里就不说了,安装完成之后,打开http://localhost:3000/,可以看到如下界面,用户/密码默认是admin/admin。

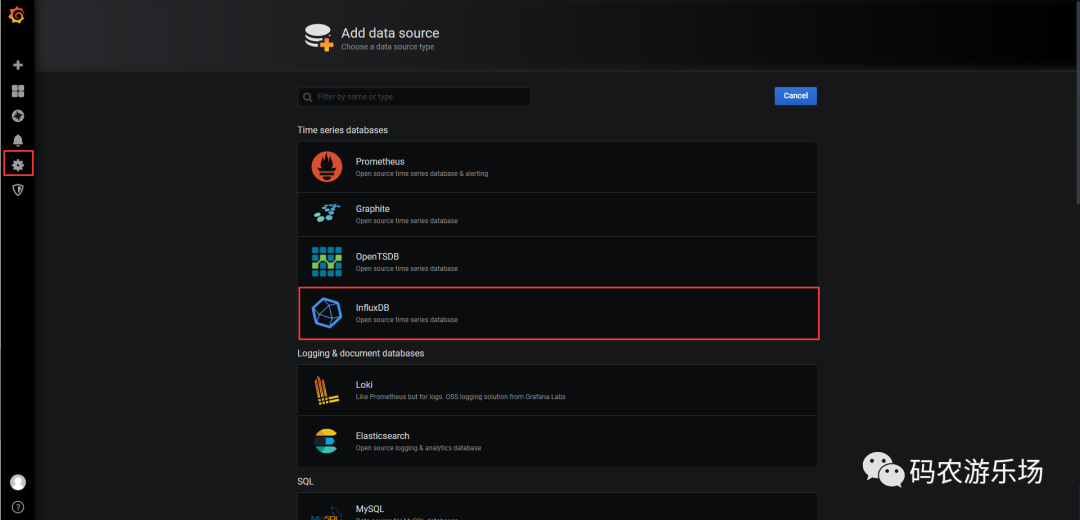
配置数据源,我们选择influxDB
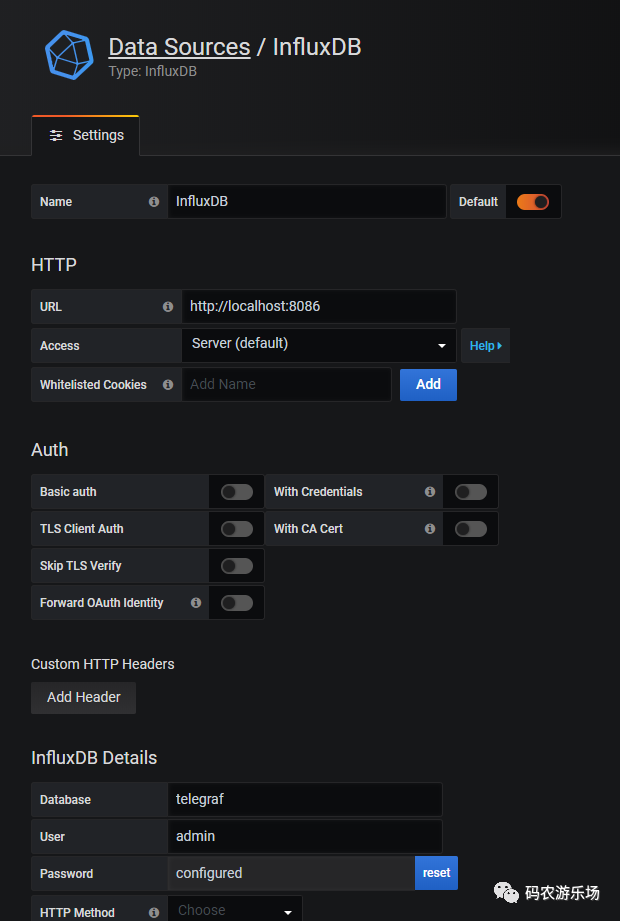
配置数据库信息
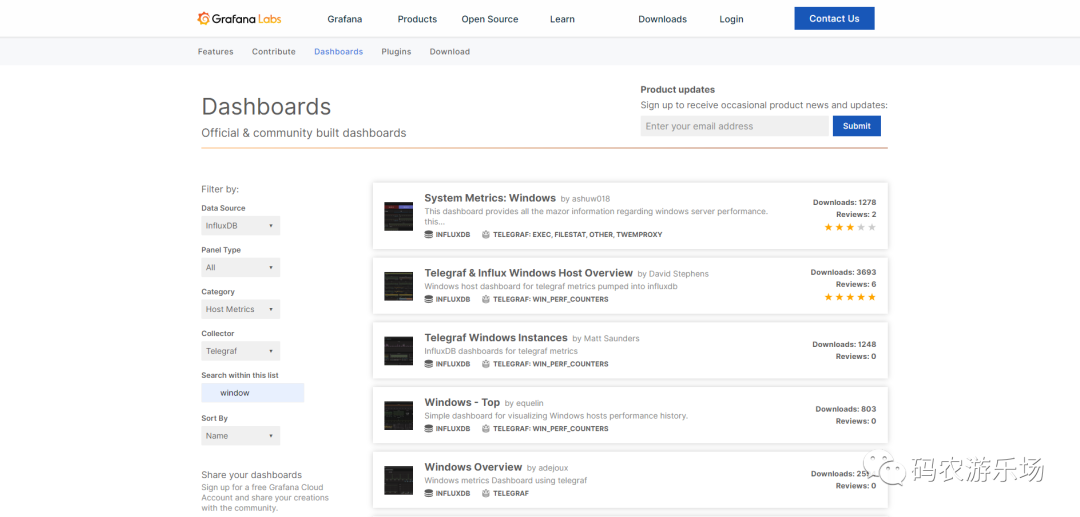
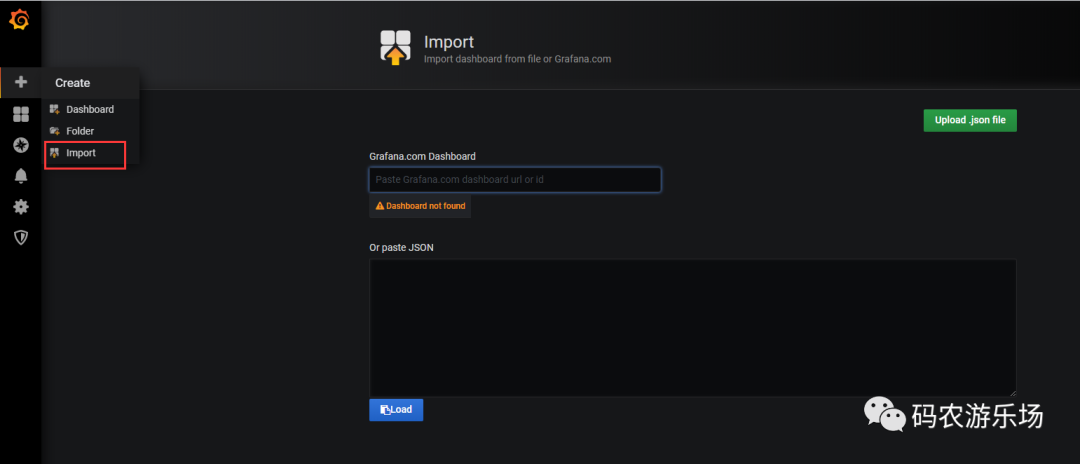
我们可以去官网上下载一个仪表盘,如下所示:
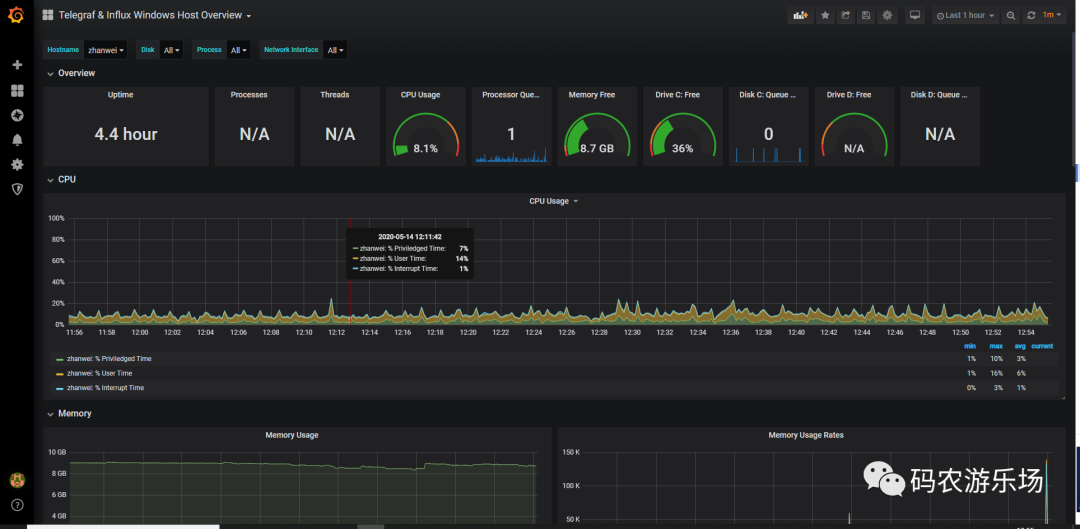
我选择了Telegraf & Influx Windows Host Overview,后面可以看到具体长什么样子。
导入仪表盘
仪表盘展示
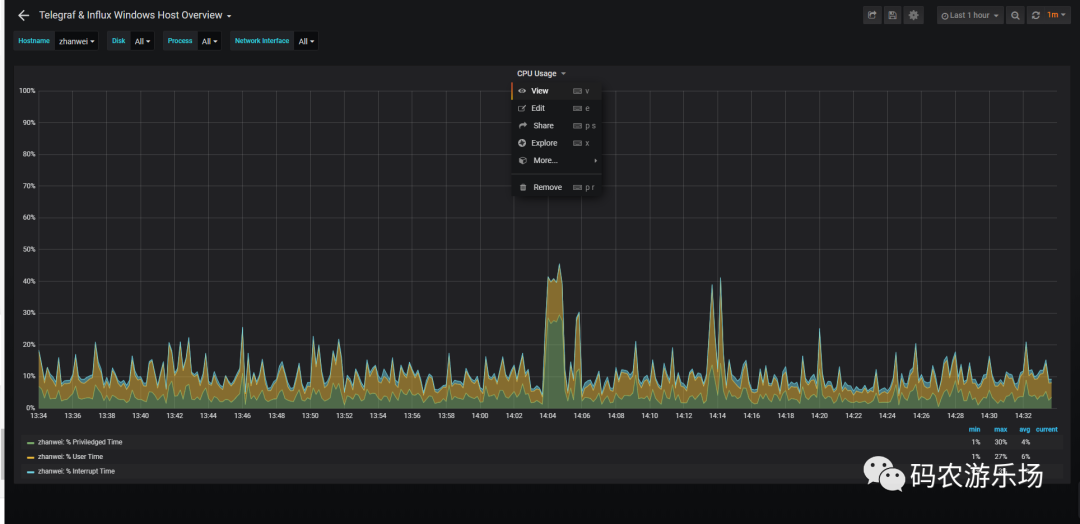
View可以扩大展示单个图表
也可以自己创建仪表盘,大家可以自己去研究下,先写到这吧。
下一篇单独写《Kapacitor在Chronograf中的配置和使用》。
