

王硕
王硕是PostgreSQL数据库核心的开发人员。他为完整数据库加密,Oracle兼容功能,PostgreSQL监控工具,PostgreSQL即时编译等做了很多工作。
前言
什么是LLVM?
LLVM项目是模块化、可重用编译器和工具链技术的集合。尽管名称如此,LLVM与传统虚拟机几乎没有关系。名称“LLVM”本身不是首字母缩略词; 它是项目的全名。
JIT是否必要?
在今天的企业中,数据以前所未有的速度增长,随着数据的急剧增加,执行商业智能和分析查询的需求也在增加。大多数企业也依赖于在NoSQL或分布式存储中存储非常大的历史数据,如Hadoop,用于执行复杂的分析查询。数据库的OLAP功能仍在运行,但OLAP工作负载正在增加,因此需要增强数据库OLAP功能来处理不断增长的OLAP工作负载。OLAP功能主要受数据吞吐量和CPU计算能力的影响。随着SSD,列存储和分布式数据库的兴起,I O不是数据库的主要瓶颈。
现代数据库为响应各种场景添加了大量逻辑和虚函数调用。这导致了数据库OLAP功能效率的降低。在PostgreSQL 11中,内核研发添加了Just-in-Time编译,这可以减少多余的逻辑操作和虚函数调用。
目前,PostgreSQL的JIT支持加速表达式评估和元组变形。未来可能会加速其他几项操作。
表达式评估用于评估WHERE子句,目标列表,聚合和预测。通过生成每种情况的特定代码来加速。
元组变形是将磁盘上的元组(参见第68.6.1节)转换为其在内存中表示的过程。通过针对表布局和要提取的列数创建特定函数来加速。
我第一次接触这项技术时使用的是Vitesse数据库。近年来,也发现了一些具有该技术的新数据库产品,例如:
论文《Precision Performance Surgery for PostgreSQL--LLVM–based Expression Compilation, Just in Time》中相关描述
我发现在PostgreSQL 11中默认禁用了JIT。本博客的目的是执行JIT的测试和基准测试,特别是将PostgreSQL 11与PostgreSQL 10进行比较。测试证明PG 11中启用JIT的性能优势,还将明确可改进的领域和如何进行改进的建议。
我的硬件配置:
使用llvm从源安装PostgreSQL 11
当PostgreSQL使用-with-llvm构建时,PostgreSQL内置支持使用LLVM执行JIT编译。首先,您需要安装llvm5.0。
然后安装PostgreSQL 11和PostgreSQL 10。
./configure -prefix = home postgres pg11JIT -with-openssl -with-libxml -with-libxslt -with-llvm make -j6;make install cd contrib make -j6;make install ./configure -prefix = home / postgres / pgdb10 -with-openssl -with-libxml -with-libxslt make -j6;make install cd contrib ==make -j6;make install
关于JIT的配置变量
配置变量jit确定是启用还是禁用JIT编译。如果启用,需要配置变量jit_above_cost,jit_inline_above_cost和jit_optimize_above_cost,这些参数确定是否对查询执行JIT编译,以及执行此操作需要花费多少精力。jit_provider确定使用哪个JIT实现。很少需要更改。
在PostgreSQL 11中启用JIT
如果成功安装PostgreSQL 11,您将找到一个名为bit_code的文件夹。有很多带.bc扩展名的文件。这些是用于LLVM预生成的字节码,用于促进内嵌等功能。
我在PostgreSQL10和PostgreSQL11中更改了一些配置变量,两个服务器配置参数获得同等比较。
[postgres@neoc bin]$ ./psqlpsql (11.2)Type “help” for help.postgres=# set jit=on;SETpostgres=# set jit_above_cost=0;SETpostgres=# set jit_inline_above_cost=0;SETpostgres=# set jit_optimize_above_cost=0;SETpostgres=# explain (analyze,verbose,costs,buffers,summary) select count(*) from pg_class;QUERY PLAN————————————————————————————————————Aggregate (cost=14.73..14.74 rows=1 width=8) (actual time=180.390..180.391 rows=1 loops=1)Output: count(*)Buffers: shared hit=22 read=1 dirtied=1-> Index Only Scan using pg_class_oid_index on pg_catalog.pg_class (cost=0.27..13.76 rows=386 width=0) (actual time=0.393..0.618 rows=386 loops=1)Output: oidHeap Fetches: 183Buffers: shared hit=22 read=1 dirtied=1Planning Time: 2.060 msJIT:Functions: 2Options: Inlining true, Optimization true, Expressions true, Deforming trueTiming: Generation 1.852 ms, Inlining 67.384 ms, Optimization 55.645 ms, Emission 56.331 ms, Total 181.213 msExecution Time: 330.002 ms(13 rows)
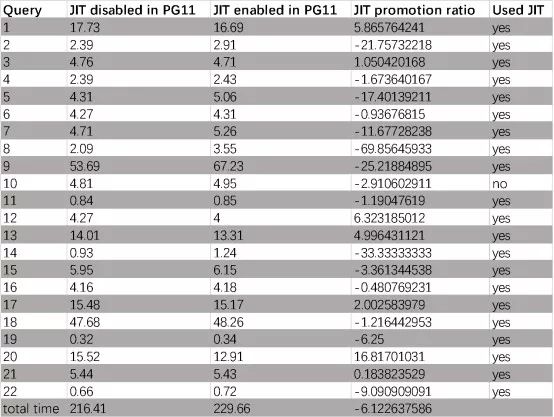
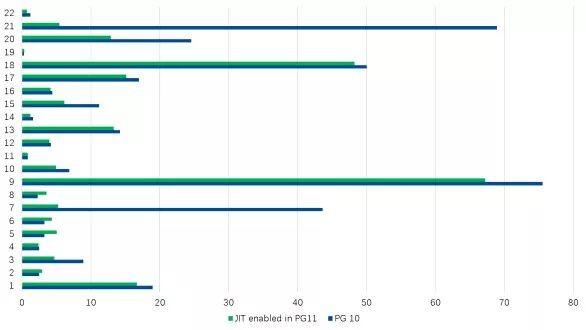
总数是所有22个SQL执行时间的总和。为了更直观,我们可以查看直方图:
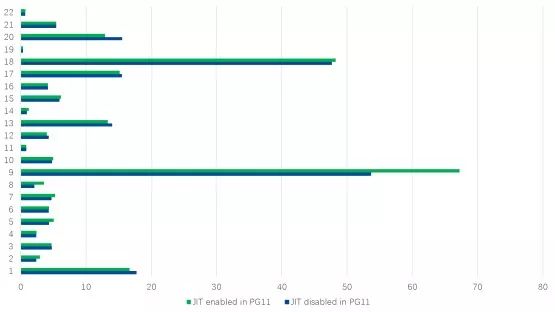
通过打开JIT,我们会发现执行时间减少了约6.1%。
随着JIT开启,性能下降。可能是我的测试用例和硬件不符合测试要求。所以我检查了执行计划。发现一个有趣的事情,JIT禁用比嵌套循环中启用JIT的耗时少。PG11中启用了JIT:
Limit (actual time=72490.850..72624.050 rows=1 loops=1)-> Finalize GroupAggregate (actual time=71891.664..71891.664 rows=1 loops=1)-> Gather Merge (actual time=71891.649..72024.844 rows=4 loops=1)-> Sort (actual time=71799.894..71799.896 rows=53 loops=3)-> Partial HashAggregate (actual time=71799.269..71799.684 rows=175 loops=3)-> Hash Join (actual time=69631.747..71189.348 rows=1087902 loops=3)-> Parallel Hash Join (actual time=69310.166..70696.067 rows=1087902 loops=3)-> Parallel Seq Scan on public.orders (actual time=0.504..9327.128 rows=5000000 loops=3)-> Parallel Hash (actual time=57497.965..57497.965 rows=1087902 loops=3)-> Nested Loop (actual time=45.005..56802.904 rows=1087902 loops=3)-> Parallel Hash Join (actual time=44.034..5326.659 rows=145140 loops=3)-> Nested Loop (actual time=0.471..5146.321 rows=145140 loops=3)-> Parallel Seq Scan on public.part (actual time=0.030..353.243 rows=36285 loops=3)-> Index Scan using idx_partsupp_partkey on public.partsupp (actual time=0.122..0.130 rows=4 loops=108855)-> Parallel Hash (actual time=43.378..43.378 rows=33333 loops=3)-> Parallel Seq Scan on public.supplier (actual time=0.016..96.976 rows=100000 loops=1)-> Index Scan using idx_lineitem_part_supp on public.lineitem (actual time=0.086..0.351 rows=7 loops=435420)-> Hash (actual time=321.382..321.382 rows=25 loops=3)-> Seq Scan on public.nation (actual time=321.368..321.371 rows=25 loops=3)Planning Time: 30.108 msJIT:Functions: 182Options: Inlining true, Optimization true, Expressions true, Deforming trueTiming: Generation 59.807 ms, Inlining 154.474 ms, Optimization 866.697 ms, Emission 539.179 ms, Total 1620.158 msExecution Time: 72662.415 ms(142 rows)
Limit (actual time=53927.711..54069.684 rows=1 loops=1)-> Finalize GroupAggregate (actual time=53927.710..53927.710 rows=1 loops=1)-> Gather Merge (actual time=53927.698..54069.665 rows=4 loops=1)-> Sort (actual time=53885.863..53885.865 rows=54 loops=3)-> Partial HashAggregate (actual time=53884.461..53884.900 rows=175 loops=3)-> Hash Join (actual time=51626.569..53258.211 rows=1087902 loops=3)-> Parallel Hash Join (actual time=51624.992..53052.825 rows=1087902 loops=3)-> Parallel Seq Scan on public.orders (actual time=0.195..9286.259 rows=5000000 loops=3)-> Parallel Hash (actual time=40238.570..40238.570 rows=1087902 loops=3)-> Nested Loop (actual time=68.942..39704.018 rows=1087902 loops=3)-> Parallel Hash Join (actual time=68.193..5794.431 rows=145140 loops=3)-> Nested Loop (actual time=1.703..5596.634 rows=145140 loops=3)-> Parallel Seq Scan on public.part (actual time=0.209..289.795 rows=36285 loops=3)-> Index Scan using idx_partsupp_partkey on public.partsupp (actual time=0.136..0.144 rows=4 loops=108855)-> Parallel Hash (actual time=66.231..66.231 rows=33333 loops=3)-> Parallel Seq Scan on public.supplier (actual time=0.022..57.748 rows=33333 loops=3)-> Index Scan using idx_lineitem_part_supp on public.lineitem (actual time=0.069..0.231 rows=7 loops=435420)-> Hash (actual time=0.038..0.038 rows=25 loops=3)-> Seq Scan on public.nation (actual time=0.020..0.023 rows=25 loops=3)Planning Time: 16.777 msExecution Time: 54071.434 ms(144 rows)
因此,我试图关闭enable_nestloop。得到如下结果:在PG11中启用了JIT:
Limit (cost=2417565.92..2417566.19 rows=1 width=66) (actual time=26286.402..28662.321 rows=1 loops=1)-> Finalize GroupAggregate (cost=2417565.92..2433857.53 rows=60150 width=66) (actual time=25747.698..25747.698 rows=1 loops=1)-> Gather Merge (cost=2417565.92..2431601.90 rows=120300 width=66) (actual time=25747.682..28123.594 rows=4 loops=1)-> Sort (cost=2416565.90..2416716.27 rows=60150 width=66) (actual time=25728.040..25728.045 rows=117 loops=3)-> Partial HashAggregate (cost=2410738.48..2411791.11 rows=60150 width=66) (actual time=25727.454..25727.844 rows=175 loops=3)-> Hash Join (cost=1936728.06..2388650.49 rows=1262171 width=57) (actual time=8919.348..25117.729 rows=1087902 loops=3)-> Parallel Hash Join (cost=1936726.50..2378463.21 rows=1262171 width=35) (actual time=8555.334..24580.928 rows=1087902 loops=3)-> Parallel Seq Scan on public.orders (cost=0.00..338723.33 rows=6250133 width=8) (actual time=0.034..567.581 rows=5000000 loops=3)-> Parallel Hash (cost=1911088.36..1911088.36 rows=1262171 width=39) (actual time=7466.736..7466.736 rows=1087902 loops=3)-> Parallel Hash Join (cost=1616063.36..1911088.36 rows=1262171 width=39) (actual time=6438.537..7258.071 rows=1087902 loops=3)-> Parallel Hash Join (cost=1612441.83..1904153.48 rows=1262171 width=47) (actual time=6431.432..7101.985 rows=1087902 loops=3)-> Parallel Seq Scan on public.partsupp (cost=0.00..216566.52 rows=3332652 width=22) (actual time=0.085..337.680 rows=2666667 loops=3)-> Parallel Hash (cost=1582415.26..1582415.26 rows=1262171 width=45) (actual time=5735.438..5735.438 rows=1087902 loops=3)-> Parallel Hash Join (cost=51923.86..1582415.26 rows=1262171 width=45) (actual time=87.559..5486.450 rows=1087902 loops=3)-> Parallel Seq Scan on public.lineitem (cost=0.00..1464889.92 rows=24990992 width=41) (actual time=0.019..3087.888 rows=19995351 loops=3)-> Parallel Hash (cost=51397.76..51397.76 rows=42088 width=4) (actual time=87.245..87.246 rows=36285 loops=3)-> Parallel Seq Scan on public.part (cost=0.00..51397.76 rows=42088 width=4) (actual time=0.016..243.671 rows=108855 loops=1)-> Parallel Hash (cost=2886.24..2886.24 rows=58824 width=12) (actual time=6.928..6.928 rows=33333 loops=3)-> Parallel Seq Scan on public.supplier (cost=0.00..2886.24 rows=58824 width=12) (actual time=0.012..8.941 rows=100000 loops=1)-> Hash (cost=1.25..1.25 rows=25 width=30) (actual time=363.979..363.979 rows=25 loops=3)-> Seq Scan on public.nation (cost=0.00..1.25 rows=25 width=30) (actual time=363.964..363.967 rows=25 loops=3)Planning Time: 2.046 msJIT:Functions: 218Options: Inlining true, Optimization true, Expressions true, Deforming trueTiming: Generation 16.778 ms, Inlining 76.056 ms, Optimization 950.728 ms, Emission 602.449 ms, Total 1646.010 msExecution Time: 28669.215 ms(152 rows)
Limit (cost=2417565.92..2417566.19 rows=1 width=66) (actual time=10543.751..10785.349 rows=1 loops=1)-> Finalize GroupAggregate (cost=2417565.92..2433857.53 rows=60150 width=66) (actual time=10543.751..10543.751 rows=1 loops=1)-> Gather Merge (cost=2417565.92..2431601.90 rows=120300 width=66) (actual time=10543.741..10785.333 rows=4 loops=1)-> Sort (cost=2416565.90..2416716.27 rows=60150 width=66) (actual time=10540.393..10540.396 rows=62 loops=3)-> Partial HashAggregate (cost=2410738.48..2411791.11 rows=60150 width=66) (actual time=10539.846..10540.206 rows=175 loops=3)-> Hash Join (cost=1936728.06..2388650.49 rows=1262171 width=57) (actual time=8494.973..9919.414 rows=1087902 loops=3)-> Parallel Hash Join (cost=1936726.50..2378463.21 rows=1262171 width=35) (actual time=8494.901..9720.725 rows=1087902 loops=3)-> Parallel Seq Scan on public.orders (cost=0.00..338723.33 rows=6250133 width=8) (actual time=0.021..634.898 rows=5000000 loops=3)-> Parallel Hash (cost=1911088.36..1911088.36 rows=1262171 width=39) (actual time=7348.100..7348.100 rows=1087902 loops=3)-> Parallel Hash Join (cost=1616063.36..1911088.36 rows=1262171 width=39) (actual time=6251.609..7135.988 rows=1087902 loops=3)-> Parallel Hash Join (cost=1612441.83..1904153.48 rows=1262171 width=47) (actual time=6240.936..6948.291 rows=1087902 loops=3)-> Parallel Seq Scan on public.partsupp (cost=0.00..216566.52 rows=3332652 width=22) (actual time=0.021..361.590 rows=2666667 loops=3)-> Parallel Hash (cost=1582415.26..1582415.26 rows=1262171 width=45) (actual time=5524.176..5524.176 rows=1087902 loops=3)-> Parallel Hash Join (cost=51923.86..1582415.26 rows=1262171 width=45) (actual time=120.604..5269.257 rows=1087902 loops=3)-> Parallel Seq Scan on public.lineitem (cost=0.00..1464889.92 rows=24990992 width=41) (actual time=0.023..2755.599 rows=19995351 loops=3)-> Parallel Hash (cost=51397.76..51397.76 rows=42088 width=4) (actual time=120.332..120.332 rows=36285 loops=3)-> Parallel Seq Scan on public.part (cost=0.00..51397.76 rows=42088 width=4) (actual time=0.013..114.142 rows=36285 loops=3)-> Parallel Hash (cost=2886.24..2886.24 rows=58824 width=12) (actual time=10.445..10.445 rows=33333 loops=3)-> Parallel Seq Scan on public.supplier (cost=0.00..2886.24 rows=58824 width=12) (actual time=0.010..5.438 rows=33333 loops=3)-> Hash (cost=1.25..1.25 rows=25 width=30) (actual time=0.026..0.026 rows=25 loops=3)-> Seq Scan on public.nation (cost=0.00..1.25 rows=25 width=30) (actual time=0.017..0.019 rows=25 loops=3)Planning Time: 2.665 msExecution Time: 10785.906 ms(152 rows)
如果关闭了enable_nestloop,时间会大大减少。但是查询优化器选择了嵌套循环而不是其他循环,不知道这是不是一个问题。
如果您想了解有关 explains的更多详细信息,请参阅以下链接:
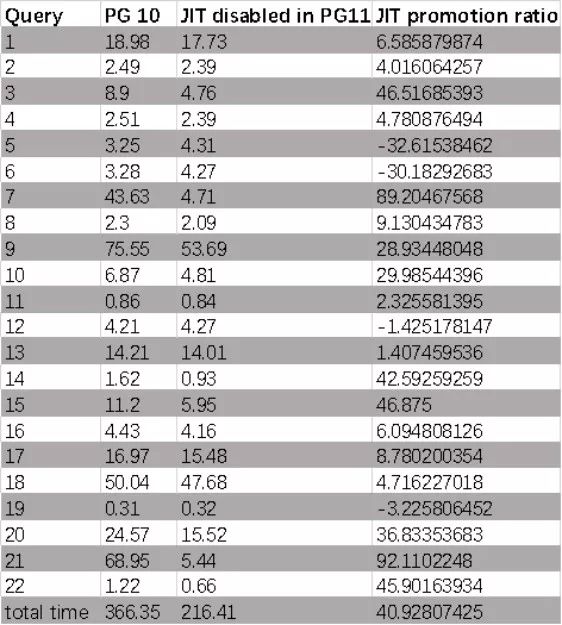
我们可以得到这样的结果(单位为秒,PG11和PG10中禁用JIT):
为了更直观,我们可以查看直方图:
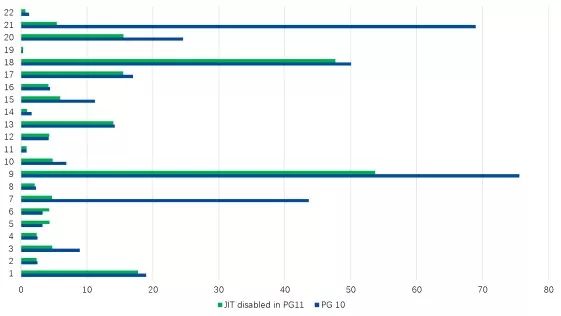
我们可以得知PG11的性能比PG10高41%。这表明PG11在性能上做了很多改进。有关详细信息,请参阅官方文档。
我们可以得到这样的结果(单位为秒,PG11和PG10中启用了JIT):
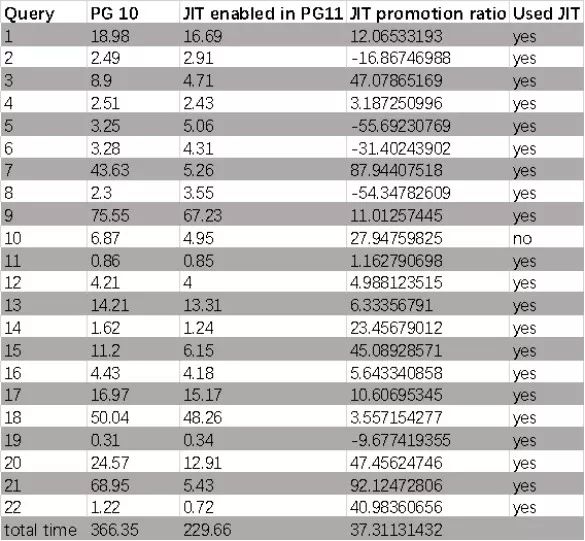
JIT表现总体概述:
我认为客观地说,JIT并不适用于所有工作负载,但是JIT为正确的工作负载提供良好的性能。在使用OLAP基准测试的情况下。我们可以认为JIT在22个查询的情况下提供了良好的性能,在某些查询中,JIT的性能降低了。
很难说一些查询的性能下降是否是由查询优化器引起的,如果优化器能够选择更好的路径会更好。我相信这可以与Oracle自适应执行计划和优化程序提示功能相比较。虽然甲骨文似乎在云中不算成功,但其数据库技术似乎仍然非常先进。
如果查询优化器可以将nestloop转换为散列连接或其他,并查看是否提供更好的性能,将非常值得尝试。llvm的基础优化技术优于人工选择。如果查询优化器出现问题,我们可以根据LLVM提供的信息改进查询优化器。这会是一个非常耗时的大项目。
所以我有3条改进建议:
添加新参数影响查询优化器获得更优的选择。
可以为PostgreSQL添加一些特殊的JIT优化过程。
可以根据LLVM提供的信息改进查询优化器。
参考
· https://www.postgresql.org/docs/11/runtime-config-developer.html
· https://www.postgresql.org/docs/9.6/parallel-query.html
· 《JIT-Compiling SQL Queries in PostgreSQL Using LLVM》
· 《The Architecture of Open Source Applications: LLVM》
原文建议PC端阅读更佳!