


如何利用 Prometheus、Grafana 监控 Node.js 应用
线上监控是确保服务正常运行必不可少的手段。本文将和大家一起了解 Prometheus 以及 Grafana,以及如何利用这两个工具监控 Node.js 应用。

为什么需要监控?
应用监控相当于一个透视镜,通过简单的工具去观察线上部署应用的运行情况。最常见的做法是,先帮应用做“健康检查”,再将应用与监控工具库结合,将运行数据发送至监控应用的服务,更高级一些,跟客户端结合,监控服务的整个链路。
测试只能去模拟生产环境,并不能完全复原线上场景。因此对于开发来说,监控很重要,它能够在线上环境 bug 发生时提醒你及时介入。
什么是 Prometheus?
Prometheus 是一个在2012年由 Soundcloud 发起的开源监控工具。2016年,它成为云原生计算基金会旗下的第二大开源项目(第一是 k8s)。
附一张架构图:
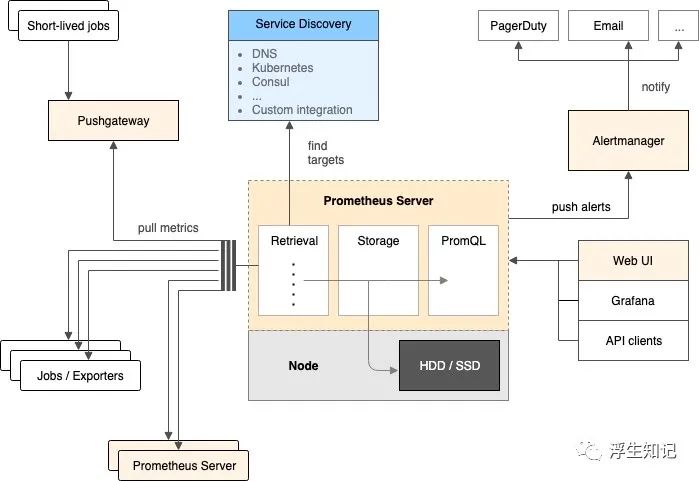
Prometheus 服务在固定的时间间隔通过 HTTP 拉取应用的 metrics 信息以及其它的监控数据。对于临时性或者需要批量处理的任务,无法定期获得相应的监控信息,Prometheus 提供了Push模式,在 metrics 销毁前进行数据推送,Push Gateway 会保留数据等待 Prometheus 服务稍后来拉取。
Prometheus 的核心数据是一个按照 metric 分组的列表,它基于时间戳排序。
利用 Prometheus 提供的 PromQL(Prometheus Query Language),可以实时查询或者聚合数据。相应的结果可以直接在 Prometheus web UI 页面查看,也开放 HTTP 接口给外部工具(例如 Grafana)使用。
Prometheus 如何在 Node.js 应用中收集数据
prom-client 是当前 Nodejs 技术选型中最火的 Prometheus 包,它支持 pull 和 push 两种方法将 metrics 数据采集并提供给 Prometheus,并且支持所有的 metrics 类型:histogram、summaries、gauges、counters。
初始化 Node 项目
新建文件夹,创建 Node.js 项目
mkdir example-nodejs-appcd example-nodejs-appnpm init -y
安装 prom-client
npm install prom-client -S
设置默认 metrics
prom-client 默认设置了一些监控指标,一般为内存使用率以及 CPU 使用率。这些指标足够完成简单的应用监控,代码设置示例如下:
const http = require('http')const url = require('url')const client = require('prom-client')// 创建 Registryconst register = new client.Registry()// 新增默认标签,默认添加到所有的 metricsregister.setDefaultLabels({app: 'example-nodejs-app'})// 默认开启 metrics 收集client.collectDefaultMetrics({ register })// 定义 HTTP 服务const server = http.createServer(async (req, res) => {解析请求路由const route = url.parse(req.url).pathnameif (route === '/metrics') {按照约定格式返回所有的 metricsres.setHeader('Content-Type', register.contentType)res.end(register.metrics())}})// 8080 端口启动服务server.listen(8080)
设置自定义 metrics
有些特定诉求,需要自定义 metrics 才能满足。例如,在 HTTP 请求中设置自定义 metrics,代码示例如下:
const http = require('http')const url = require('url')const client = require('prom-client')const register = new client.Registry()register.setDefaultLabels({app: 'example-nodejs-app'})client.collectDefaultMetrics({ register })// 创建自定义 histogram metricconst httpRequestDurationMicroseconds = new client.Histogram({name: 'http_request_duration_seconds',help: 'Duration of HTTP requests in microseconds',labelNames: ['method', 'route', 'code'],buckets: [0.1, 0.3, 0.5, 0.7, 1, 3, 5, 7, 10]})// 注册 histogramregister.registerMetric(httpRequestDurationMicroseconds)const server = http.createServer(async (req, res) => {开启计时器const end = httpRequestDurationMicroseconds.startTimer()const route = url.parse(req.url).pathnameif (route === '/metrics') {res.setHeader('Content-Type', register.contentType)res.end(register.metrics())}/ 关闭计时器并添加标签end({ route, code: res.statusCode, method: req.method })})server.listen(8080)
在命令行启动 node xxx
,现在,你可以访问 http://localhost:8080/metrics 来查看收集的 metrics。
Prometheus 如何获取已收集的 metrics
实际生产环境中可以利用 Prometheus docker 镜像来获取 metrics。
创建一个名为 prometheus.yml 的配置文件,配置内容如下:
global:scrape_interval: 5sscrape_configs:- job_name: "example-nodejs-app"static_configs:- targets: ["docker.for.mac.host.internal:8080"]
简单解释一下,以上配置告诉 Prometheus 每 5s 抓取一次,抓取的目标在 scrape_configs 中定义。Mac 上,使用特殊host docker.for.mac.host.internal
,它将解析为主机使用的内部IP地址,这样,Prometheus docker 容器就能从本地 Node.js HTTP 服务中获取 metrics;windows,则需要使用 docker.for.win.localhost
;Linux 则是 localhost
。
利用 docker run
,运行 Prometheus 容器,初始化配置文件(prometheus.yml):
docker run --rm -p 9090:9090 \-v `pwd`/prometheus.yml:/etc/prometheus/prometheus.yml \prom/prometheus:v2.20.1
windows 用户需要用工作目录替换下 pwd
字段。
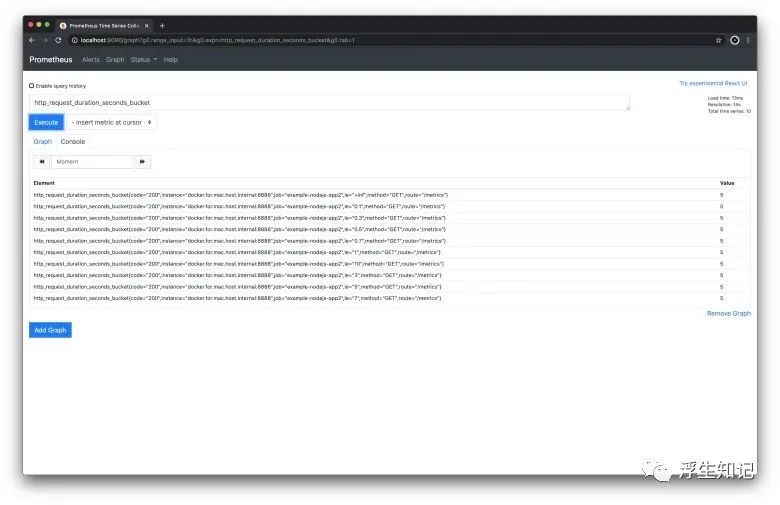
现在,你可以打开 http://localhost:9090
看下:
什么是 Grafana?
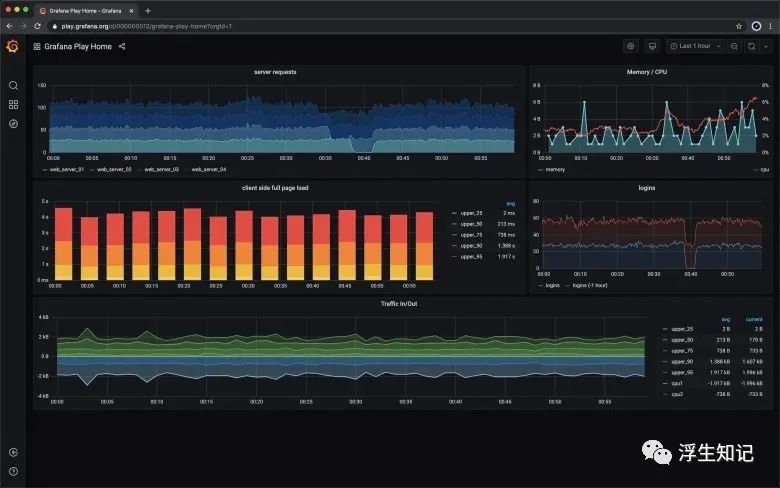
Grafana 是一个数据可视化应用,它自带了很多不同种类的图表,足以满足你的需求。同一个页面上可以存在多种类型的图表,方便同时展示不同种类的指标。
Grafana 支持多种数据源,例如 AWS CloudWatch、Azure Monitor、Prometheus。
Grafana 同时支持自定义报警,如果出现某些问题,可通过自定义的方式提醒你。
Grafana 配置
Grafana 同样可以在 docker 中配置数据源。
创建名为 datasources.yml
的配置文件,内容如下:
apiVersion: 1datasources:- name: Prometheustype: prometheusaccess: proxyorgId: 1url: http://docker.for.mac.host.internal:9090basicAuth: falseisDefault: trueeditable: true
以上配置设置了 Grafana 的数据源来自 Prometheus。注意,Mac 上使用特殊host docker.for.mac.host.internal
,这样 Grafana 可以获取到 Prometheus 的数据;windows 上,则需要使用 docker.for.win.localhost
;Linux,则使用 localhost
。
启动 Grafana docker 容器,挂载数据源配置文件。还有,记得设置一些环境变量,关闭其登录功能。
docker run --rm -p 3000:3000 \-e GF_AUTH_DISABLE_LOGIN_FORM=true \-e GF_AUTH_ANONYMOUS_ENABLED=true \-e GF_AUTH_ANONYMOUS_ORG_ROLE=Admin \-v `pwd`/datasources.yml:/etc/grafana/provisioning/datasources/datasources.yml \grafana/grafana:7.1.5
windows 用户需要替换 pwd 为工作目录路径。
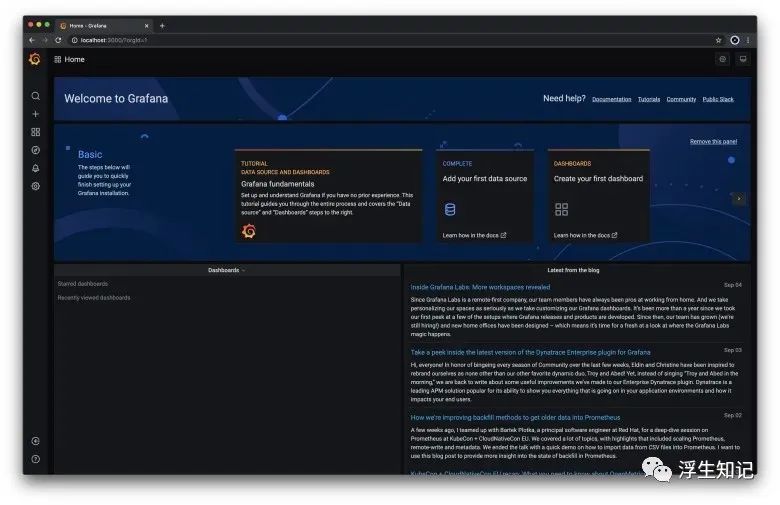
现在,你可以在 localhost:3000
看到类似下面的界面:
配置 Grafana 控制面板
如果想在 Grafana 查看 Prometheus 中的数据,需要配置一个控制面板,并且在其中添加表格:
访问 http://localhost:3000
,点击左边的+
按钮,选择dashboard在新的 dashboard 中,点击 Add new panel
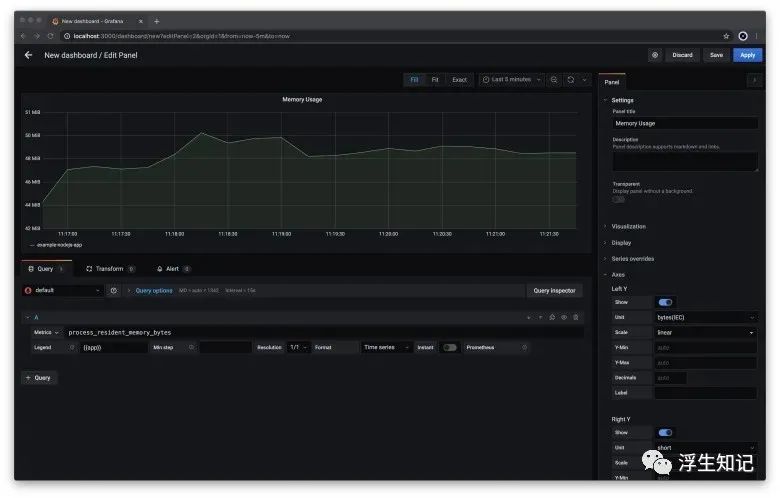
按钮在 Edit panel
面板中,选择一个 metric,并且配置图表左下角的 Metrics
输入框可以让用户自定义 metrics在 Metrics
输入框中输入process_resident_memory_bytes
,在Legend
输入框中输入{{app}}在右边栏的 Panel title
框中输入Memory UsageMetrics 的单位是比特,我们需要在坐标轴中选择Y轴的显示为 bytes(Metric)
,这样更加易读一些
经过以上几步,你应该可以看到 Node 应用中的内存使用情况图:
选择 Apply
保存配置。返回控制面板,点击右上角的 "save" 标志,会出现一个弹窗,允许你保存新创建的仪,方便以后使用。
设置 Grafana 告警
Grafana 允许你设置自定义规则,用来触发告警。根据这些规则,Grafana 定期检查指标是否符合一个特定的规则,例如,每秒错误是否有超过一个特定的阈值。
告警可以在控制面板中的每个表格中单独设置。
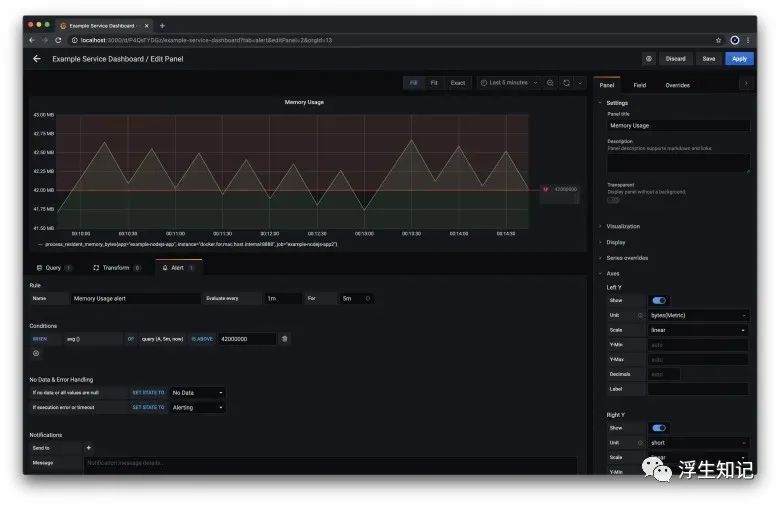
打开 Grafana 控制面板 点击图表面板的标题,选择编辑 进入编辑状态,在中间的 tab 中选择 “Alerts”,点击 Create Alert
按钮在 Conditions 区域中的 IS_ABOVE
输入 42000000。这是让 Grafana 在 Node 服务内存使用超过 42MB 的时候,触发告警在右上角点击 Apply
,保存告警规则
代码示例
clone 仓库:
git clone https://github.com/coder-society/nodejs-application-monitoring-with-prometheus-and-grafana.git
Node 应用代码存放在 /example-nodejs-app 目录。仓库中所有 docker 容器都可以简单通过 docker-compose
运行,命令如下:
docker-compose up -d
这样,Node 应用、Grafana、Prometheus 开始在后台运行。相关图表可以通过 http://localhost:3000/d/1DYaynomMk/example-service-dashboard 查看。
通过 ApacheBench command line tool
这个工具发送大量请求,来检验一下应用监控是否符合预期。
MacOS 系统自带这个工具,在 Debian 上,可以这样安装:
apt-get install apache2-utils
windows 上,可以下载二进制包,ApacheBench 在这个包中名字是 ab.exe
。
利用下面的命令向 Node 应用的 /order 接口发送 10000 次请求:
ab -m POST -n 10000 -c 100 http://localhost:8080/order
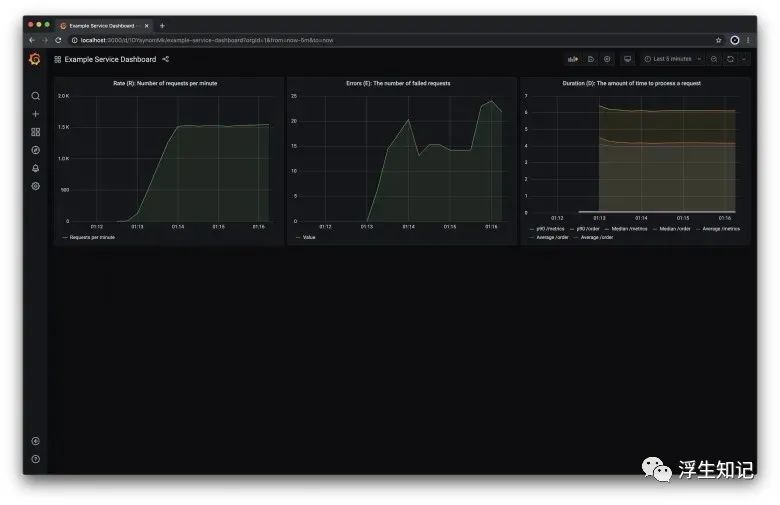
运行完成之后,你可以看下 Grafana 控制面板 http://localhost:3000/d/1DYaynomMk/example-service-dashboard
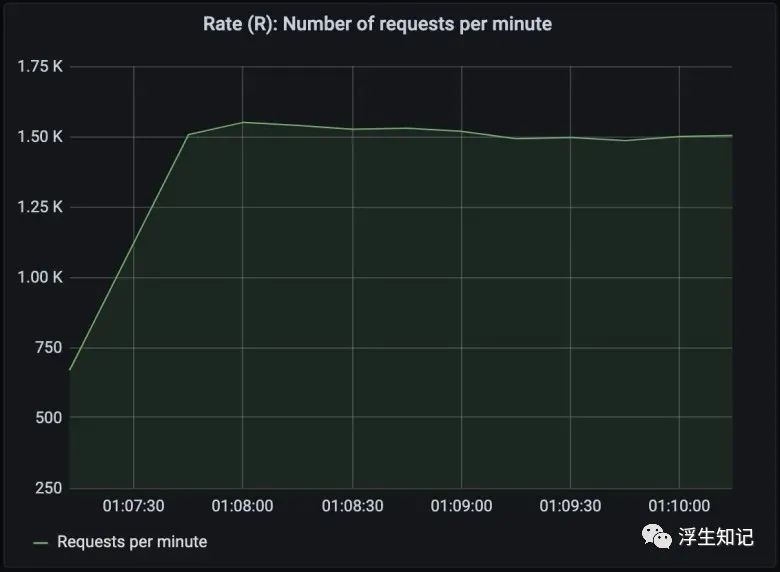
上面的图表展示了 Node 应用每分钟处理大约 1500 次请求。
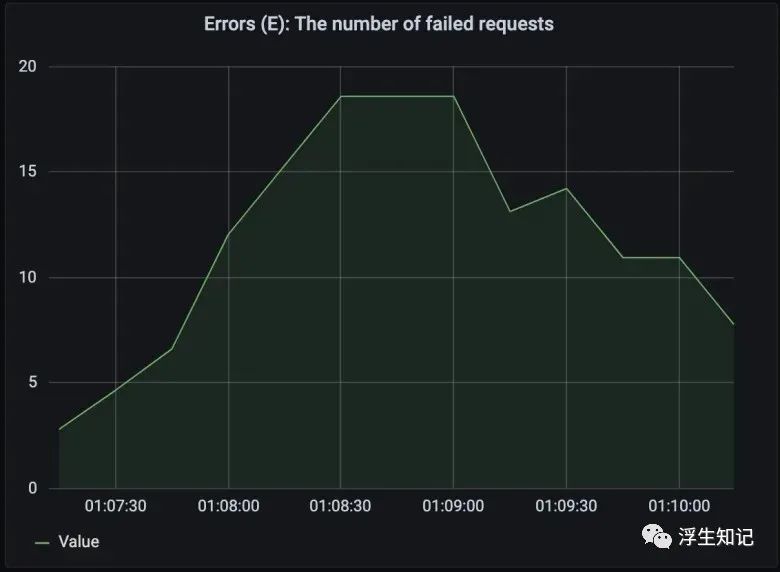
上面的图表展示 Node 应用每分钟最多 20 个错误。
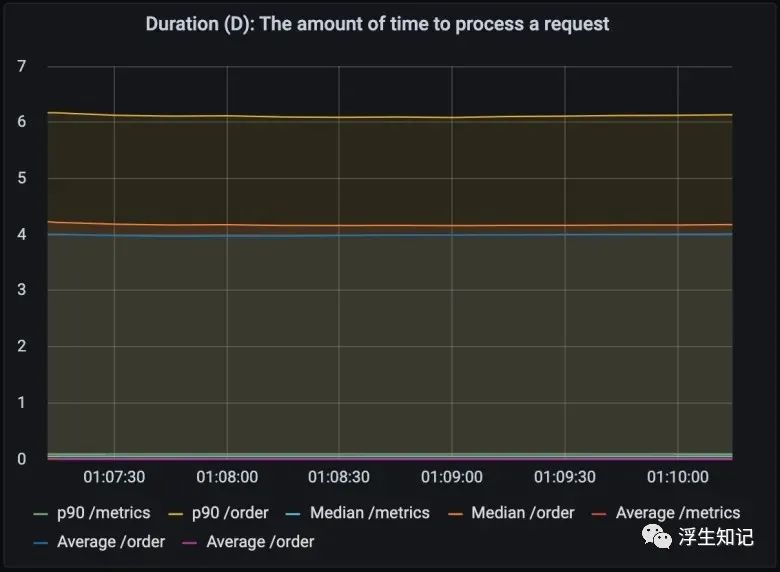
上面的图表展示了每个请求处理所需要的时间。这里展示的是90分位、中位数、平均值。90分位代表着最慢的 10% 请求所耗费的时间,这里指我们利用命令行发送的 10,000 个请求中,1000 个最慢的请求需要花费的时间。
总结
Prometheus 是一个强大的开源工具,对于不想从头开始建设监控体系,也不想花钱购买 SaaS 方案的公司,这是一个很好的选择。同时利用好 Node 社区的各种开源库,可以很好的落地一个监控体系。
Grafana 也是一个强大的开源工具,它可以与 Prometheus 很好的集成起来。它有许多优势,包括但不限定于灵活的配置、可视化任何指标的仪表,以及异常警报。
Prometheus 在收集指标方面提供了巨大的灵活性,Grafana 提供了许多不同的图表来显示这些指标,而这两者可以很好地融合在一起,这两种工具的结合为监控应用提供了一种简单的方法。
