


系统环境:CentOS 7.9
项目介绍
# List of Azure service discovery configurations.
azure_sd_configs:
  [ - <azure_sd_config> ... ]

# List of Consul service discovery configurations.
consul_sd_configs:
  [ - <consul_sd_config> ... ]

# List of DNS service discovery configurations.
dns_sd_configs:
  [ - <dns_sd_config> ... ]

# List of EC2 service discovery configurations.
ec2_sd_configs:
  [ - <ec2_sd_config> ... ]

# List of file service discovery configurations.
file_sd_configs:
  [ - <file_sd_config> ... ]

# List of DigitalOcean service discovery configurations.
digitalocean_sd_configs:
  [ - <digitalocean_sd_config> ... ]

# List of Docker Swarm service discovery configurations.
dockerswarm_sd_configs:
  [ - <dockerswarm_sd_config> ... ]

# List of GCE service discovery configurations.
gce_sd_configs:
  [ - <gce_sd_config> ... ]

# List of Kubernetes service discovery configurations.
kubernetes_sd_configs:
  [ - <kubernetes_sd_config> ... ]

# List of Marathon service discovery configurations.
marathon_sd_configs:
  [ - <marathon_sd_config> ... ]

# List of AirBnB's Nerve service discovery configurations.
nerve_sd_configs:
  [ - <nerve_sd_config> ... ]

# List of OpenStack service discovery configurations.
openstack_sd_configs:
  [ - <openstack_sd_config> ... ]

# List of Zookeeper Serverset service discovery configurations.
serverset_sd_configs:
  [ - <serverset_sd_config> ... ]

# List of Triton service discovery configurations.
triton_sd_configs:
  [ - <triton_sd_config> ... ]
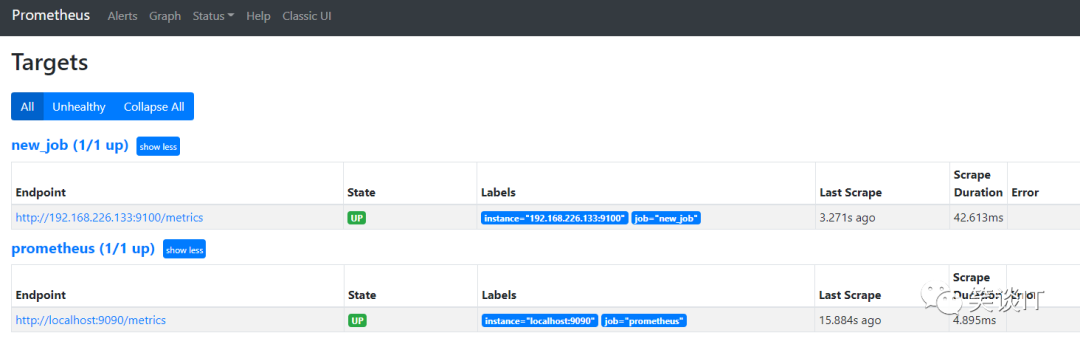
静态添加node_exporter
$ vi usr/local/prometheus/prometheus.ymlglobal:scrape_interval: 15s # Set the scrape interval to every 15 seconds. Default is every 1 minute.evaluation_interval: 15s # Evaluate rules every 15 seconds. The default is every 1 minute.# scrape_timeout is set to the global default (10s).# Alertmanager configurationalerting:alertmanagers:- static_configs:- targets:# - alertmanager:9093# Load rules once and periodically evaluate them according to the global 'evaluation_interval'.rule_files:# - "first_rules.yml"# - "second_rules.yml"# A scrape configuration containing exactly one endpoint to scrape:# Here it's Prometheus itself.scrape_configs:# The job name is added as a label `job=<job_name>` to any timeseries scraped from this config.- job_name: 'prometheus'# metrics_path defaults to '/metrics'# scheme defaults to 'http'.static_configs:- targets: ['localhost:9090']# 以下为我们新增的一个job配置文件,需严格按照格式进行编写。- job_name : 'new_job'static_configs:- targets: ['192.168.226.133:9100']
curl -X POST http://127.0.0.1:9090/-/reload
但是我们为了后期在grafana的数据看板展示和alertmanager分层分类告警等可以做到更精细化的数据分类,我们可预先增加多项自定义的labels。
- job_name : 'new_job'static_configs:- targets: ['192.168.226.133:9100']labels:Tag: 'Infrastructure'server: 'PDC'xxx: 'xxx'# labels的命名和值可随意发挥,不受任何限制

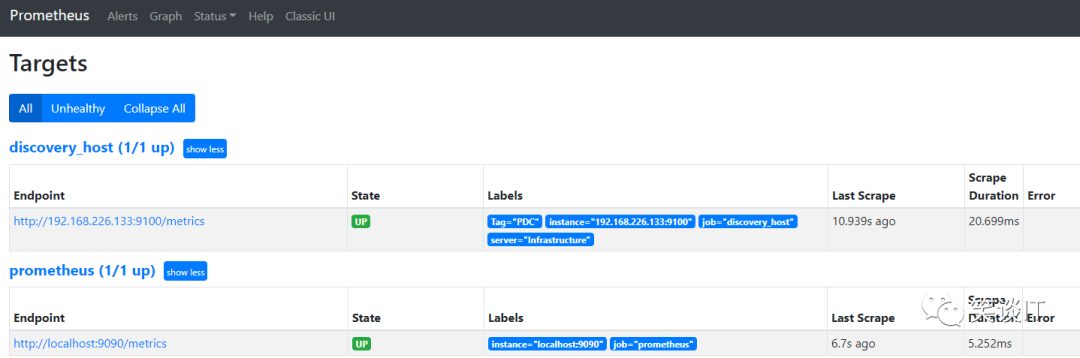
自动发现node_exporter
$ vi /usr/local/prometheus/discovery.json[{"targets": ["192.168.226.133:9100"],"labels": {"Tag": "PDC","server": "Infrastructure"}}]
$ vi /usr/local/prometheus/prometheus.yml- job_name : 'discovery_host'file_sd_configs:- files:- "/usr/local/prometheus/discovery.json"
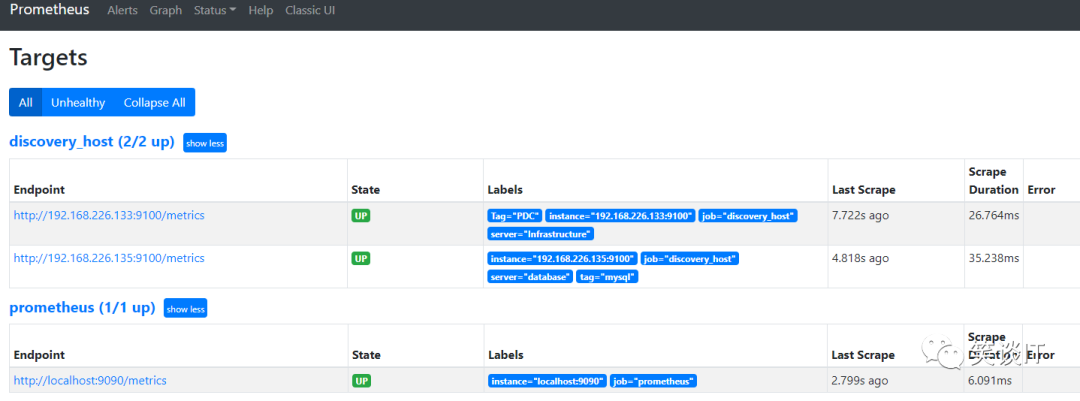
# 第一个node_exporter[{"targets": ["192.168.226.133:9100"],"labels": {"Tag": "PDC","server": "Infrastructure"}},# 第二个node_exporter{"targets": ["192.168.226.135:9100"],"labels": {"tag": "mysql","server": "database"}}]
文章转载自笑谈IT,如果涉嫌侵权,请发送邮件至:contact@modb.pro进行举报,并提供相关证据,一经查实,墨天轮将立刻删除相关内容。
