


微信公众号:云原生转型实验室
什么是Prometheus
Prometheus是由SoundCloud开发的开源监控报警系统和时序列数据库(TSDB)。Prometheus使用Go语言开发,是Google BorgMon监控系统的开源版本。
2016年由Google发起Linux基金会旗下的原生云基金会(Cloud Native Computing Foundation), 将Prometheus纳入其下第二大开源项目。
Prometheus目前在开源社区相当活跃。
Prometheus和Heapster(Heapster是K8S的一个子项目,用于获取集群的性能数据。)相比功能更完善、更全面。Prometheus性能也足够支撑上万台规模的集群。
Prometheus的特点
多维度数据模型。
灵活的查询语言。
不依赖分布式存储,单个服务器节点是自主的。
通过基于HTTP的pull方式采集时序数据。
可以通过中间网关进行时序列数据推送。
通过服务发现或者静态配置来发现目标服务对象。
支持多种多样的图表和界面展示,比如Grafana等。
架构图
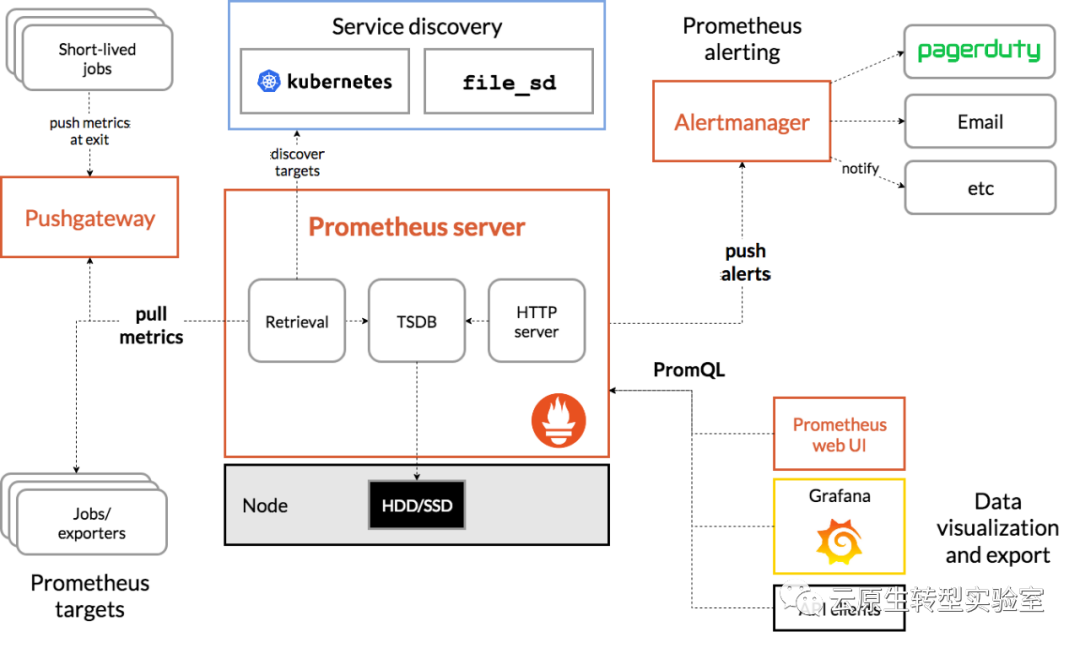
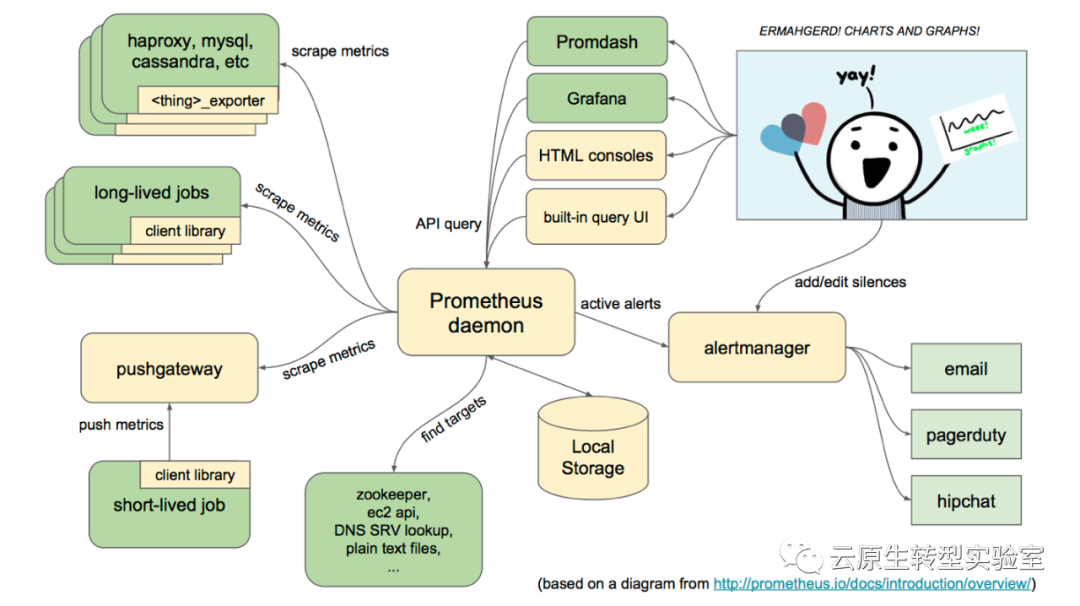
基本原理
Prometheus的基本原理是通过HTTP协议周期性抓取被监控组件的状态,任意组件只要提供对应的HTTP接口就可以接入监控。不需要任何SDK或者其他的集成过程。这样做非常适合做虚拟化环境监控系统,比如VM、Docker、Kubernetes等。输出被监控组件信息的HTTP接口被叫做exporter 。目前互联网公司常用的组件大部分都有exporter可以直接使用,比如Varnish、Haproxy、Nginx、MySQL、Linux系统信息(包括磁盘、内存、CPU、网络等等)。
服务过程
Prometheus Daemon负责定时去目标上抓取metrics(指标)数据,每个抓取目标需要暴露一个http服务的接口给它定时抓取。Prometheus支持通过配置文件、文本文件、Zookeeper、Consul、DNS SRV Lookup等方式指定抓取目标。Prometheus采用PULL的方式进行监控,即服务器可以直接通过目标PULL数据或者间接地通过中间网关来Push数据。
Prometheus在本地存储抓取的所有数据,并通过一定规则进行清理和整理数据,并把得到的结果存储到新的时间序列中。
Prometheus通过PromQL和其他API可视化地展示收集的数据。Prometheus支持很多方式的图表可视化,例如Grafana、自带的Promdash以及自身提供的模版引擎等等。Prometheus还提供HTTP API的查询方式,自定义所需要的输出。
PushGateway支持Client主动推送metrics到PushGateway,而Prometheus只是定时去Gateway上抓取数据。
Alertmanager是独立于Prometheus的一个组件,可以支持Prometheus的查询语句,提供十分灵活的报警方式。
三大套件
Server 主要负责数据采集和存储,提供PromQL查询语言的支持。
Alertmanager 警告管理器,用来进行报警。
Push Gateway 支持临时性Job主动推送指标的中间网关。
话不多说,接下来,我们从零开始搭建prometheus+grafana的监控系统
开始搭建
1.准备工作
准备一个Kubernetes集群
这里使用的为三master,两worker的集群
2.新建namespace
[root@master02 prometheus]# cat prometheus_namespace.yaml
apiVersion: v1
kind: Namespace
metadata:
  name: prometheus

[root@master02 prometheus]# kubectl apply -f prometheus_namespace.yaml
namespace/prometheus created
3.下载prometheus的chart包
[root@master02 prometheus]# helm fetch stable/prometheus
[root@master02 prometheus]# ll
total 20
-rw-r--r-- 1 root root 16405 May 28 09:55 prometheus-5.4.0.tgz
[root@master02 prometheus]# tar -zxvf prometheus-5.4.0.tgz
4.修改values.yaml文件,将node-exporter中的tolerations作修改
tolerations:
     - key: node-role.kubernetes.io/master
       operator: "Exists"
  #    value: "value"
       effect: "NoSchedule"
5.新建PV的yaml文件
[root@master02 prometheus]# cat pv-alertmanager_2g.yaml
apiVersion: v1
kind: PersistentVolume
metadata:
  name: alertmanager-2g
spec:
  capacity:
    storage: 2Gi
  volumeMode: Filesystem
  accessModes:
    - ReadWriteOnce
# persitentVolumeReclaimPolicy: Retain
  nfs:
    server: 192.168.188.130
    path: /home/mydata/prometheus/volumes/alertmanager_2g
[root@master02 prometheus]# cat pv-prometheus-server_8g.yaml
apiVersion: v1
kind: PersistentVolume
metadata:
  name: prometheus-server-8g
spec:
  capacity:
    storage: 8Gi
  volumeMode: Filesystem
  accessModes:
    - ReadWriteOnce
# persistentVolumeReclaimPolicy: Retain
  nfs:
    server: 192.168.188.130
    path: /home/mydata/prometheus/volumes/prometheus-server_8g
6.使用helm安装prometheus
[root@master02 prometheus]# helm install prometheus prometheus -n prometheus
NAME: prometheus
LAST DEPLOYED: Thu May 28 16:03:48 2020
NAMESPACE: prometheus
STATUS: deployed
REVISION: 1
TEST SUITE: None
NOTES:
The Prometheus server can be accessed via port 80 on the following DNS name from within your cluster:
prometheus-prometheus-server.prometheus.svc.cluster.local


Get the Prometheus server URL by running these commands in the same shell:
  export POD_NAME=$(kubectl get pods --namespace prometheus -l "app=prometheus,component=server" -o jsonpath="{.items[0].metadata.name}")
  kubectl --namespace prometheus port-forward $POD_NAME 9090


The Prometheus alertmanager can be accessed via port 80 on the following DNS name from within your cluster:
prometheus-prometheus-alertmanager.prometheus.svc.cluster.local


Get the Alertmanager URL by running these commands in the same shell:
  export POD_NAME=$(kubectl get pods --namespace prometheus -l "app=prometheus,component=alertmanager" -o jsonpath="{.items[0].metadata.name}")
  kubectl --namespace prometheus port-forward $POD_NAME 9093


The Prometheus PushGateway can be accessed via port 9091 on the following DNS name from within your cluster:
prometheus-prometheus-pushgateway.prometheus.svc.cluster.local


Get the PushGateway URL by running these commands in the same shell:
  export POD_NAME=$(kubectl get pods --namespace prometheus -l "app=prometheus,component=pushgateway" -o jsonpath="{.items[0].metadata.name}")
  kubectl --namespace prometheus port-forward $POD_NAME 9091

For more information on running Prometheus, visit:
https://prometheus.io/
7.创建PV
查看PVC
[root@master02 prometheus]# kubectl get pvc -n prometheus
NAME                                                  STATUS    VOLUME           CAPACITY   ACCESS MODES   STORAGECLASS   AGE
prometheus-prometheus-alertmanager                    Pending                                                             105s
prometheus-prometheus-server                          Pending                                                             105s
创建PV,最好根据容量大小从小到大逐步创建pv
[root@master02 prometheus]# kubectl create -f pv-alertmanager_2g.yaml
persistentvolume/alertmanager-2g created
[root@master02 prometheus]# kubectl create -f pv-prometheus-server_8g.yaml
persistentvolume/prometheus-server-8g created
查看PVC,已全部关联
[root@master02 prometheus]# kubectl get pvc -n prometheus
NAME                                                  STATUS   VOLUME                 CAPACITY   ACCESS MODES   STORAGECLASS   AGE
prometheus-prometheus-alertmanager                    Bound    alertmanager-2g        2Gi        RWO                           6m14s
prometheus-prometheus-server                          Bound    prometheus-server-8g   8Gi        RWO                           6m14s
8.查看所有的pod,可能发现的问题及解决方案
prometheus-server的pod起不来,查看日志发现:
level=error ts=2020-05-28T07:14:50.669Z caller=main.go:740 err="error loading config from \"/etc/config/prometheus.yml\": couldn't load configuration (--config.file=\"/etc/config/prometheus.yml\"): parsing YAML file /etc/config/prometheus.yml: yaml: line 161: mapping values are not allowed in this context"
解决方案:
[root@master01 docker]# kubectl edit configmap -n prometheus prometheus-prometheus-server
定位到
- action: replace
        source_labels:
        - __meta_kubernetes_pod_name
        target_label: kubernetes_pod_namealerting:
      alertmanagers:
      - kubernetes_sd_configs:
          - role: pod
        tls_config:
修改为:
 - action: replace
        source_labels:
        - __meta_kubernetes_pod_name
        target_label: kubernetes_pod_name
    alerting:
      alertmanagers:
      - kubernetes_sd_configs:
          - role: pod
        tls_config:
重启该pod
[root@master01 docker]# kubectl delete pod prometheus-prometheus-server-557cb5bcd6-kb4p6 -n prometheus
pod "prometheus-prometheus-server-557cb5bcd6-kb4p6" deleted
[root@master01 docker]# kubectl get pod -n prometheus
prometheus-prometheus-alertmanager-5fcbf5f9f5-jxf5n         2/2     Running                0          20h
prometheus-prometheus-kube-state-metrics-5b4f99f9b9-q5pff   1/1     Running                8          20h
prometheus-prometheus-node-exporter-2lptx                   1/1     Running                0          28h
prometheus-prometheus-node-exporter-cnmzw                   1/1     Running                0          28h
prometheus-prometheus-node-exporter-gzpvm                   1/1     Running                0          28h
prometheus-prometheus-node-exporter-wqd9j                   1/1     Running                1          28h
prometheus-prometheus-node-exporter-wwrxc                   1/1     Running                0          28h
prometheus-prometheus-pushgateway-6b6d56dd95-5sw7t          1/1     Running                0          20h
prometheus-prometheus-server-85bd6884cf-rk7jh               2/2     Running                0          20h
9.修改prometheus的访问为Nodeport类型
[root@master01 tmp]# kubectl patch svc -n prometheus prometheus-server -p '{"spec":{"type":"NodePort"}}'
service/prometheus-server patched
[root@master01 tmp]# kubectl get svc -n prometheus
NAME                            TYPE        CLUSTER-IP       EXTERNAL-IP   PORT(S)        AGE
prometheus-alertmanager         ClusterIP   10.109.145.201   <none>        80/TCP         18d
prometheus-kube-state-metrics   ClusterIP   10.103.151.118   <none>        8080/TCP       18d
prometheus-node-exporter        ClusterIP   None             <none>        9100/TCP       18d
prometheus-pushgateway          ClusterIP   10.110.80.40     <none>        9091/TCP       18d
prometheus-server               NodePort    10.108.180.16    <none>        80:30744/TCP   18d
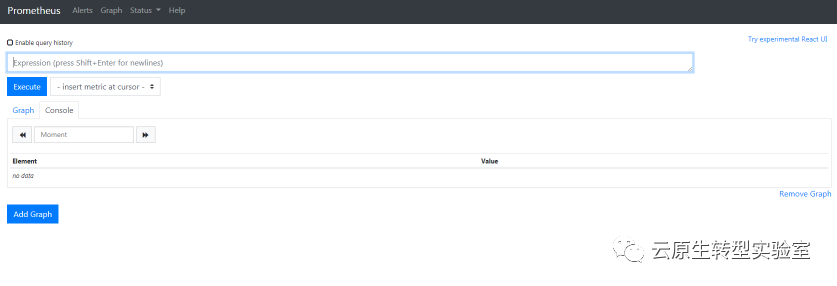
10.打开网页:http://192.168.188.133:30744查看
11.下载grafana的chart包并解压
[root@master03 grafana]# ls
grafana-0.7.0.tgz
[root@master03 grafana]# tar -xvf grafana-0.7.0.tgz
12.修改values.yaml文件
    hosts:
      - boc.grafana.com

    adminUser: "admin"
    adminPassword: "admin"
13.修改templates/deployment.yaml文件
在spec下增加:
spec:
  replicas: {{ .Values.server.replicaCount }}
  selector:                                      #增加的内容
    matchLabels:                                 #增加的内容
      app: {{ template "grafana.fullname" . }}   #增加的内容
14.helm安装grafana
[root@master03 grafana]# helm install grafana grafana -n prometheus
NAME: grafana
LAST DEPLOYED: Wed Jun 10 14:31:20 2020
NAMESPACE: prometheus
STATUS: deployed
REVISION: 1
TEST SUITE: None
NOTES:
1. Get your 'admin' user password by running:

   kubectl get secret --namespace prometheus grafana-grafana -o jsonpath="{.data.grafana-admin-password}" | base64 --decode ; echo

2. The Grafana server can be accessed via port 80 on the following DNS name from within your cluster:

   grafana-grafana.prometheus.svc.cluster.local

   From outside the cluster, the server URL(s) are:
     http://boc.grafana.com


3. Login with the password from step 1 and the username: admin
15.查看PVC并创建PV
[root@master03 grafana]# kubectl get pvc -n prometheus
NAME                                 STATUS    VOLUME                 CAPACITY   ACCESS MODES   STORAGECLASS   AGE
grafana-grafana                      Pending                                                                   4m44s
prometheus-prometheus-alertmanager   Bound     alertmanager-2g        2Gi        RWO                           27h
prometheus-prometheus-server         Bound     prometheus-server-8g   8Gi        RWO                           27h
有个grafana-grafana的PVC是pending状态,因此我们创建相应的PV
[root@master03 grafana]# cat pv-grafana.yaml
apiVersion: v1
kind: PersistentVolume
metadata:
  name: pv-grafana
spec:
  accessModes:
  -  ReadWriteOnce
  capacity:
    storage: 1Gi
  nfs:
    path: /home/leed/grafana/data
    server: 22.196.66.36
# persistentVolumeReclaimPolicy: Retain
这里的nfs挂载地址使用之前相同方法建立即可
[root@master03 grafana]# kubectl create -f pv-grafana.yaml
persistentvolume/pv-grafana created
[root@master03 grafana]# kubectl get pvc -n prometheus
NAME                                 STATUS   VOLUME                 CAPACITY   ACCESS MODES   STORAGECLASS   AGE
grafana-grafana                      Bound    pv-grafana             1Gi        RWO                           12m
prometheus-prometheus-alertmanager   Bound    alertmanager-2g        2Gi        RWO                           28h
prometheus-prometheus-server         Bound    prometheus-server-8g   8Gi        RWO                           28h
bonding成功
16.查看grafana的pod是否全部正常运行
[root@master03 grafana]# kubectl get pod -n prometheus
NAME                                                        READY   STATUS                 RESTARTS   AGE
grafana-grafana-77576945c6-58dv2                            1/1     Running                0          16m
prometheus-prometheus-alertmanager-5fcbf5f9f5-jxf5n         2/2     Running                0          20h
prometheus-prometheus-kube-state-metrics-5b4f99f9b9-q5pff   1/1     Running                8          20h
prometheus-prometheus-node-exporter-2lptx                   1/1     Running                0          28h
prometheus-prometheus-node-exporter-cnmzw                   1/1     Running                0          28h
prometheus-prometheus-node-exporter-gzpvm                   1/1     Running                0          28h
prometheus-prometheus-node-exporter-wqd9j                   1/1     Running                1          28h
prometheus-prometheus-node-exporter-wwrxc                   1/1     Running                0          28h
prometheus-prometheus-pushgateway-6b6d56dd95-5sw7t          1/1     Running                0          20h
prometheus-prometheus-server-85bd6884cf-rk7jh               2/2     Running                0          20h
17.因为我们的grafana是使用ingress来进行访问的,因此改用NodePort方式来访问
[root@master03 grafana]# kubectl patch svc -n prometheus grafana-grafana -p '{"spec":{"type":"NodePort"}}'
service/grafana-grafana patched
在浏览器输入相应的IP:Port即可访问

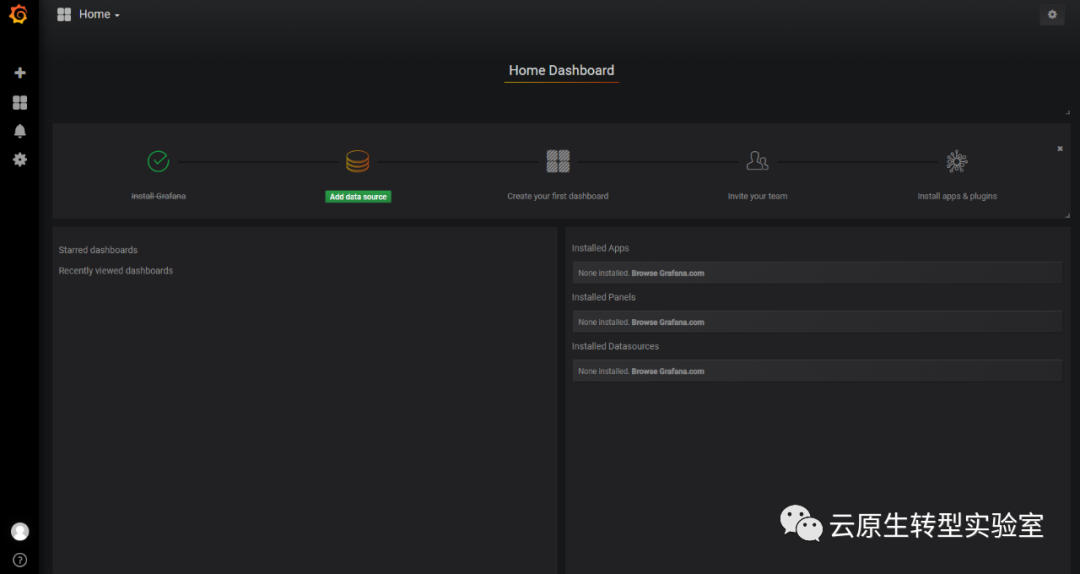
18.使用默认的用户名密码登陆,进入grafana界面
先增加数据源,点击Add data source,并填写相应的信息
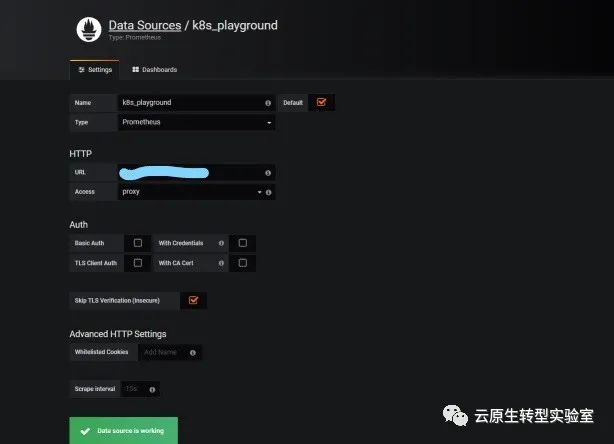
这里URL填写为service的地址和端口,我们填写为:http://10.108.180.16:80
我们选择一个常用的prometheus监控面板,prometheus_dashboard20191102.json,将其导入

