


Prometheus 简介
Prometheus 是一套开源的系统监控报警框架。它启发于 Google 的 borgmon 监控系统,由工作在 SoundCloud 的 google 前员工在 2012 年创建,作为社区开源项目进行开发,并于 2015 年正式发布。2016 年,Prometheus 正式加入 Cloud Native Computing Foundation,成为受欢迎度仅次于 Kubernetes 的项目。
Prometheus的特点
多维度数据模型。
灵活的查询语言。
不依赖分布式存储,单个服务器节点是自主的。
通过基于HTTP的pull方式采集时序数据。
可以通过中间网关进行时序列数据推送。
通过服务发现或者静态配置来发现目标服务对象。
支持多种多样的图表和界面展示,比如Grafana等。
Grafana简介
展示方式:快速灵活的客户端图表,面板插件有许多不同方式的可视化指标和日志,官方库中具有丰富的仪表盘插件,比如热图、折线图、图表等多种展示方式;
数据源:Graphite,InfluxDB,OpenTSDB,Prometheus,Elasticsearch,CloudWatch和KairosDB等;
通知提醒:以可视方式定义最重要指标的警报规则,Grafana将不断计算并发送通知,在数据达到阈值时通过Slack、PagerDuty等获得通知;
混合展示:在同一图表中混合使用不同的数据源,可以基于每个查询指定数据源,甚至自定义数据源;
注释:使用来自不同数据源的丰富事件注释图表,将鼠标悬停在事件上会显示完整的事件元数据和标记;
过滤器:Ad-hoc过滤器允许动态创建新的键/值过滤器,这些过滤器会自动应用于使用该数据源的所有查询
部署环境
我们基于上一章节的搭建的k8s集群环境开始搭建监控
[root@k8s-master prometheus]# kubectl get node -o wideNAME STATUS ROLES AGE VERSION INTERNAL-IP EXTERNAL-IP OS-IMAGE KERNEL-VERSION CONTAINER-RUNTIMEk8s-master Ready master 5h51m v1.14.3 192.168.3.11 <none> CentOS Linux 7 (Core) 3.10.0-693.el7.x86_64 docker://18.9.6k8s-node Ready <none> 5h26m v1.14.3 192.168.3.12 <none> CentOS Linux 7 (Core) 3.10.0-693.el7.x86_64 docker://18.9.6
步骤
下载node-exporter.yaml文件
wget https://raw.githubusercontent.com/redhatxl/k8s-prometheus-grafana/master/node-exporter.yaml
下载prometheus的yaml文件
for file in configmap.yaml prometheus.deploy.yml prometheus.svc.yml rbac-setup.yaml;do wget https://raw.githubusercontent.com/redhatxl/k8s-prometheus-grafana/master/prometheus/$file;done
下载Grafana的yaml文件
for file in grafana-deploy.yaml grafana-ing.yaml grafana-svc.yaml;do wget https://raw.githubusercontent.com/redhatxl/k8s-prometheus-grafana/master/grafana/$file;done
下载完成后的yaml文件如下
[root@k8s-master prometheus]# lsconfigmap.yaml grafana-ing.yaml node-exporter.yaml prometheus.svc.ymlgrafana-deploy.yaml grafana-svc.yaml prometheus.deploy.yml rbac-setup.yaml
执行kubectl apply,这里执行到文件路径,标志所有文件一起执行
[root@k8s-master prometheus]# kubectl apply -f .configmap/prometheus-config createddeployment.extensions/grafana-core createdingress.extensions/grafana createdservice/grafana createddaemonset.extensions/node-exporter createdservice/node-exporter createddeployment.apps/prometheus createdservice/prometheus createdclusterrole.rbac.authorization.k8s.io/prometheus createdserviceaccount/prometheus createdclusterrolebinding.rbac.authorization.k8s.io/prometheus created[root@k8s-master prometheus]#
检查pod信息是否正常启动
[root@k8s-master prometheus]# kubectl get pod -n kube-systemNAME READY STATUS RESTARTS AGEcalico-node-n94jx 2/2 Running 2 5h45mcalico-node-v8hjk 2/2 Running 2 5h45mcoredns-8686dcc4fd-4llpz 1/1 Running 1 6h32mcoredns-8686dcc4fd-84ncr 1/1 Running 1 6h32metcd-k8s-master 1/1 Running 3 6h31mgrafana-core-5f7c6c786b-n88t9 1/1 Running 0 5m3skube-apiserver-k8s-master 1/1 Running 4 6h31mkube-controller-manager-k8s-master 1/1 Running 3 6h31mkube-proxy-s225t 1/1 Running 3 6h7mkube-proxy-ws8vw 1/1 Running 3 6h32mkube-scheduler-k8s-master 1/1 Running 3 6h31mkubernetes-dashboard-5f7b999d65-hzlhq 1/1 Running 2 4h49mnode-exporter-fprhz 1/1 Running 0 5m3sprometheus-6b96dcbd87-vk6t6 1/1 Running 0 5m2s
排查grafana的pod
kubectl describe pod grafana-core-5f7c6c786b-n88t9 -n kube-system#错误信息如下kubelet, k8s-node Readiness probe failed: Get http://10.244.1.6:3000/login: dial tcp 10.244.1.6:3000: connect: connection refused
查看各个service
[root@k8s-master prometheus]# kubectl get svc -n kube-systemNAME TYPE CLUSTER-IP EXTERNAL-IP PORT(S) AGEcalico-typha ClusterIP 10.103.106.58 <none> 5473/TCP 5h46mgrafana NodePort 10.103.69.39 <none> 3000:31233/TCP 5m55skube-dns ClusterIP 10.96.0.10 <none> 53/UDP,53/TCP,9153/TCP 6h33mkubernetes-dashboard NodePort 10.96.74.126 <none> 443:30000/TCP 4h50mnode-exporter NodePort 10.106.229.88 <none> 9100:31672/TCP 5m54sprometheus NodePort 10.102.81.136 <none> 9090:30003/TCP 5m54s
根据service验证各个pod
验证node-export
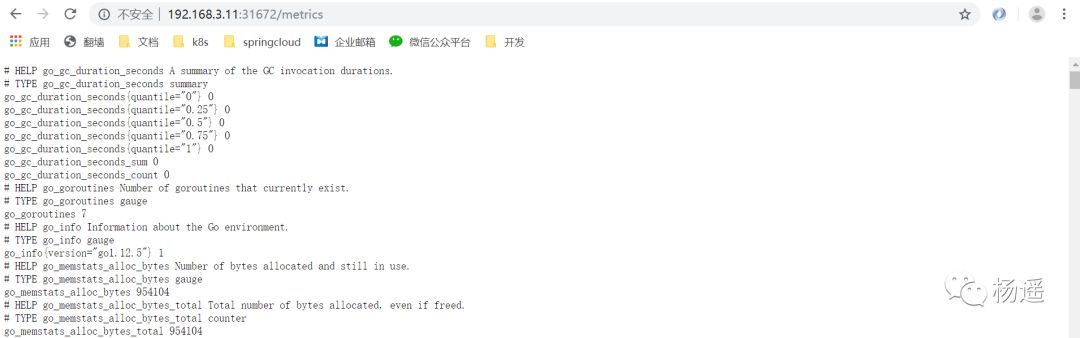
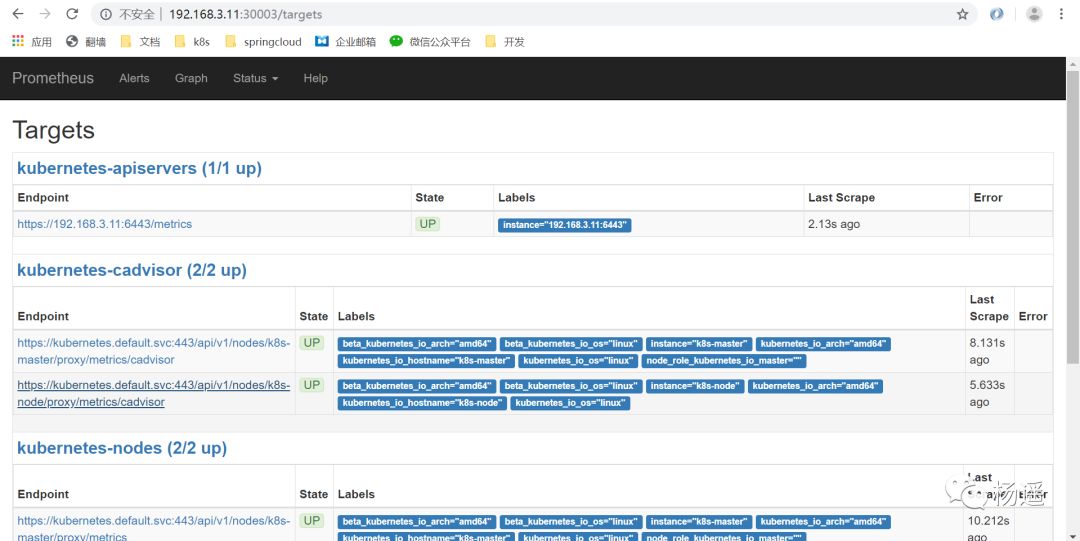
验证prometheus
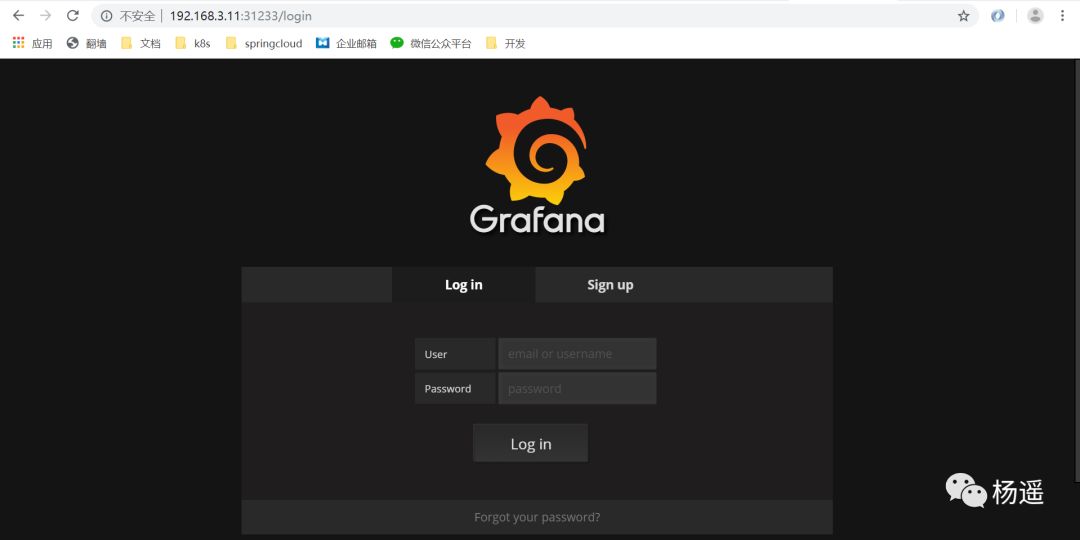
验证grafana,正常情况下出现登录页面admin/admin
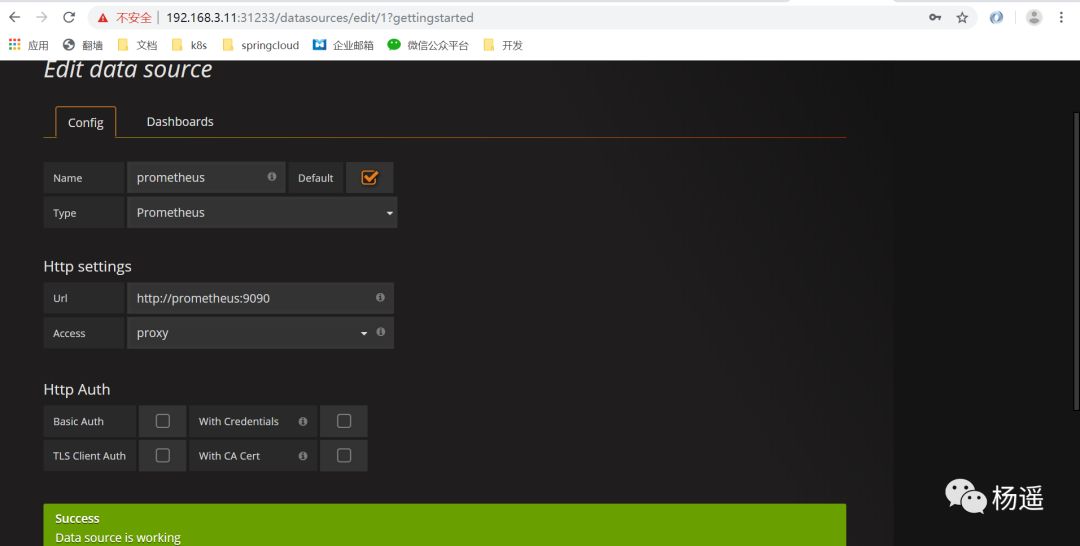
登录后我们添加数据源和模板信息
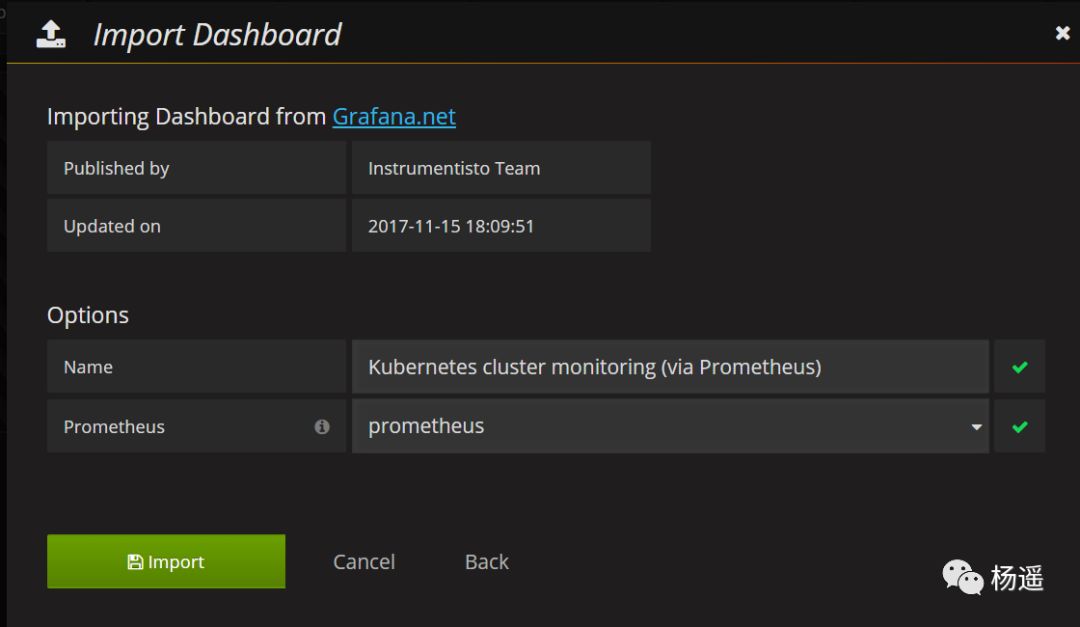
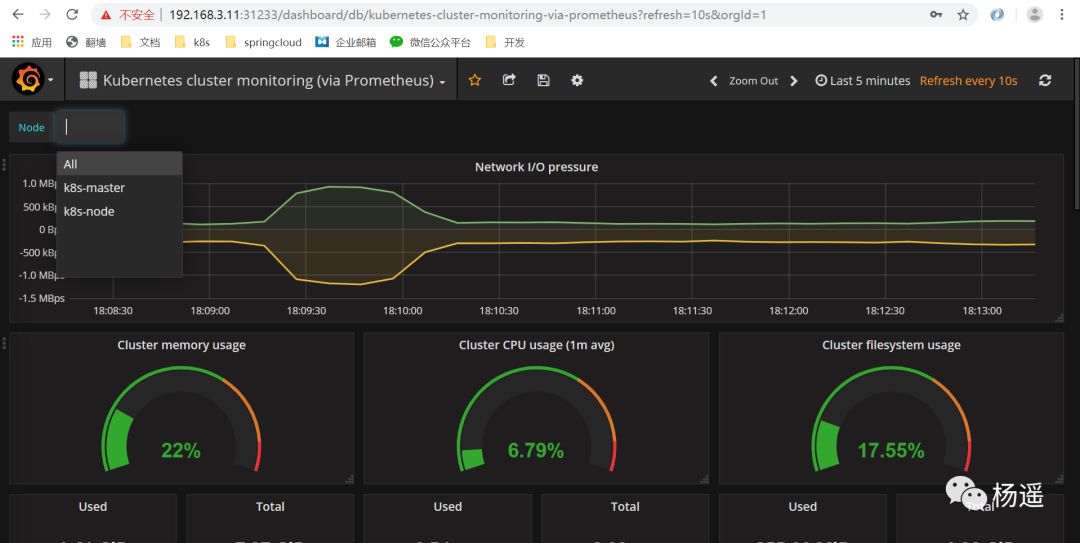
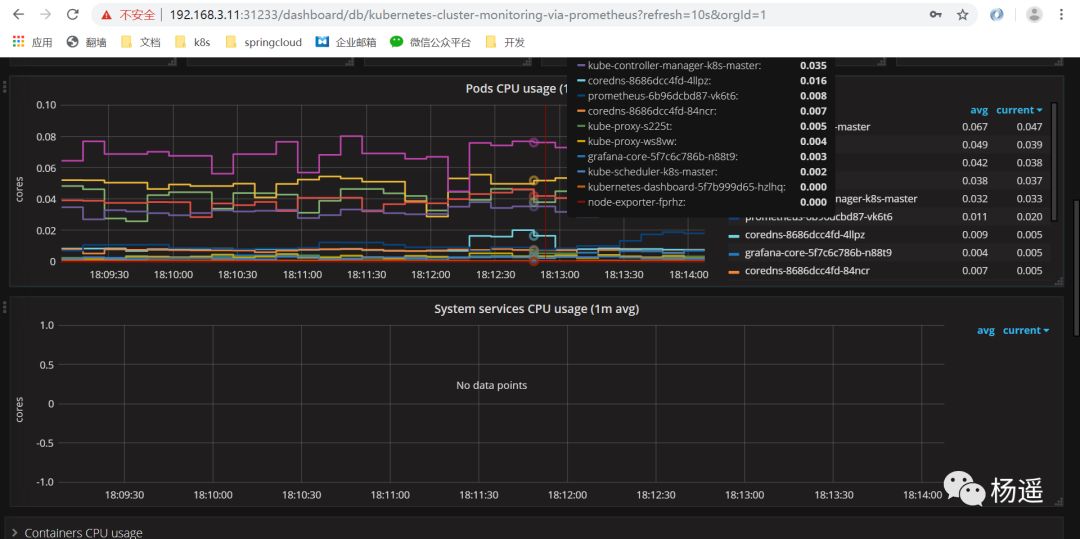
配置好数据源和模板后我们将会看到如下监控cpu和内存信息,我们采用的是官方315模板,你可以使用更多的模板更炫酷的监控k8s集群信息
告警我们需要借助prometheus的alert,这里我们就讲述了,这个需要自己根据实际需求写告警规则,用k8s部署一个alret的pod运行告警监控。
