


sysbench mysql
sysbench是一款压力测试工具,可以针对当前服务器情况和数据库情况进行压力模拟,从而得到当前服务器和数据库的性能情况。
下载地址:
https://github.com/akopytov/sysbench/
这里会得到一个名叫sysbench-master.zip的文件
我们进入系统进行安装:

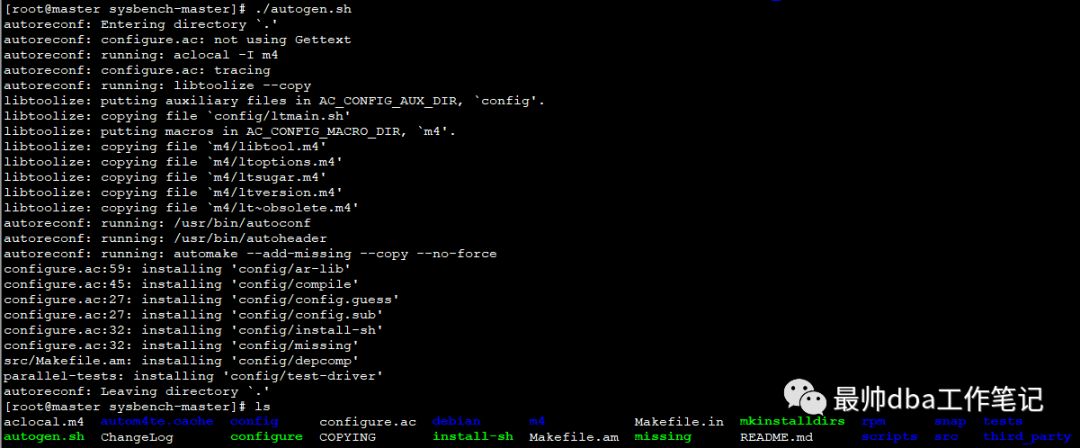
使用autogen.sh进行创建configure文件进行安装
./configure && make && make install 进行编译安装,这里是用于mysql的默认路径安装
我们查看一下sysbench的版本:

这里在使用上之前的版本有一些区别,我们在之后说明。
设置环境变量:
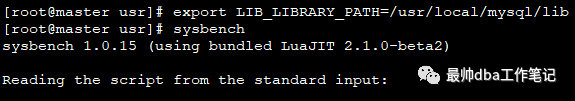
这里的目的是为了可以使用sysbench的命令。
查看一下sysbench的参数:
[root@master usr]# sysbench --help
Usage:
sysbench [options]... [testname] [command]
Commands implemented by most tests: prepare run cleanup help
General options:
--threads=N number of threads to use [1]
--events=N limit for total number of events [0]
--time=N limit for total execution time in seconds [10]
--forced-shutdown=STRING number of seconds to wait after the --time limit before forcing shutdown, or 'off' to disable [off]
--thread-stack-size=SIZE size of stack per thread [64K]
--rate=N average transactions rate. 0 for unlimited rate [0]
--report-interval=N periodically report intermediate statistics with a specified interval in seconds. 0 disables intermediate reports [0]
--report-checkpoints=[LIST,...] dump full statistics and reset all counters at specified points in time. The argument is a list of comma-separated values representing the amount of time in seconds elapsed from start of test when report checkpoint(s) must be performed. Report checkpoints are off by default. []
--debug[=on|off] print more debugging info [off]
--validate[=on|off] perform validation checks where possible [off]
--help[=on|off] print help and exit [off]
--version[=on|off] print version and exit [off]
--config-file=FILENAME File containing command line options
--tx-rate=N deprecated alias for --rate [0]
--max-requests=N deprecated alias for --events [0]
--max-time=N deprecated alias for --time [0]
--num-threads=N deprecated alias for --threads [1]
Pseudo-Random Numbers Generator options:
--rand-type=STRING random numbers distribution {uniform,gaussian,special,pareto} [special]
--rand-spec-iter=N number of iterations used for numbers generation [12]
--rand-spec-pct=N percentage of values to be treated as 'special' (for special distribution) [1]
--rand-spec-res=N percentage of 'special' values to use (for special distribution) [75]
--rand-seed=N seed for random number generator. When 0, the current time is used as a RNG seed. [0]
--rand-pareto-h=N parameter h for pareto distribution [0.2]
Log options:
--verbosity=N verbosity level {5 - debug, 0 - only critical messages} [3]
--percentile=N percentile to calculate in latency statistics (1-100). Use the special value of 0 to disable percentile calculations [95]
--histogram[=on|off] print latency histogram in report [off]
General database options:
--db-driver=STRING specifies database driver to use ('help' to get list of available drivers) [mysql]
--db-ps-mode=STRING prepared statements usage mode {auto, disable} [auto]
--db-debug[=on|off] print database-specific debug information [off]
Compiled-in database drivers:
mysql - MySQL driver
mysql options:
--mysql-host=[LIST,...] MySQL server host [localhost]
--mysql-port=[LIST,...] MySQL server port [3306]
--mysql-socket=[LIST,...] MySQL socket
--mysql-user=STRING MySQL user [sbtest]
--mysql-password=STRING MySQL password []
--mysql-db=STRING MySQL database name [sbtest]
--mysql-ssl[=on|off] use SSL connections, if available in the client library [off]
--mysql-ssl-cipher=STRING use specific cipher for SSL connections []
--mysql-compression[=on|off] use compression, if available in the client library [off]
--mysql-debug[=on|off] trace all client library calls [off]
--mysql-ignore-errors=[LIST,...] list of errors to ignore, or "all" [1213,1020,1205]
--mysql-dry-run[=on|off] Dry run, pretend that all MySQL client API calls are successful without executing them [off]
Compiled-in tests:
fileio - File I/O test
cpu - CPU performance test
memory - Memory functions speed test
threads - Threads subsystem performance test
mutex - Mutex performance test
See 'sysbench <testname> help' for a list of options for each test.
进行测试:
测试的规则是将mysql数据库当中的数据库进行数据模拟,插入随机数,从而生成压力。
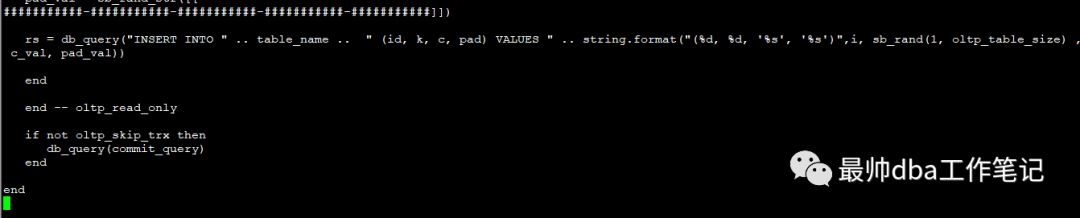
我们这里讲一下早些版本和现在这个版本的区别,sysbench都会用到一个脚本,这个脚本生成对应的sql语句等,
我们找一下这个脚本的位置

我们简单看一下这个脚本的内容
在之前的版本会用到一个参数--test去指定这个脚本的全路径,当然这个脚本可以自己编译,但是现在这个版本当中,不需要加--test参数,直接写路径即可:
sysbench usr/local/share/sysbench/tests/include/oltp_legacy/oltp.lua --mysql-host=localhost --mysql-port=3306 --mysql-user=root --mysql-password=oracle --oltp-test-mode=complex --oltp-tables-count=10 --oltp-table-size=100000 --threads=10 --time=120 --report-interval=10 --mysql-socket=/var/lib/mysql/mysql.sock prepare

--mysql-host= 数据库主机ip
--mysql-port= 端口
--mysql-user= 用户名
--mysql-password= 密码
--oltp-test-mode=complex 这个参数值控制测试类型,simple(select测试),complex(事务),nontrx(非实物测试),sp(存储过程),该参数默认complex
--oltp-sp-name= 执行存储过程的语句(如果oltp-test-mode =sp)
--oltp-table-count= 控制产生多少张表
--oltp-table-size= 一个表当中的行数,或者称之为填充量
--threads= 并发线程数
--time= 限制总执行时间是多久,时间是秒
--report-interval= 定期报告中间统计数据,时间间隔为秒
--mysql-socket= mysqlsocket文件
prepare 是准备在数据库当中创建测试表。
执行之前需要创建数据库名为sbtest。
我们查看一下数据库产生的表
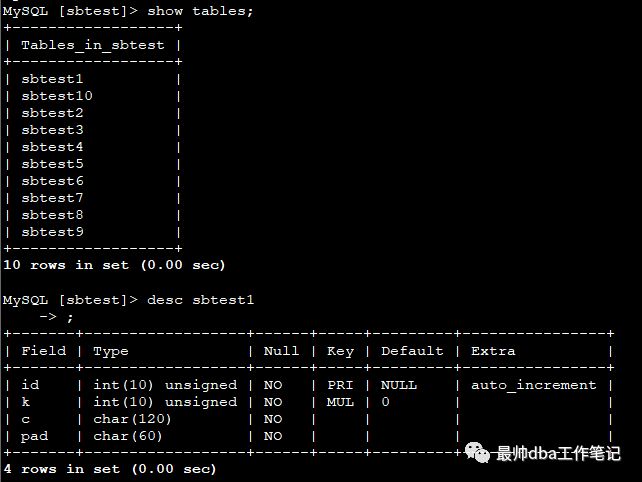
这些就是我们生成的测试表。
之后我们收集测试报告
sysbench usr/local/share/sysbench/tests/include/oltp_legacy/oltp.lua --mysql-host=localhost --mysql-port=3306 --mysql-user=root --mysql-password=oracle --oltp-tet-mode=complex --oltp-tables-count=10 --oltp-table-size=100000 --threads=10 --time=120 --report-interval=10 --mysql-socket=/var/lib/mysql/mysql.sock run>>sysbench.log

我们会得到一份报告:
vi sysbench.log
sysbench 1.0.15 (using bundled LuaJIT 2.1.0-beta2)
Running the test with following options:
Number of threads: 10
Report intermediate results every 10 second(s)
Initializing random number generator from current time
Initializing worker threads...
Threads started!
[ 10s ] thds: 10 tps: 253.62 qps: 5085.09 (r/w/o: 3561.15/1015.70/508.25) lat (ms,95%): 53.85 err/s: 0.00 reconn/s: 0.00
[ 20s ] thds: 10 tps: 260.71 qps: 5217.18 (r/w/o: 3652.50/1043.16/521.53) lat (ms,95%): 50.11 err/s: 0.10 reconn/s: 0.00
[ 30s ] thds: 10 tps: 280.32 qps: 5603.52 (r/w/o: 3922.53/1120.36/560.63) lat (ms,95%): 44.17 err/s: 0.00 reconn/s: 0.00
[ 40s ] thds: 10 tps: 280.40 qps: 5610.43 (r/w/o: 3927.75/1121.89/560.79) lat (ms,95%): 43.39 err/s: 0.00 reconn/s: 0.00
[ 50s ] thds: 10 tps: 275.29 qps: 5505.36 (r/w/o: 3852.83/1101.95/550.58) lat (ms,95%): 44.17 err/s: 0.00 reconn/s: 0.00
[ 60s ] thds: 10 tps: 261.51 qps: 5230.96 (r/w/o: 3662.41/1045.53/523.02) lat (ms,95%): 50.11 err/s: 0.00 reconn/s: 0.00
[ 70s ] thds: 10 tps: 232.67 qps: 4650.35 (r/w/o: 3255.12/929.89/465.35) lat (ms,95%): 81.48 err/s: 0.00 reconn/s: 0.00
[ 80s ] thds: 10 tps: 249.24 qps: 4989.72 (r/w/o: 3493.20/998.04/498.47) lat (ms,95%): 66.84 err/s: 0.00 reconn/s: 0.00
[ 90s ] thds: 10 tps: 258.09 qps: 5158.33 (r/w/o: 3610.41/1031.85/516.07) lat (ms,95%): 53.85 err/s: 0.00 reconn/s: 0.00
[ 100s ] thds: 10 tps: 261.01 qps: 5220.97 (r/w/o: 3654.52/1044.33/522.12) lat (ms,95%): 53.85 err/s: 0.00 reconn/s: 0.00
[ 110s ] thds: 10 tps: 282.10 qps: 5643.37 (r/w/o: 3950.08/1129.09/564.20) lat (ms,95%): 42.61 err/s: 0.00 reconn/s: 0.00
[ 120s ] thds: 10 tps: 281.79 qps: 5637.00 (r/w/o: 3946.99/1126.34/563.67) lat (ms,95%): 43.39 err/s: 0.10 reconn/s: 0.00
SQL statistics:
queries performed:
read: 444920
write: 127114
other: 63558
total: 635592
transactions: 31778 (264.76 per sec.)
queries: 635592 (5295.54 per sec.)
ignored errors: 2 (0.02 per sec.)
reconnects: 0 (0.00 per sec.)
General statistics:
total time: 120.0225s
total number of events: 31778
Latency (ms):
min: 3.58
avg: 37.76
max: 318.22
95th percentile: 49.21
sum: 1200035.49
Threads fairness:
events (avg/stddev): 3177.8000/12.71
execution time (avg/stddev): 120.0035/0.01
在上面我们可以看到每10s的响应情况
我们主要看的值SQLstatistics:
querties performed : 查询执行的次数。
transactions: 事务数。后面括号的是tps 每秒事务的数量
quries:查询次数。后面括号的是qps 每秒查询的数量
95th percentile:超过95%的相应的时间。
THAT'S ALL
BY CUI PEACE!!!!
本文分享自微信公众号 - 最帅dba工作笔记,如有侵权,请联系 service001@enmotech.com 删除。
