


xhprof是facebook团队开发的用于研究php性能的扩展,并且提供了图形化的界面展示性能参数和过程。对于各种php的项目的性能瓶颈研究有一定帮助,值得一用。
我在上一篇《Dockerfile搭建极简LNMP环境》一文中已经创建好了LNMP环境,下面是基于这个容器进行xhprof的安装和使用。
1.安装xhprof
编写如下install_xhprof.sh脚本,分为编译安装、设置扩展、部署前端模块文件三大步骤。
# get the source codeswget https://pecl.php.net/get/xhprof-2.2.3.tgztar xvf xhprof-2.2.3.tgz#mv xhprof-2.2.3 xhprofcd xhprof/extensionphpize./configure --enable-xhprofmake && make install# enable xhprof in php modulesecho "extension=xhprof.so" > etc/php/7.4/cli/conf.d/20-xhprof.iniecho "xhprof.output_dir=/tmp" >> etc/php/7.4/cli/conf.d/20-xhprof.ini# enable xhprof in php-fpm modulescp etc/php/7.4/cli/conf.d/20-xhprof.ini etc/php/7.4/fpm/conf.d/xhprof.ini# restart php-fpm serviceservice php7.4-fpm restart# move fronted-codes to nginx's pathmkdir -p var/www/xhprofcp -r installsofts/xhprof/xhprof_html var/www/xhprof/cp -r installsofts/xhprof/xhprof_lib var/www/xhprof/
2.添加虚拟主机到Nginx配置 然后在/etc/nginx/site-enabled目录下创建一个名为xhprof.conf的配置文件,其内容如下:
server{listen 80;server_name xhprof.alice.show;location {root var/www/xhprof;index index.html index.php;}location ~ \.php$ {root var/www/xhprof;include snippets/fastcgi-php.conf;fastcgi_pass unix:/run/php/php7.4-fpm.sock;}}
3.编写测试代码 万事俱备只欠东风,下面编写一个测试代码来调用到xhprof:
<?phpinclude_once "./xhprof_lib/utils/xhprof_lib.php";include_once "./xhprof_lib/utils/xhprof_runs.php";function test($max){for ($idx = 0; $idx < $max; $idx++) {echo '2333' . "\r\n";}}function a(){test(rand(1000,2000));}// 开启xhprofxhprof_enable();a();// 收集profilling数据$xhprof_data = xhprof_disable();$xhprof_runs = new XHProfRuns_Default();$run_id = $xhprof_runs->save_run($xhprof_data, "xhprof_foo");echo "\nhttp://xhprof.alice.show/xhprof_html/index.php?run=$run_id&source=xhprof_foo\n";
在浏览器中访问http://xhprof.alice.show/test2.php,就可以看到页面最后打印出了类似输出:http://xhprof.alice.show/xhprof_html/index.php?run=602c9cfb679ee&source=xhprof_foo
然后访问这个链接就可以看到性能报告列表了,其中重点关注Calls(调用次数)以及Excl.Wall Time(执行时间)两列。如下图图1所示,可以看到每个方法被调用的情况。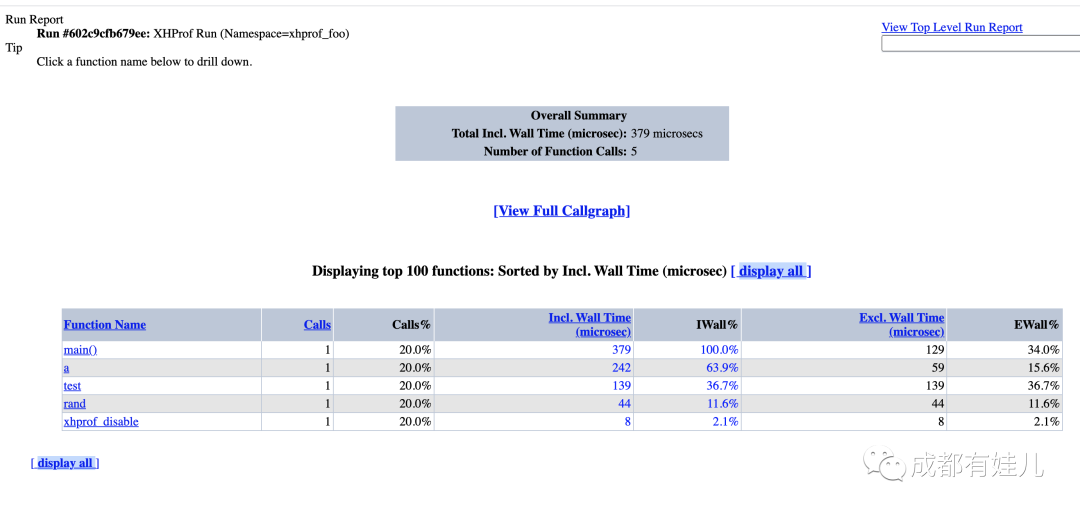 此外还提供了调用图,更加直观,如图2所示,红色部分表示耗时很大的环节,也是性能优化需要重点关注的地方。
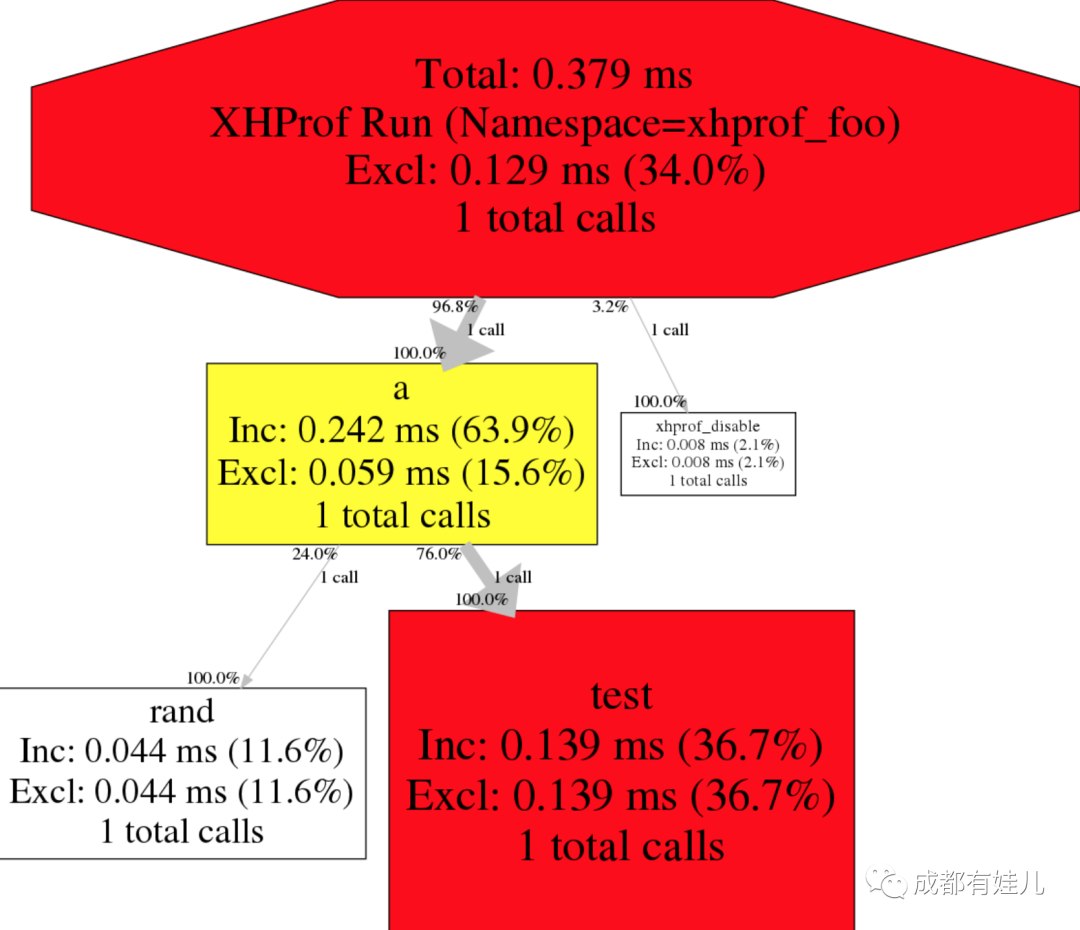
感谢Facebook团队开源出这么好用的性能分析工具,php性能之路还将继续!
本文首发自我技术博客,同步于知乎和公众号,欢迎关注!
文章转载自成都有娃儿,如果涉嫌侵权,请发送邮件至:contact@modb.pro进行举报,并提供相关证据,一经查实,墨天轮将立刻删除相关内容。
