


中国部分地图轮廓绘制代码如下:
<!DOCTYPE html><html lang="en"><head><meta charset="UTF-8"><title>D3地图</title></head><body><script src="http://d3js.org/d3.v3.min.js"></script><!--d3.js是js的一个库,不需要安装,可直接下载文件或在有网络的情况下直接引用--><!--给所有的province设置一个边界--><style>.province{stroke:black;stroke-width:1px;}.southchinasea{stroke:black;stroke-width:1px;fill:red;}</style><script>/*屏幕分辨率*/var w = window.innerWidth|| document.documentElement.clientWidth|| document.body.clientWidth;var h = window.innerHeight|| document.documentElement.clientHeight|| document.body.clientHeight;w=w*0.98;h=h*0.9;/*创建svg元素*/var svg=d3.select("body").append("svg").attr("width",w).attr("height",h);var projection=d3.geo.mercator()/*创建投影,svg.geo.mercator()是D3的mercator()投影算法*/.center([116,40])/*地图正中心的经纬度*/.scale(600)/*比例尺*/.translate([w/2,h/2]);/*地图在屏幕正中心的位置*/var path=d3.geo.path()/*创建path对象*/.projection(projection);/*投影算法*/d3.json("china.geo.json",function(error,geo){/*如果出错,返回error,没有出错则返回geo对象*/console.log(geo);var province=svg.selectAll(".province").data(geo.features).enter().append("path").attr("class","province").style("fill","red").attr("d",path);});d3.xml("southchinasea",function(error,xmlDocument){console.log(xmlDocument);svg.html(function(d){return d3.select(this).html()+xmlDocument.getElementsByTagName("g")[0].outerHTML;});d3.select("#xouthchinasea").attr("transform","translate(1000,600) scale(0.5)").attr("class","southchinasea");})</script></body></html>
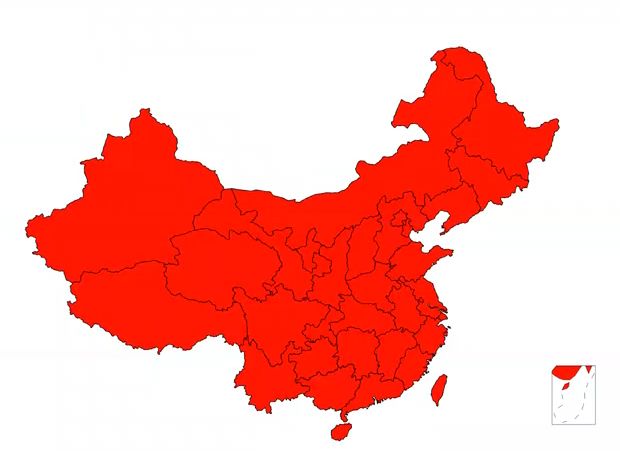
结果:
GeoJSON数据:它是用于描述地理空间信息的数据格式
FeatureCollection:特征集合
type:GeoJSON对象都有type属性,type的值有多种
Feature:是type的值之一,Feature特征对象必须包含变量geometry,properties
geometry:几何体
properties:值可以是任意JSON对象或null
Polygon:面
所以china.geo.json文件里,有一个对象,该对象的type值为特征集合FeatureCollection,其成员Feature的每一项描述一个省的地理信息,特征对象properties里面包含该省的名称,id号。geometry包含该省的地理信息。
地图制作
在一个矩形区域中,划伤中国大陆和港澳台,再在矩形的右下角添加一个小框,里面绘制南海诸岛。南海岛屿需要单独制作。
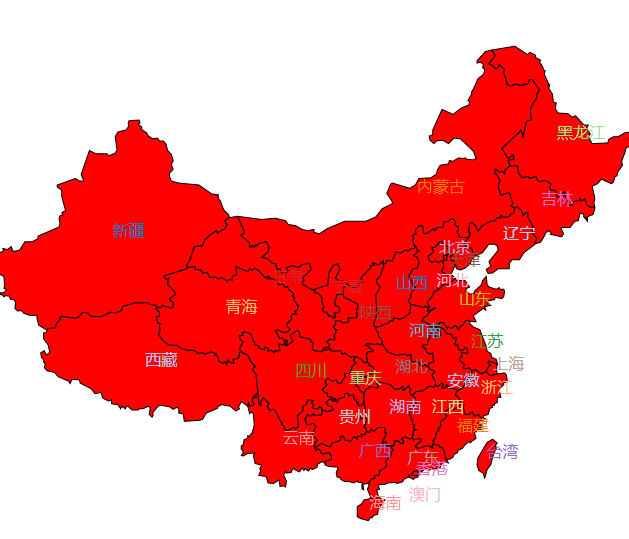
给各个省份加上文字:
<!DOCTYPE html><html lang="en"><head><meta charset="UTF-8"><title>chinamap</title></head><body><script src="http://d3js.org/d3.v3.min.js"></script><!--d3.js是js的一个库,不需要安装,可直接下载文件或在有网络的情况下直接引用--><!--给所有的province设置一个边界--><style>.province{stroke:black;stroke-width:1px;}.southchinasea{stroke:black;stroke-width:1px;fill:red;}</style><script>/*屏幕分辨率*/var w = window.innerWidth|| document.documentElement.clientWidth|| document.body.clientWidth;var h = window.innerHeight|| document.documentElement.clientHeight|| document.body.clientHeight;w=w*0.98;h=h*0.9;/*创建svg元素*/var svg=d3.select("body").append("svg").attr("width",w).attr("height",h);var color=d3.scale.category20();var projection=d3.geo.mercator()/*创建投影,svg.geo.mercator()是D3的mercator()投影算法*/.center([116,40])/*地图正中心的经纬度*/.scale(600)/*比例尺*/.translate([w/2,h/2]);/*地图在屏幕正中心的位置*/var path=d3.geo.path()/*创建path对象*/.projection(projection);/*投影算法*/d3.json("china.geo.json",function(error,geo){/*如果出错,返回error,没有出错则返回geo对象*/console.log(geo);var province=svg.selectAll(".province").data(geo.features).enter().append("path").attr("class","province").attr("fill",function(d,i){return color1(gdp[i]);}).attr("d",path).on("mouseover",function(d,i){d3.select(this).attr("fill","yellow");}).on("mouseout",function(d,i){d3.select(this).attr("fill",function(){return color1(gdp[i]);});});/*给每个省份添加文字*/var label=svg.selectAll(".label").data(geo.features)/*绑定数据*/.enter().append("text")/*创建text标签*/.attr("class","label").text(function(d,i){return d.properties.name+gdp[i];}).attr("font-size",16).attr("transform",function(d,i){var center=path.centroid(d);/*path.centroid(d),获得几何中心*/var x=center[0],y=center[1];if((d.properties.name=="河北")||(d.properties.name=="澳门")||(d.properties.name=="安徽")){y=y+25;}return "translate("+x+","+y+")";});});d3.xml("southchinasea",function(error,xmlDocument){console.log(xmlDocument);svg.html(function(d){return d3.select(this).html()+xmlDocument.getElementsByTagName("g")[0].outerHTML;});d3.select("#xouthchinasea").attr("transform","translate(1000,600) scale(0.5)").attr("class","southchinasea");})</script></body></html>
结果:(南海部分未显示,因为数据出错了)省份名字的颜色使用匿名函数随机产生
然后给每个省份添加GDP,代码如下:
<!DOCTYPE html><html lang="en"><head><meta charset="UTF-8"><title>chinamap_gdp</title></head><body><script src="http://d3js.org/d3.v3.min.js"></script><!--d3.js是js的一个库,不需要安装,可直接下载文件或在有网络的情况下直接引用--><!--给所有的province设置一个边界--><style>.province{stroke:black;stroke-width:1px;}.southchinasea{stroke:black;stroke-width:1px;fill:red;}</style><script>/*屏幕分辨率*/var w = window.innerWidth|| document.documentElement.clientWidth|| document.body.clientWidth;var h = window.innerHeight|| document.documentElement.clientHeight|| document.body.clientHeight;w=w*0.98;h=h*0.9;var gdp = [6790.32,2417.05,16803.12,10502.56,15717.27,23014.59,25979.82,22005.63,72812.55,1026.39,9324.80,3702.76,2911.77,18021.86,12766.49,29550.19,28902.21,30053.10,13619.17,29806.11,37002.16,28669.02,63002.33,16538.19,16723.78,70116.38,25123.45,42886.49,14063.13,17831.51,15083.67,1000,1000,1000];/*创建svg元素*/var svg=d3.select("body").append("svg").attr("width",w).attr("height",h);var color=d3.scale.category20();var color1=d3.scale.linear()/*线性渐变*/.domain([0,d3.max(gdp)])/*设置范围,最小为0,最大为某个gdp*/.range(["#FF0000","#550055"]);/*创建线性映射*/var projection=d3.geo.mercator()/*创建投影,svg.geo.mercator()是D3的mercator()投影算法*/.center([116,40])/*地图正中心的经纬度*/.scale(600)/*比例尺*/.translate([w/2,h/2]);/*地图在屏幕正中心的位置*/var path=d3.geo.path()/*创建path对象*/.projection(projection);/*投影算法*/d3.json("china.geo.json",function(error,geo){/*如果出错,返回error,没有出错则返回geo对象*/console.log(geo);var province=svg.selectAll(".province").data(geo.features).enter().append("path").attr("class","province").attr("fill",function(d,i){return color1(gdp[i]);}).attr("d",path).on("mouseover",function(d,i){d3.select(this).attr("fill","yellow");}).on("mouseout",function(d,i){d3.select(this).attr("fill",function(){return color1(gdp[i]);});});/*给每个省份添加文字*/var label=svg.selectAll(".label").data(geo.features)/*绑定数据*/.enter().append("text")/*创建text标签*/.attr("class","label").text(function(d,i){return d.properties.name+gdp[i];}).attr("font-size",16).attr("fill",function(d,i){return color(i);}).attr("transform",function(d,i){var center=path.centroid(d);/*path.centroid(d),获得几何中心*/var x=center[0],y=center[1];if((d.properties.name=="河北")||(d.properties.name=="澳门")||(d.properties.name=="安徽")){y=y+25;}return "translate("+x+","+y+")";});});d3.xml("southchinasea",function(error,xmlDocument){console.log(xmlDocument);svg.html(function(d){return d3.select(this).html()+xmlDocument.getElementsByTagName("g")[0].outerHTML;});d3.select("#xouthchinasea").attr("transform","translate(1000,600) scale(0.5)").attr("class","southchinasea");})</script></body></html>
结果:(南海部分未显示,因为数据出错,不晓得怎么贴图,但是中国地图包含南海)
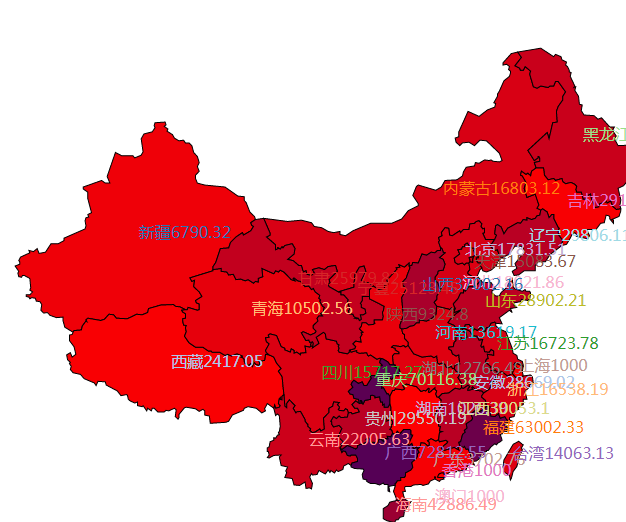
效果:
每个省份地图颜色随GDP增加而加深,并且当鼠标扫过某一个省份的轮廓是,该省份颜色会发生改变,当鼠标离开之后又恢复到原来的颜色
china.geo.json文件提取码:
链接:https://pan.baidu.com/s/1PWk-FKOpGr10B0TIdAxFWg 提取码:t35p
文章转载自糟老头修炼记,如果涉嫌侵权,请发送邮件至:contact@modb.pro进行举报,并提供相关证据,一经查实,墨天轮将立刻删除相关内容。
