


这是在 OpenTracing 和分布式追踪领域内广受欢迎的一片博客文章。在构建监控系统时,大家往往在这几个名词和方式之间纠结。 通过这篇文章,作者很好的阐述了分布式追踪、统计指标与日志之间的区别和关系。
今天,我很荣幸的参加了 2017 分布式追踪峰会(2017 Distributed Tracing Summit), 并和来自 AWS/X-Ray, OpenZipkin, penTracing, Instana, Datadog, Librato,以及其他更多组织的同仁进行了愉快的沟通和讨论。 其中一个重要的论点,是针对监控项目的范围和定义的。作为一个分布式追踪系统,应该管理日志么?从不同角度看来,到底什么是日志?如何通过一张图形象的定位这些形形色色的系统?
总体说来,我觉得我们是在一些通用的名词间纠结。我想我们可以通过图表来定义监控的作用域,使各名词的作用范围更明确。 我们使用维恩图(Venn diagram)来描述 Metrics, Tracing, Logging 三个概念的定义。他们三者在某些情况下是重叠的,但是我尽量尝试定义他们的不同。如下图所示:
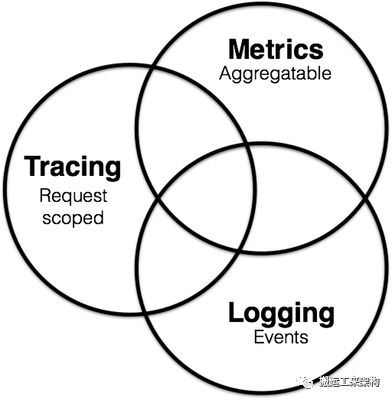
Metrics 的特点是,它是可累加的:他们具有原子性,每个都是一个逻辑计量单元,或者一个时间段内的柱状图。 例如:队列的当前深度可以被定义为一个计量单元,在写入或读取时被更新统计; 输入 HTTP 请求的数量可以被定义为一个计数器,用于简单累加; 请求的执行时间可以被定义为一个柱状图,在指定时间片上更新和统计汇总。
Logging 的特点是,它描述一些离散的(不连续的)事件。 例如:应用通过一个滚动的文件输出 Debug 或 Error 信息,并通过日志收集系统,存储到 Elasticsearch 中; 审批明细信息通过 Kafka,存储到数据库(BigTable)中; 又或者,特定请求的元数据信息,从服务请求中剥离出来,发送给一个异常收集服务,如 NewRelic。
Tracing 的最大特点就是,它在单次请求的范围内,处理信息。 任何的数据、元数据信息都被绑定到系统中的单个事务上。 例如:一次调用远程服务的 RPC 执行过程;一次实际的 SQL 查询语句;一次 HTTP 请求的业务性 ID。
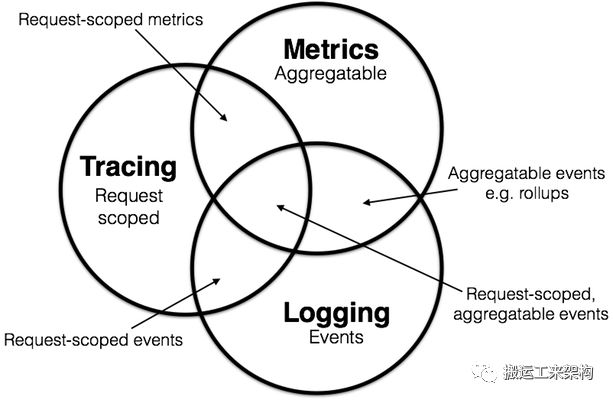
根据上述的定义,我们可以标记上图的重叠部分。
当然,大量的被监控的应用是具有分布式能力(Cloud-native)的应用,逻辑处理在单次请求的范围内完成。因此,讨论追踪的上下文是有意义的。 但是,我们注意到,并不是所有的监控系统都绑定在请求的生命周期上的。他们可能是逻辑组件诊断信息、处理过程的生命周期明细信息,这些信息和任何离散的请求时正交关系。 所以,不是所有的 Metrics 和 Log 都可以被塞进追踪系统的概念中,至少在不经过数据加工处理是不行的。又或者,我们可能发觉使用 Metrics 统计数据,对应用监控有很大帮助,例如 Prometheus 生态,可以量化的实时展现应用视图;相应的,如果我们将 Metrics 统计数据强行使用针对 Log 的管道来处理,将使我们丢失很多特性。
那么,在这里,我们可以开始对已知的系统进行分类。如:Prometheus, 专一的 Metrics 统计系统,随着时间推移,也许会进化为追踪系统,进而进行请求内的指标统计,但不太可能深入到 Log 处理领域。ELK 生态提供 Log 的记录,滚动和聚合,并在其他领域不停的积累更多的特性,并集成进来。
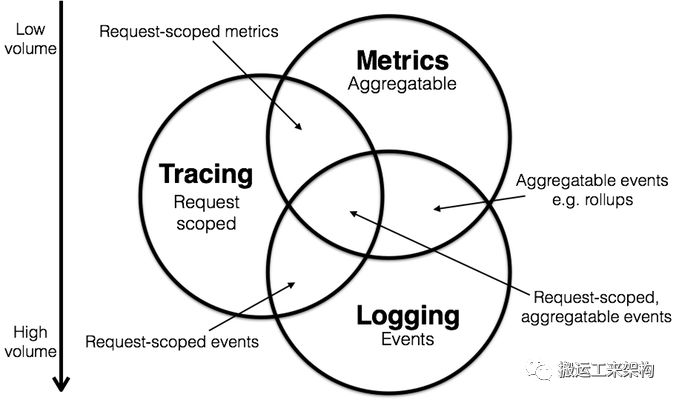
另外,我发现通过维恩图的方式展现三者关系时,会正巧展现出一个附加效应。在这三个功能域中,Metrics 倾向于更节省资源,因为他会“天然的”压缩数据。相反,日志倾向于无限增加的,会频繁的超出预期的容量。所以,我们可以在图上,绘制出容量的需求趋势,Metrics 低到 Logging 高, 而 Trace 可能处于他们两的中间位置。
也许,这不是最完美的方式描述这三者的管理,但我从会议现场收到的反馈来看,这个分类还是相当不错的:随着三者的关系越清晰,我们越容易建设性的讨论其他问题。如果你尝试对产品的功能进行定位,你可能也需要这张图,在讨论中,澄清产品的位置。
Peter Bourgon Home About Talks Articles Blog
Metrics, tracing, and logging
2017 02 21
Today I had the good fortune of attending the 2017 Distributed Tracing Summit, with lots of rad folks from orgs like AWS/X-Ray, OpenZipkin, OpenTracing, Instana, Datadog, Librato, and many others I regret that I’m forgetting. At one point the discussion took a turn toward project scope and definitions. Should a tracing system also manage logging? What indeed is logging, when viewed through the different lenses represented in the room? And where do all of the various concrete systems fit in to the picture?
In short, I felt that we were stumbling a little bit around a shared vocabulary. I thought we could probably map out the domain of instrumentation, or observability, as a sort of Venn diagram. Metrics, tracing, and logging are definitely all parts of a broader picture, and can definitely overlap in some circumstances, but I wanted to try and identify the properties of each that were truly distinct. I had a think over a coffee break and came up with this.
I think that the defining characteristic of metrics is that they are aggregatable: they are the atoms that compose into a single logical gauge, counter, or histogram over a span of time. As examples: the current depth of a queue could be modeled as a gauge, whose updates aggregate with last-writer-win semantics; the number of incoming HTTP requests could be modeled as a counter, whose updates aggregate by simple addition; and the observed duration of a request could be modeled into a histogram, whose updates aggregate into time-buckets and yield statistical summaries.
I think that the defining characteristic of logging is that it deals with discrete events. As examples: application debug or error messages emitted via a rotated file descriptor through syslog to Elasticsearch (or OK Log, nudge nudge); audit-trail events pushed through Kafka to a data lake like BigTable; or request-specific metadata pulled from a service call and sent to an error tracking service like NewRelic.
I think that the single defining characteristic of tracing, then, is that it deals with information that is request-scoped. Any bit of data or metadata that can be bound to lifecycle of a single transactional object in the system. As examples: the duration of an outbound RPC to a remote service; the text of an actual SQL query sent to a database; or the correlation ID of an inbound HTTP request.
With these definitions we can label the overlapping sections.
Certainly a lot of the instrumentation typical to cloud-native applications will end up being request-scoped, and thus may make sense to talk about in a broader context of tracing. But we can now observe that not all instrumentation is bound to request lifecycles: there will be e.g. logical component diagnostic information, or process lifecycle details, that are orthogonal to any discrete request. So not all metrics or logs, for example, can be shoehorned into a tracing system—at least, not without some work. Or, we might realize that instrumenting metrics directly in our application gives us powerful benefits, like a flexible expression language that evaluates on a real-time view of our fleet; in contrast, shoehorning metrics into a logging pipeline may force us to abandon some of those advantages.
From here we can begin to categorize existing systems. Prometheus, for example, started off exclusively as a metrics system, and over time may grow towards tracing and thus into request-scoped metrics, but likely will not move too deeply into the logging space. ELK offers logging and roll-ups, placing it firmly the aggregatable events space, but seems to continuously accrue more features in the other domains, pushing it toward the center.
Further, I observed a curious operational detail as a side-effect of this visualization. Of the three domains, metrics tend to require the fewest resources to manage, as by their nature they “compress” pretty well. Conversely, logging tends to be overwhelming, frequently coming to surpass in volume the production traffic it reports on. (I wrote a bit more on this topic previously.) So we can draw a sort of volume or operational overhead gradient, from metrics (low) to logging (high)—and we observe that tracing probably sits somewhere in the middle.
Maybe it’s not a perfect description of the space, but my sense from the Summit attendees was that this categorization made sense: we were able to speak more productively when it was clear what we were talking about. Maybe this diagram can be useful to you, too, if you’re trying to get a handle on the product space, or clarify conversations in your own organizations.

搬运工来架构
挨踢人聚集地,一个分享干货的公众号
作者:Peter Bourgon
原作: Metrics, tracing, and logging
译者:吴晟
来源:http://blog.oneapm.com/apm-tech/811.html
你可能喜欢
