$more $ORA_CRS_HOME/log/htqddb1 alerthtqddb1.log
2013-09-08 03:04:15.795
[cssd(893176)]CRS-1601:CSSD Reconfiguration complete. Active nodes are htqddb1 htqddb2 .
2013-09-18 05:01:01.354
[cssd(893176)]CRS-1612:node htqddb2 (0) at 50% heartbeat fatal, eviction in 0.000 seconds
2013-09-18 05:01:08.353
[cssd(893176)]CRS-1611:node htqddb2 (0) at 75% heartbeat fatal, eviction in 0.000 seconds
2013-09-18 05:01:09.355
[cssd(893176)]CRS-1611:node htqddb2 (0) at 75% heartbeat fatal, eviction in 0.000 seconds
2013-09-18 05:01:13.355
[cssd(893176)]CRS-1610:node htqddb2 (0) at 90% heartbeat fatal, eviction in 0.000 seconds
2013-09-18 05:01:14.355
[cssd(893176)]CRS-1610:node htqddb2 (0) at 90% heartbeat fatal, eviction in 0.000 seconds
2013-09-18 05:01:15.355
[cssd(893176)]CRS-1610:node htqddb2 (0) at 90% heartbeat fatal, eviction in 0.000 seconds
2013-09-18 05:01:15.466
[cssd(893176)]CRS-1607:CSSD evicting node htqddb2. Details in oracle/app/oracle/product/10.2.0/crs/log/htqddb1/cssd/ocssd.log.
2013-09-18 05:01:58.759
[cssd(893176)]CRS-1601:CSSD Reconfiguration complete. Active nodes are htqddb1 .
05:01:01,节点1报出了与节点2私网通讯心跳丢失达到50%的错误。由于网络心跳设置为30秒,因此50%心跳丢失就意味这从5点0分46秒开始出现的私网通讯心跳丢失的情况。
05:01:15,由于已经超过了阀值30秒,仍然无法与节点2 htqddb2私网通讯。因此开始将节点2剔除节点。”[cssd(893176)]CRS-1607:CSSD evicting node htqddb2.”
05:01:58,剔除节点2动作完成。
物理上通讯异常
系统负载大,未及时响应
$ more $ORA_CRS_HOME/log/htqddb2 alerthtqddb2.log
2013-09-11 05:13:00.093
[cssd(729256)]CRS-1612:node htqddb1 (0) at 50% heartbeat fatal, eviction in 0.000 seconds
2013-09-11 05:13:01.093
[cssd(729256)]CRS-1612:node htqddb1 (0) at 50% heartbeat fatal, eviction in 0.000 seconds
2013-09-17 05:12:52.958
[cssd(729256)]CRS-1612:node htqddb1 (0) at 50% heartbeat fatal, eviction in 0.000 seconds
故障日即9月18日,节点2未报出到节点1有任何心跳丢失的日志,但节点1报出了与节点2私网心跳丢失的情况,因此可排除网络问题。
但是在故障前些天,即9月11日和9月17日都分别报出了节点2到节点1心跳丢失50%的情况,即私网心跳丢失了15秒。只不过这两天里,没有达到30秒的阀值就自动恢复了正常(缓过来了),因此这两天并未出现自动重启的故障。
9月11日和9月17日里节点2报到节点1心跳丢失,但节点1并未报到节点2心跳丢失
总结节点1和节点2私网心跳丢失的时间,不难发现都是在5点左右出现的。
如果是因为物理通讯异常导致私网心跳丢失,则应该会同时出现节点1和节点2互报私网心跳丢失的情况,但这里都是单边报;另外,网络团队反馈的结果表明,问题时段网络设备并无报错,因此可排除网络物理通讯异常导致的心跳丢失.
结合心跳丢失都是5点后出现,并且9月11日和17日只丢失15秒,9月18日丢失30秒的现象,这是典型的系统性能引起的RAC驱逐节点的现象。
zzz ***Sat Sep 21 05:00:15 BEIST 2013

System configuration: lcpu=40 mem=40960MB ent=4.00

kthr    memory              page              faults              cpu
----- ----------- ------------------------ ------------ -----------------------
 r  b   avm   fre  re  pi  po  fr   sr  cy  in   sy  cs us sy id wa    pc    ec
 0  0 4814018 3836691   0   0   0   0    0   0 2251 99048 5978 16  6 78  0  1.13  28.4
 0  0 4817203 3833502   0   0   0   0    0   0 2443 94806 5727  7  6 86  1  0.70  17.5
 0  0 4816936 3833765   0   0   0   0    0   0 1910 7800 5176  2  1 97  0  0.22   5.4
zzz ***Sat Sep 21 05:00:35 BEIST 2013

System configuration: lcpu=40 mem=40960MB ent=4.00

kthr    memory              page              faults              cpu
----- ----------- ------------------------ ------------ -----------------------
 r  b   avm   fre  re  pi  po  fr   sr  cy  in   sy  cs us sy id wa    pc    ec
 8  0 5067754 3582919   0   0   0   0    0   0 8537 619861 68144 64 20 16  0  9.18 229.4
11  0 5069093 3581575   0   0   0   0    0   0 8743 595708 77641 61 23 16  0  8.18 204.4
28  0 5069058 3581606   0   0   0   0    0   0 5260 552537 74567 61 25 14  0  8.45 211.2
zzz ***Sat Sep 21 05:00:56 BEIST 2013

System configuration: lcpu=40 mem=40960MB ent=4.00

kthr    memory              page              faults              cpu
----- ----------- ------------------------ ------------ -----------------------
 r  b   avm   fre  re  pi  po  fr   sr  cy  in   sy  cs us sy id wa    pc    ec
147  0 5189807 3463609   0   0   0   0    0   0 2799 250920 27571 46 45  9  0  4.53 113.2
 9  0 5189663 3463748   0   0   0   0    0   0 3779 318104 35207 41 35 24  0  3.58  89.5
91  0 5189699 3463709   0   0   0   0    0   0 4095 332027 43252 52 36 11  0  5.51 137.7
zzz ***Sat Sep 21 05:01:16 BEIST 2013

System configuration: lcpu=40 mem=40960MB ent=4.00

kthr    memory              page              faults              cpu
----- ----------- ------------------------ ------------ -----------------------
 r  b   avm   fre  re  pi  po  fr   sr  cy  in   sy  cs us sy id wa    pc    ec
 1  0 5210180 3443154   0   0   0   0    0   0 3982 169561 11832 16  8 76  1  1.26  31.6
 0  0 5210143 3443187   0   0   0   0    0   0 6031 155362 14912 19  9 70  1  1.55  38.8
 0  0 5230440 3422886   0   0   0   0    0   0 5684 103012 15531 23  7 70  0  1.56  39.1
zzz ***Sat Sep 21 05:01:36 BEIST 2013

System configuration: lcpu=40 mem=40960MB ent=4.00

kthr    memory              page              faults              cpu
----- ----------- ------------------------ ------------ -----------------------
 r  b   avm   fre  re  pi  po  fr   sr  cy  in   sy  cs us sy id wa    pc    ec
 2  0 5292268 3361024   0   0   0   0    0   0 5544 257968 15507 26 11 63  0  1.93  48.4
 1  0 5292236 3361051   0   0   0   0    0   0 5195 92837 13430 17  6 77  1  1.25  31.2
 1  0 5292065 3361218   0   0   0   0    0   0 5592 97063 14588 18  6 75  1  1.33  33.3
zzz ***Sat Sep 21 05:01:56 BEIST 2013
问题时段前后的活动进程趋势分析
SQL> select to_char(sample_time, 'yyyymmdd hh24:mi:ss') as sample_time,
  2         instance_number as inst,
  3         count(*) as sess_cnt
  4    from dba_hist_active_sess_history
  5   where to_char(sample_time, 'yyyymmdd hh24mi') >= '20130918 0450'
  6     and to_char(sample_time, 'yyyymmdd hh24mi') <= '20130918 0501'
  7   group by instance_number, to_char(sample_time, 'yyyymmdd hh24:mi:ss')
  8   order by 1, 2;

SAMPLE_TIME                    INST   SESS_CNT
------------------------ ---------- ----------
……
20130918 04:56:42                 2          1
20130918 04:57:03                 1          1
20130918 04:58:02                 2          1
20130918 04:58:24                 1          1
20130918 04:59:12                 2          1
20130918 05:00:04                 1          2
20130918 05:00:14                 1          1
20130918 05:00:24                 1          1
20130918 05:00:34                 1          2
20130918 05:00:44                 1        133
20130918 05:00:55                 1        106
20130918 05:01:05                 1         44
20130918 05:01:15                 1          1
20130918 05:01:25                 1          8
20130918 05:01:35                 1         12
20130918 05:01:45                 1         14
20130918 05:01:55                 1         19

SQL>  select to_char(sample_time, 'yyyymmdd hh24:mi:ss') as sample_time,
  2          sql_id,
  3          count(*) as sess_cnt
  4     from dba_hist_active_sess_history
  5    where to_char(sample_time, 'yyyymmdd hh24mi') >= '20130918 0500'
  6      and to_char(sample_time, 'yyyymmdd hh24mi') <= '20130918 0501'
  7    group by to_char(sample_time, 'yyyymmdd hh24:mi:ss'), sql_id
  8    order by 1, 3;

SAMPLE_TIME              SQL_ID                       SESS_CNT
------------------------ -------------------------- ----------
20130918 05:00:04        9jbv997r1pbkd                       1
20130918 05:00:04                                            1
20130918 05:00:14        9jbv997r1pbkd                       1
20130918 05:00:24        9jbv997r1pbkd                       1
20130918 05:00:34        0k14aj9hsd2px                       1
20130918 05:00:34        9jbv997r1pbkd                       1
20130918 05:00:44        9jbv997r1pbkd                     133
20130918 05:00:55        9jbv997r1pbkd                     106
20130918 05:01:05        9jbv997r1pbkd                      44
20130918 05:01:15        9jbv997r1pbkd                       1
20130918 05:01:25                                            1
20130918 05:01:25        9jbv997r1pbkd                       1
20130918 05:01:25        4gd6b1r53yt88                       1
20130918 05:01:25        b6kufn9vy7mdd                       1
20130918 05:01:25        67vjwqswg2zvy                       4
问题时段SQL语句分布情况
SQL>  select to_char(sample_time, 'yyyymmdd hh24:mi:ss') as sample_time,
  2          sql_id,
  3          count(*) as sess_cnt
  4     from dba_hist_active_sess_history
  5    where to_char(sample_time, 'yyyymmdd hh24mi') >= '20130918 0500'
  6      and to_char(sample_time, 'yyyymmdd hh24mi') <= '20130918 0501'
  7    group by to_char(sample_time, 'yyyymmdd hh24:mi:ss'), sql_id
  8    order by 1, 3;

SAMPLE_TIME              SQL_ID                       SESS_CNT
------------------------ -------------------------- ----------
20130918 05:00:04        9jbv997r1pbkd                       1
20130918 05:00:04                                            1
20130918 05:00:14        9jbv997r1pbkd                       1
20130918 05:00:24        9jbv997r1pbkd                       1
20130918 05:00:34        0k14aj9hsd2px                       1
20130918 05:00:34        9jbv997r1pbkd                       1
20130918 05:00:44        9jbv997r1pbkd                     133
20130918 05:00:55        9jbv997r1pbkd                     106
20130918 05:01:05        9jbv997r1pbkd                      44
20130918 05:01:15        9jbv997r1pbkd                       1
20130918 05:01:25                                                       1
20130918 05:01:25        9jbv997r1pbkd                       1
20130918 05:01:25        4gd6b1r53yt88                       1
20130918 05:01:25        b6kufn9vy7mdd                      1
20130918 05:01:25        67vjwqswg2zvy                       4
具体的SQL语句如下所示
SQL> @sql_by_sql_id
Enter value for sql_id: 9jbv997r1pbkd
old   3:  where sql_id = '&sql_id'
new   3:  where sql_id = '9jbv997r1pbkd'

   INST_ID SQL_TEXT
---------- --------------------------------------------------------------------------------------------------------------------------------
         1 SELECT A.sign_proorg,COUNT(1) FROM T_HTQD_PERSONALCUST A,T_HTQD_
         1 CUSTCHECK B WHERE a.cust_id=b.cust_id AND b.CHANNEL_ID='42' AND
         1 A.sign_proorg in ('00001','00002','00003','00004','00005','00006
         1 ','00007','00008','00009','00010','00011','00012','00013','00014
         1 ','00015','00016','00017','00018','00019','00020','00021','00022
         1 ','00023','00024','00025','00026','00027','00028','00029','00030
         1 ','00031','00032','00033') group by A.sign_proorg order by A.sig
         1 n_proorg
查找发起这个SQL的机器
SQL> col machine for a30
SQL>    select to_char(sample_time, 'yyyymmdd hh24:mi:ss') as sample_time,
  2          machine,
  3          count(*) as sess_cnt
  4     from dba_hist_active_sess_history
  5    where to_char(sample_time, 'yyyymmdd hh24mi') >= '20130918 0500'
  6      and to_char(sample_time, 'yyyymmdd hh24mi') <= '20130918 0501'
  7    group by to_char(sample_time, 'yyyymmdd hh24:mi:ss'), machine
  8    order by 1, 3;

SAMPLE_TIME              MACHINE                          SESS_CNT
------------------------ ------------------------------ ----------
20130918 05:00:04        htqdap1                                 1
20130918 05:00:04        htqddb1                                 1
20130918 05:00:14        htqdap1                                 1
20130918 05:00:24        htqdap1                                 1
20130918 05:00:34        htqdap1                                 1
20130918 05:00:34        localhost                               1
20130918 05:00:44        htqdap1                               133
20130918 05:00:55        htqdap1                               106
20130918 05:01:05        htqdap1                                44
20130918 05:01:15        htqdap1                                 1
20130918 05:01:25        htqdap2                                 1
20130918 05:01:25        hc3htqdbt1                              1
20130918 05:01:25        localhost                               2
该语句的执行计划如下
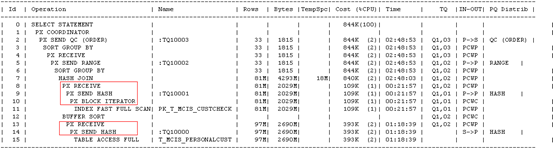
为何出现如此多的活动进程
找到程序发起的源头
[htqdap1:root]:/>su - htqd
[HTQD70:htqd:/htqd]crontab -l
0 8 * * * htqd/log/tt1
0 9 * * * htqd/log/tt1
0 10 * * * htqd/log/tt1
0 11 * * * htqd/log/tt1
0 12 * * * htqd/log/tt1
0 13 * * * htqd/log/tt1
0 14 * * * htqd/log/tt1
0 15 * * * htqd/log/tt1
0 16 * * * htqd/log/tt1
0 17 * * * htqd/log/tt1
0 18 * * * htqd/log/tt1
0 19 * * * htqd/log/tt1
0 20 * * * htqd/log/tt1
0 21 * * * htqd/log/tt1
0 23 * * * htqd/log/tt2
30 05 * * * htqd/log/static1.sh
45 05 * * * htqd/static.sh
00 05 * * * htqd/static2.sh
15 05 * * 6 htqd/static3.sh
0 6 * * * htqd/log/transfer.sh
5 0 * * * htqd/log/td.sh
0 6 * * * htqd/log/rmlog.sh
* * * * * htqd/bin/jk7990.sh
[HTQD70:htqd:/htqd]cat htqd/static2.sh
export NLS_LANG=AMERICAN_AMERICA.ZHS16GBK
. htqd/.profile
userid=htqd
password=htqd
export NLS_LANG=american_america.ZHS16GBK
export NLS_DATE_FORMAT='YYYY-MM-DD'
/oracle/app/oracle/product/10gclient/bin/sqlplus -S $userid/$password@ORAhtqd <<!
spool htqd/log/sign.dat
set heading off
set linesize 78
set pagesize 0
set echo off
set feedback off
set termout off
select '对私客户' from dual;
SELECT A.sign_proorg,COUNT(1) FROM T_HTQD_PERSONALCUST A,T_HTQD_CUSTCHECK B WHERE a.cust_id=b.cust_id AND b.CHANNEL_ID='42' AND A.sign_proorg in ('00001','00002','00003','00004','00005','00006','00007','00008','00009','00010','00011','00012','00013','00014','00015','00016','00017','00018','00019','00020','00021','00022','00023','00024','00025','00026','00027','00028','00029','00030','00031','00032','00033') group by A.sign_proorg order by A.sign_proorg;
select '对私帐户' from dual;
SELECT B.pro_org,COUNT(1)  FROM T_HTQD_PERSONALCUST A,T_HTQD_CUSTACCOUNT B WHERE a.cust_id=b.cust_id AND b.CHANNEL_ID='42' AND B.pro_org in ('00001','00002','00003','00004','00005','00006','00007','00008','00009','00010','00011','00012','00013','00014','00015','00016','00017','00018','00019','00020','00021','00022','00023','00024','00025','00026','00027','00028','00029','00030','00031','00032','00033') group by B.pro_org order by B.pro_org;
select '对公客户' from dual;
SELECT sign_proorg,COUNT(1) FROM  t_htqd_ccust_chl WHERE channel_id= '42' and sign_proorg in ('00001','00002','00003','00004','00005','00006','00007','00008','00009','00010','00011','00012','00013','00014','00015','00016','00017','00018','00019','00020','00021','00022','00023','00024','00025','00026','00027','00028','00029','00030','00031','00032','00033')  group by sign_proorg order by sign_proorg;
select '对公帐户' from dual;
SELECT A.sign_proorg,COUNT(1)  FROM t_htqd_corpcust A,T_HTQD_CcUSTACCOUNT B WHERE a.cust_id=b.cust_id AND b.CHANNEL_ID='42' AND A.sign_proorg in ('00001','00002','00003','00004','00005','00006','00007','00008','00009','00010','00011','00012','00013','00014','00015','00016','00017','00018','00019','00020','00021','00022','00023','00024','00025','00026','00027','00028','00029','00030','00031','00032','00033') group by A.sign_proorg order by A.sign_proorg;

exit;
spool off
!
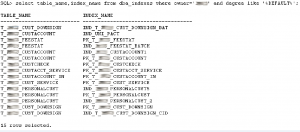
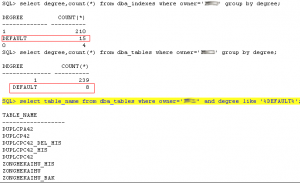
建议应用对2.5章节的表和索引的并行度进行确认,并修改并行度为1.当需要使用并行时,在SQL中使用hint来指定并行度而不是交给ORACLE控制
增加CPU,提高系统应对瞬间高负载的能力。该工作目前已完成。
修改数据库参数parallel_max_servers为40,限制并行的最大进程数。
增加对CRS alert日志的监控,添加监控关键字heartbeat evicting Reconfiguration
原创文章,版权归本文作者所有,如需转载请注明出处
喜欢本文请长按下方的二维码订阅Oracle一体机用户组