


前言
纯属个人实践中相关经验之谈,如有纰漏,还希望大佬们多多提点!
小钟同学 | 文 【原创】| QQ:308711822
linux上 Py-Spy 分析已在运行中的Flask程序实践
安装Py-Spy
pip install py-spy
验证安装:
[root@localhost xingnengfenxi]# py-spy -h
py-spy 0.3.4
Sampling profiler for Python programs

USAGE:
    py-spy <SUBCOMMAND>

OPTIONS:
    -h, --help       Prints help information
    -V, --version    Prints version information

SUBCOMMANDS:
    record    Records stack trace information to a flamegraph, speedscope or raw file
    top       Displays a top like view of functions consuming CPU
    dump      Dumps stack traces for a target program to stdout
    help      Prints this message or the help of the given subcommand(s)
[root@localhost xingnengfenxi]#
上传示例代码到我们的运行目录下:
-flaskmain.py
'''
Author: 小钟同学
objectDescription: 项目描述
Date: 2021-03-07 21:48:40
LastEditors: 308711822@qq.com
LastEditTime: 2021-03-10 09:40:07
FilePath: \py\flaskmain.py
Version: 1.0
'''
from flask import Flask, jsonify
import time


import tracemalloc


app = Flask(__name__)


@app.route('/')
def line_test():

    for item in range(5):
        print(item)
        time.sleep(0.2)

    return jsonify({'code': 200})


if __name__ == '__main__':

    app.run(host='0.0.0.0', port=8888, debug=True)
第1种 、使用分析进程ID的方式,生产火焰图分析
使用分析进程ID的方式,通常分析的是已运行的进程。
[root@localhost xingnengfenxi]# python flaskmain.py
查询我们的python flaskmain.py运行后的对于的PID
[root@localhost xingnengfenxi]# ps -ef|grep flaskmain
root       8255   6320  4 10:16 pts/0    00:00:00 /root/.pyenv/versions/3.7.3/bin/python flaskmain.py
root       8300   8255  4 10:16 pts/0    00:00:00 /root/.pyenv/versions/3.7.3/bin/python /data/www/xingnengfenxi/flaskmain.py
root       8304   6638  0 10:16 pts/1    00:00:00 grep --color=auto flaskmain
[root@localhost xingnengfenxi]#
提取pid:
root 8300 8255 0 10:16 pts/0 00:00:00 /root/.pyenv/versions/3.7.3/bin/python /data/www/xingnengfenxi/flaskmain.py
分析当前进程情况:
[root@localhost xingnengfenxi]# py-spy record -o profile.svg --pid 8300
py-spy> Sampling process 100 times a second. Press Control-C to exit.
使用命令的方式启动分析,提示出现以下的错误信息:使用:
# OR
py-spy record -o profile.svg -- python myprogram.py 方式运行的flask主程序会有下面的错误提示
错误内容:
[root@localhost xingnengfenxi]# py-spy record -output profile.svg -python flaskmain.py
thread 'main' panicked at 'invalid pid: ParseIntError { kind: InvalidDigit }', src/config.rs:262:64
note: run with `RUST_BACKTRACE=1` environment variable to display a backtrace
[root@localhost xingnengfenxi]# py-spy record -output profile.svg -python flaskmain.py
随机的高并发压测我们的线上的API接口
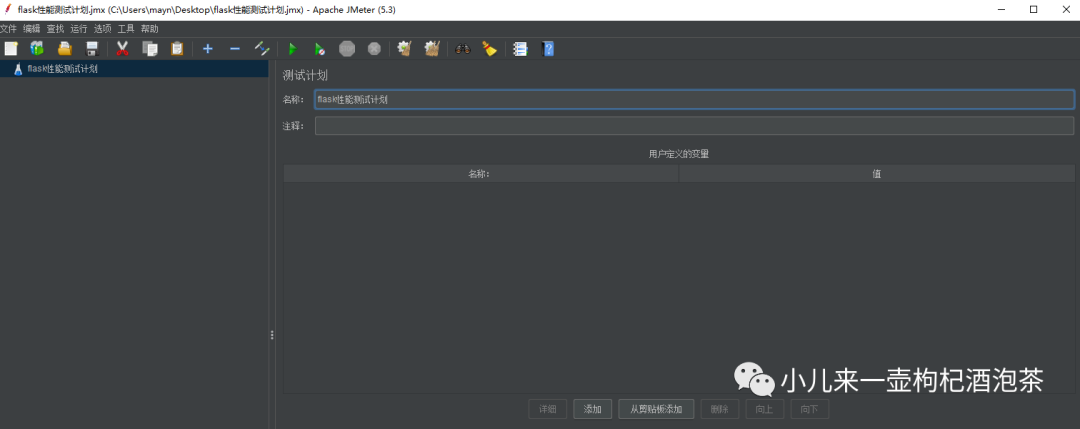
1、新建测试计划,保持此压测的文件
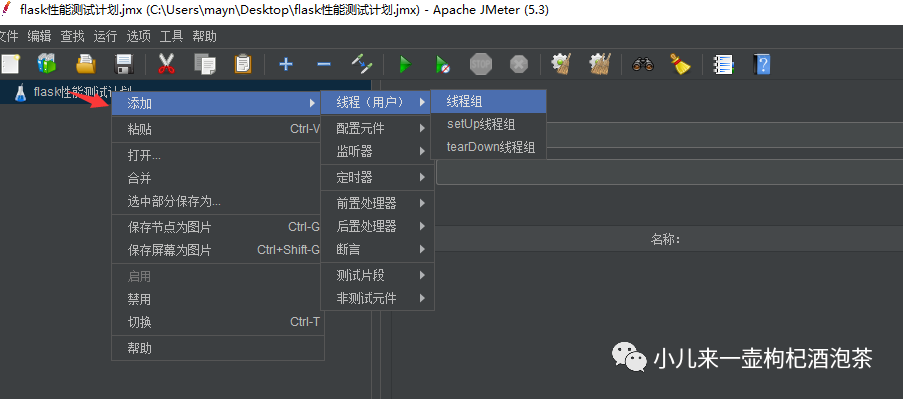
2、添加一个压测的线程组
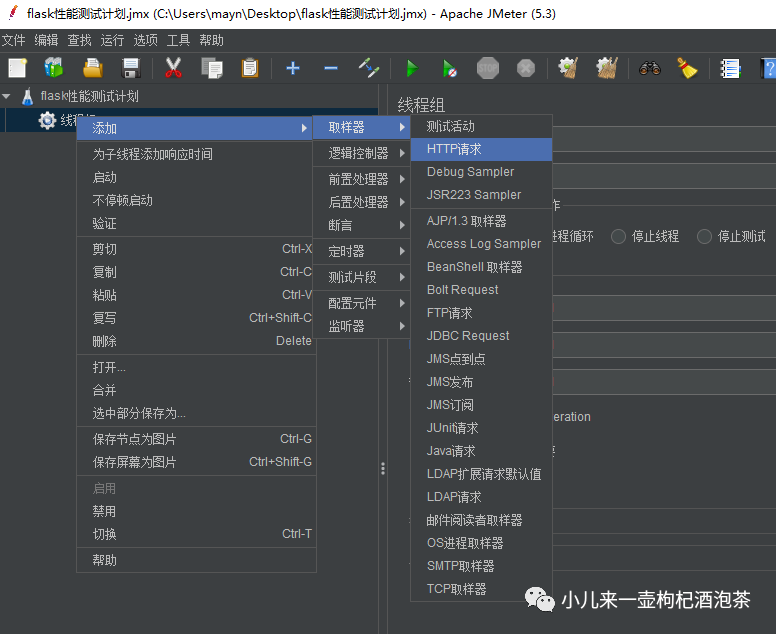
3、给当前线程组添加Http请求压测
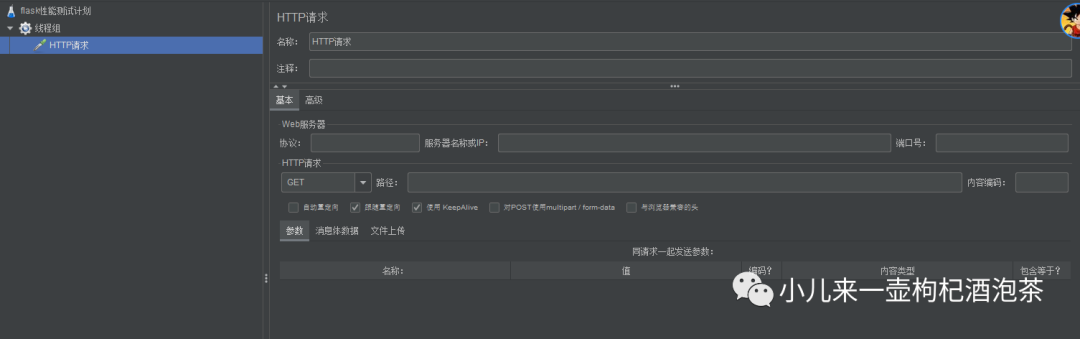
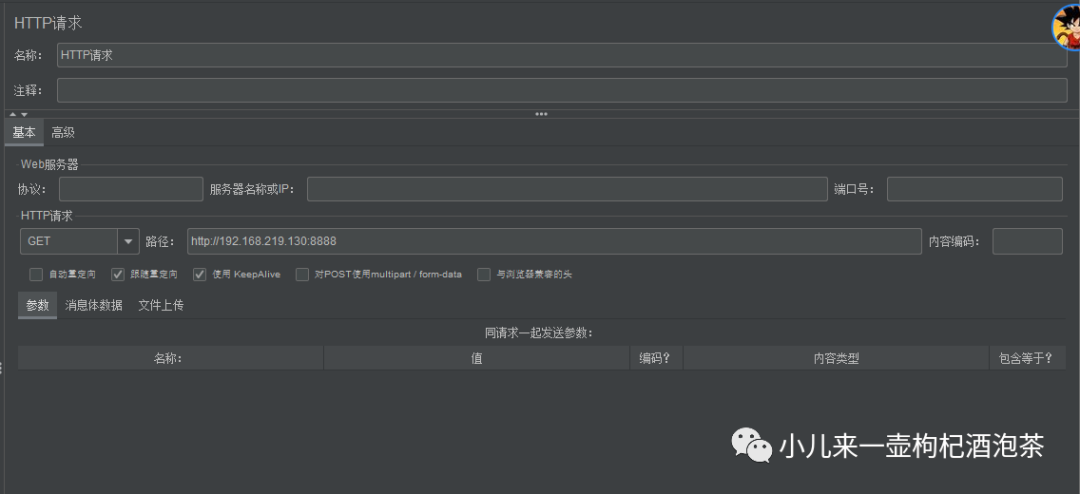
4、配置Http请求压测信息(压测地址和信息)
基本信息配置:
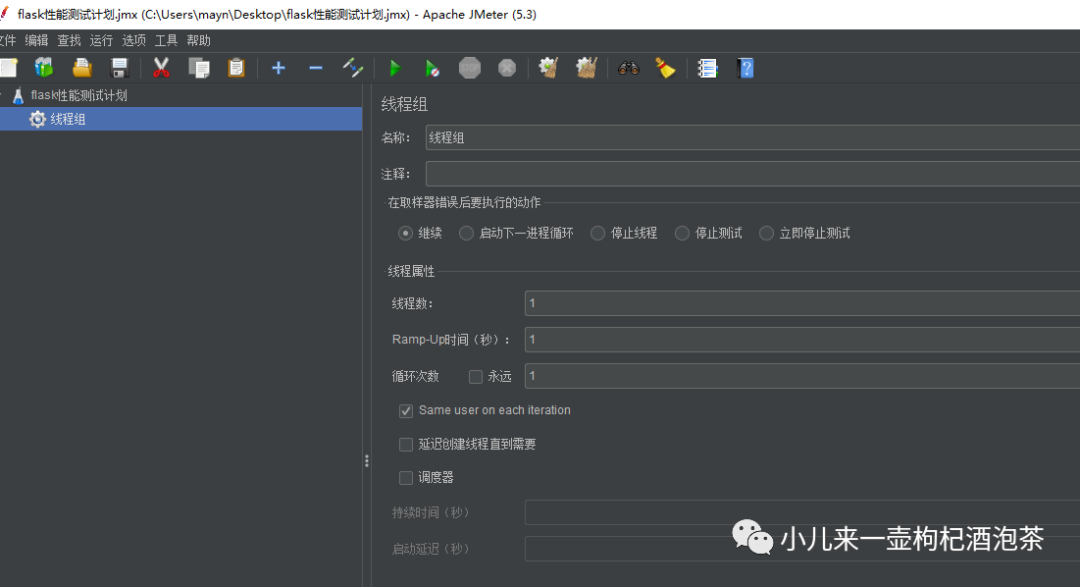
信息线程组信息配置:
线程数:表示发起多少独立的线程请求 Ramp-up时间:表示我需要用多少时间把上面线程数处理完成,0 表示瞬间并发,不需要时间,适用于高并发压测 循环次数:表示寻发送送法几次 发送完成200 再法三次200

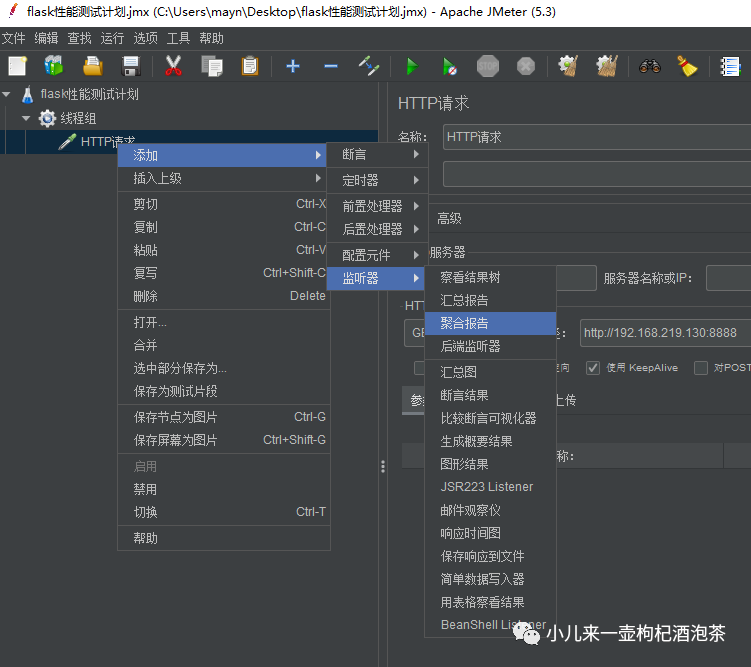
5、给HTTP请求配置一个聚合报告监听器
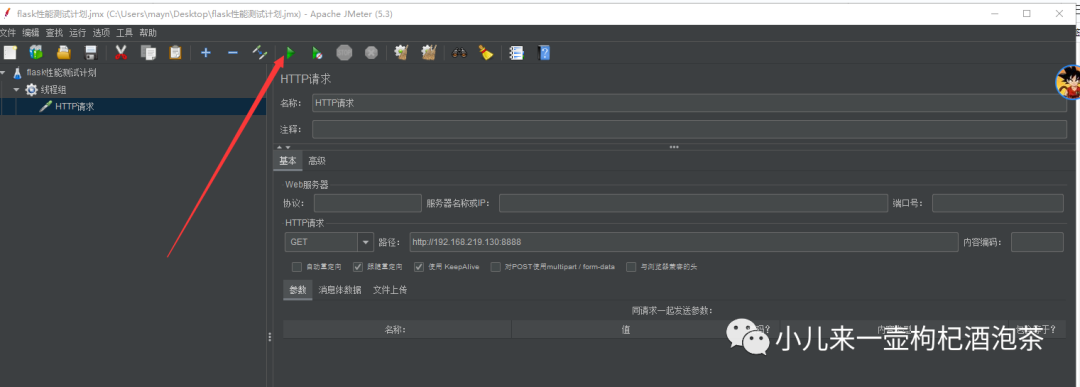
6、点击开始进行压测
查看我们的性能分析输出
[root@localhost xingnengfenxi]# py-spy record -o profile.svg --pid 8516
py-spy> Sampling process 100 times a second. Press Control-C to exit.

py-spy> 1.00s behind in sampling, results may be inaccurate. Try reducing the sampling rate
py-spy> 1.84s behind in sampling, results may be inaccurate. Try reducing the sampling rate
py-spy> 2.72s behind in sampling, results may be inaccurate. Try reducing the sampling rate
py-spy> 3.63s behind in sampling, results may be inaccurate. Try reducing the sampling rate
py-spy> 4.49s behind in sampling, results may be inaccurate. Try reducing the sampling rate
py-spy> 5.38s behind in sampling, results may be inaccurate. Try reducing the sampling rate
py-spy> 6.11s behind in sampling, results may be inaccurate. Try reducing the sampling rate
py-spy> 6.85s behind in sampling, results may be inaccurate. Try reducing the sampling rate
py-spy> 7.66s behind in sampling, results may be inaccurate. Try reducing the sampling rate
py-spy> 8.49s behind in sampling, results may be inaccurate. Try reducing the sampling rate
py-spy> 9.15s behind in sampling, results may be inaccurate. Try reducing the sampling rate
py-spy> 9.87s behind in sampling, results may be inaccurate. Try reducing the sampling rate
py-spy> 10.58s behind in sampling, results may be inaccurate. Try reducing the sampling rate
py-spy> 11.30s behind in sampling, results may be inaccurate. Try reducing the sampling rate
py-spy> 12.03s behind in sampling, results may be inaccurate. Try reducing the sampling rate
py-spy> 13.01s behind in sampling, results may be inaccurate. Try reducing the sampling rate
py-spy> 13.92s behind in sampling, results may be inaccurate. Try reducing the sampling rate
py-spy> 14.72s behind in sampling, results may be inaccurate. Try reducing the sampling rate
py-spy> 15.47s behind in sampling, results may be inaccurate. Try reducing the sampling rate
py-spy> 16.20s behind in sampling, results may be inaccurate. Try reducing the sampling rate
py-spy> 16.90s behind in sampling, results may be inaccurate. Try reducing the sampling rate
py-spy> 16.98s behind in sampling, results may be inaccurate. Try reducing the sampling rate
py-spy> 16.15s behind in sampling, results may be inaccurate. Try reducing the sampling rate
导出性能分析火焰图profile.svg
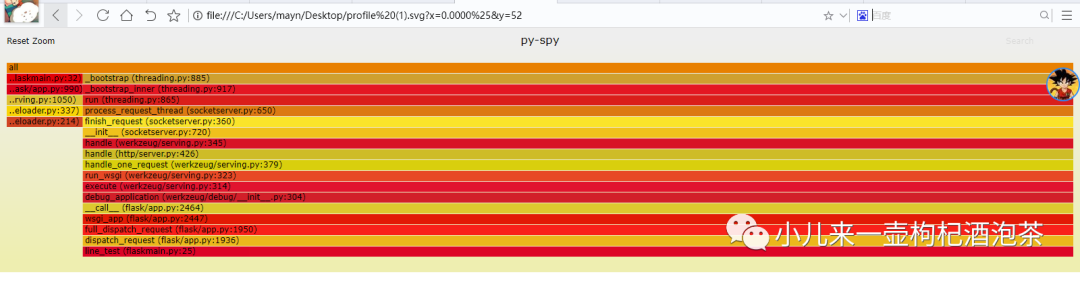
分析火焰图profile.svg
來自阮一峰老师的火焰图的解说:
火焰图:用来展示 CPU 的调用栈
py-spy 生成的火焰图方向:其火焰是向下
y 轴表示调用栈,每一层都是一个函数。调用栈越深,火焰就越高,顶部就是正在执行的函数,下方都是它的父函数。
x 轴表示抽样数,如果一个函数在 x 轴占据的宽度越宽,就表示它被抽到的次数多,即执行的时间长。注意,x 轴不代表时间,而是所有的调用栈合并后,按字母顺序排列的。
颜色没有特殊含义,因为火焰图表示的是 CPU 的繁忙程度,所以一般选择暖色调。
总结:火焰图就是看顶层的哪个函数占据的宽度最大。只要有"平顶"(plateaus),就表示该函数可能存在性能问题。
通过生成火焰图分析程序瓶颈,看profile.svg图中最下方哪个峰顶是平的,那么程序的性能问题就可以从那入手去解决。
第2种 、使用分析进程ID的方式,通过top类似linux 系统top命令输出的实时视图
[root@localhost xingnengfenxi]# py-spy top --pid 8516
# OR
py-spy top -- python myprogram.py (分析flask等的会有异常)
一遍压测一边看观察:
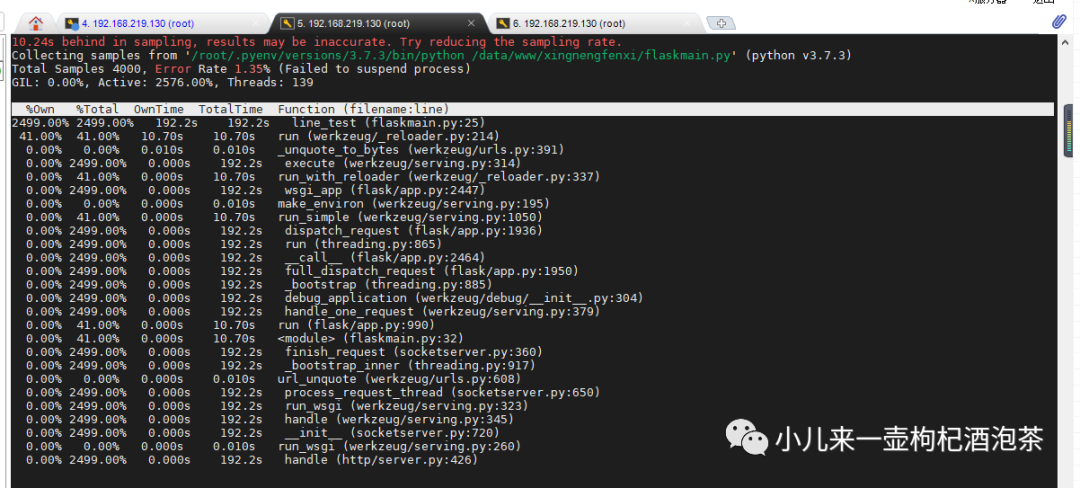
图示相关的参数说明:
按%Own排序:当前在该函数中花费的时间的百分比 按%Total排序:函数及其子级中当前的时间百分比 按OwnTime排序:函数中花费的总时间 按TotalTime排序:该函数及其子项花费的总时间
最主要其实我们的可以通过OwnTime比较直接的定位程序运行中,所占比消耗时间最多的函数
第3种 、使用分析进程ID的方式,通过dump显示每个线程的调用栈
分析命令:
py-spy dump --pid 8516
分析结果:
[root@localhost xingnengfenxi]# py-spy dump --pid 8516
Process 8516: /root/.pyenv/versions/3.7.3/bin/python /data/www/xingnengfenxi/flaskmain.py
Python v3.7.3 (/root/.pyenv/versions/3.7.3/bin/python3.7)

Thread 8516 (idle): "MainThread"
    run (werkzeug/_reloader.py:214)
    run_with_reloader (werkzeug/_reloader.py:337)
    run_simple (werkzeug/serving.py:1050)
    run (flask/app.py:990)
    <module> (flaskmain.py:32)
Thread 8518 (idle): "Thread-1"
    select (selectors.py:415)
    serve_forever (socketserver.py:232)
    serve_forever (werkzeug/serving.py:777)
    inner (werkzeug/serving.py:1009)
    run (threading.py:865)
    _bootstrap_inner (threading.py:917)
    _bootstrap (threading.py:885)
[root@localhost xingnengfenxi]#
说明
部分的图或资料来互联网收集整理,如有侵权,烦请联系,我会立即进行删除。
End
纯属个人实践中相关经验之谈,如有纰漏,还希望大佬们多多提点!小钟同学 | 文 【原创】| QQ:308711822
文章转载自小儿来一壶枸杞酒泡茶,如果涉嫌侵权,请发送邮件至:contact@modb.pro进行举报,并提供相关证据,一经查实,墨天轮将立刻删除相关内容。
