


点击上方“icloud布道师”,“星标或置顶公众号”
逆境前行,能帮你的只有自己


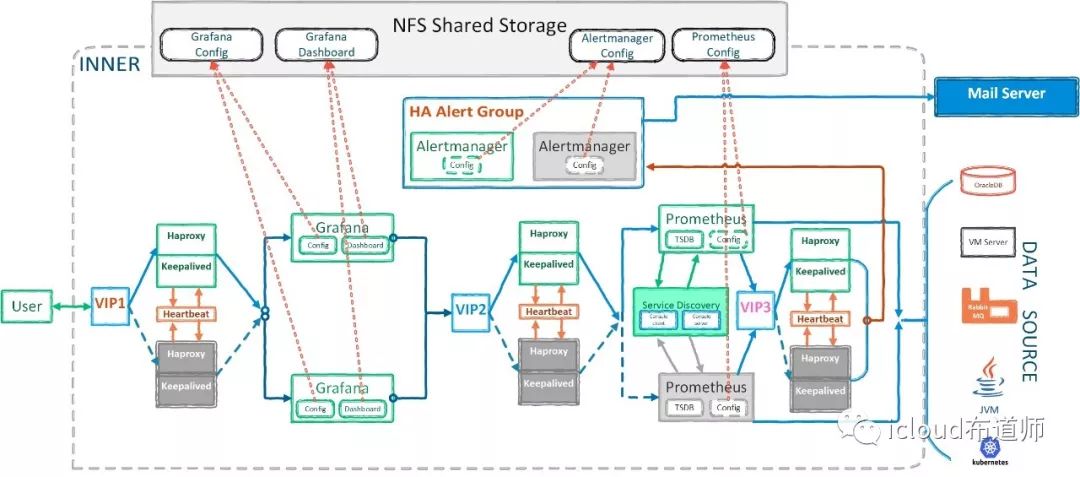
高可用监控方案
----02.分解部署
Mangement of monitored servers
· Monitor new online servers
o Modify the initialization process for the new server
Before the new service goes live,install node_exporter uniformly.
And starts the service as a background process,also open specific ports for network devices such as firewalls
o Compared with traditional monitoring system(Nagios/Zabbix)
In the early days of the new surveillance system, install both Nagios’s nrpe collection plugin and the exporter of Prometheus.Then, the accuracy of the collected data was analyzed and comparedfor a period of time
o Summary analysis
Compare the data of 60 days to check the accuracy and timeliness of alarm.Then observe for a period of time, modify the appropriate alarm threshold, modify the appropriate collection period, etc. Finally, summarize acomparison report, check whether there is any need to improve
· Migratelive servers to new monitoring system
o Determine device type
First of all, it is necessary to distinguish the type of equipment and have different installation procedures for different equipment.
For example, Linux server installs the corresponding collector of Linux,Windows installs the corresponding collector of Windows, network equipment also has corresponding collector
o Server refinement management
Server refinement management Label servers differently for different purposes Install different collections for different servers for different purposes Generate different dashboards for different servers
· Migrate existing business applications to new monitor system
o Get the necessary information
Gets a list of all back-end servers
Get all used application modules
Get all service API interfaces
o Make migration plans
Install different exporters to different use servers
Generate different dashboards
Create an overview of the API health check
o Customized monitoring scheme
Research new monitoring metrics according to business department’s requirement
Collect new monitoring Metrics for the business system
Create a business trend Dashboard
Component information
Main Monitoring System
NFS
1. Purpose
NFS is a distributed file system that enables users to access Shared files on remote computers over a network just as if they were local file systems
Here, we use it to store information such as Shared configuration files
For more information of grafana,see http://nfs.sourceforge.net/
2. Installed version
NFS version: Server nfs v4
3. Mode of installation
Adopt yum installation method
4. Installation configuration
yum install nfs-utils rpcbind -y
systemctl start rpcbind && systemctl enable rpcbind
systemctl start nfs-utils && systemctl enable nfs-utils
5. Server configuration
NFS is a C/S architecture program
For Server:
echo "/var/log/fmw 10.67.194.0/24(rw)" >> /etc/exports
systemctl restart nfs
chmod -R 767 /var/log/fmw
For Client:
mkdir /nfs
mount  -t  nfs   10.67.194.42:/var/log/fmw/    /nfs
 echo "10.67.194.42:/var/log/fmw /nfs   nfs    defaults,_rnetdev       1     1" >> /etc/fstab
6. Server requirements
use the NAS storage
8CPU
16GB Memory
500G SSD disk storage
7. Support necessary departmentsNetwork departmentStorage department
Nginx
1. Purpose
NGINX is a free, open-source HTTP server and reverse proxy. NGINX is known for its high performance, stability, rich feature set, simple configuration, and low resource consumption.
Here, we use it as load balancing to distribute the incoming traffic polling to the two Grafana servers on the back end
For more information about grafana,see https://www.nginx.com/resources/wiki/
2. Installed version
nginx version: nginx/1.12.2
3. Mode of installation
Adopt yum installation method
4. Installation configuration
yum install epel-release -y
yum install nginx -y
systemctl enable nginx && systemctl start nginx
5. Server configuration
mv /etc/nginx/nginx.conf /etc/nginx/nginx.bak

cat > /etc/nginx/nginx.conf <<EOF
user nginx;
worker_processes auto;
error_log /var/log/nginx/error.log;
pid /run/nginx.pid;

include /usr/share/nginx/modules/*.conf;

events {
    worker_connections 1024;
}

http {
    log_format  main  '$remote_addr - $remote_user [$time_local] "$request" '
                      '$status $body_bytes_sent "$http_referer" '
                      '"$http_user_agent" "$http_x_forwarded_for"';

    access_log  /var/log/nginx/access.log  main;
    charset  utf-8;
    sendfile            on;
    tcp_nopush          on;
    tcp_nodelay         on;
    keepalive_timeout   65;
    types_hash_max_size 2048;

    include             /etc/nginx/mime.types;
    default_type        application/octet-stream;

    include /etc/nginx/conf.d/*.conf;

    server {
        listen       80 default_server;
        listen       [::]:80 default_server;
        server_name  _;
        root         /usr/share/nginx/html;

        include /etc/nginx/default.d/*.conf;

        location / {
        root html;
        index  index.html index.htm;
        proxy_pass http://grafanaservers;
        }

        error_page 404 /404.html;
            location = /40x.html {
        }

        error_page 500 502 503 504 /50x.html;
            location = /50x.html {
        }
    }
        upstream grafanaservers{
        server 10.67.194.44:3000 weight=1;
        server 10.67.194.37:3000 weight=1;
        }
}

EOF
do not forget to restart nginx
6. Server requirements4CPU
8GB Memory
500GB disk storage
7. Support necessary departments
mangement by ourself
Grafana
1. Purpose
Grafana is an open source, feature rich metrics dashboard and graph editor for Graphite, Elasticsearch, OpenTSDB, Prometheus and InfluxDB
Here, we use it to help Prometheus generate better graphs of data
For more information of grafana,see the https://grafana.com/
2. Installed version
Grafana version: Version 6.3.3 (commit: 84d0a71, branch: HEAD)
3. Mode of installation
Adopt yum installation method
4. Installation configuration
This is a highly available grafana group, so you need to deploy the same operation on both servers
wget https://dl.grafana.com/oss/release/grafana-6.3.3-1.x86_64.rpm
It’s a slow download
if you’re on the Intranet of homecredit.cn.You can do the same thing:
wget http://10.67.194.43:8099/grafana-6.3.3-1.x86_64.rpm
and then,install this rpm package
yum localinstall grafana-6.3.3-1.x86_64.rpm
systemctl enable grafana && systemctl start grafana
5. Server configuration
This is a highly available grafana group, so you need to deploy the same operation on both servers
Since the front-end nginx polling is distributed to these two grafana servers, the configuration information for these two grafana servers is saved to NFS
We use soft links for configuration
This two servers perform the operation as NFS clientRefer to NFS client operations
share the grafana configuration
share the grafana configuration
 mkdir -p /nfs/grafana/{etc,lib}

 mv /etc/grafana /nfs/grafana/etc/
 mv /var/lib/grafana /nfs/grafana/lib/

 ln -s /nfs/grafana/etc/grafana /etc/grafana
 ln -s /nfs/grafana/lib/grafana /var/lib/grafana
Here are the configured profiles
 cat > /nfs/grafana/etc/grafana/grafana.ini <<EOF
 [paths]
[server]
enable_gzip = true
[database]
log_queries =
[remote_cache]
[dataproxy]
[analytics]
[security]
[snapshots]
[dashboards]
[users]
[auth]
[auth.anonymous]
[auth.github]
[auth.google]
[auth.generic_oauth]
[auth.grafana_com]
[auth.proxy]
[auth.basic]
[auth.ldap]
enabled = true
config_file = /etc/grafana/ldap.toml
[smtp]
enabled = true
host = relay.homecredit.cn:25
user = hcg\hccservicedesk
from_address = uathccservicedesk@homecredit.cn
from_name = Grafana.hcctool.net
ehlo_identity = dashboard.example.com
[emails]
[log]
filters = ldap:debug
[log.console]
[log.file]
[log.syslog]
[alerting]
enabled = true
execute_alerts = true
error_or_timeout = alerting
[explore]
[metrics]
[metrics.graphite]
[tracing.jaeger]
[grafana_com]
[external_image_storage]
[external_image_storage.s3]
[external_image_storage.webdav]
[external_image_storage.gcs]
[external_image_storage.azure_blob]
[external_image_storage.local]
[rendering]
[enterprise]
[panels]
[plugins]

 EOF
/var/lib/grafana
inside the configuration file does not need to change, go directly to the web side configuration
6. Server requirements
8CPU
16GB Memory
500G SSD disk storage8CPU
16GB Memory
500G SSD disk storage
7. Support necessary departments
mangement by ourself
HAproxy
1. Purpose
Haproxy is a freely developed source code software written in the c language that provides high availability, load balancing, and application proxies based on HTTP and TCP.
Here,we use it to keep Prometheus highly available,normally one server serves and the other serves as a backup
2. Installed version
HAproxy version HA-Proxy version 1.9.0
3. Mode of installation
Source code compilation and installation
4. Installation configuration
 wget https://github.com/haproxy/haproxy/archive/v1.9.0.tar.gz
 tar -zxvf   v1.9.0.tar.gz -C /usr/local/
 cd /usr/local/haproxy-1.9.0/
 make -j $(nproc) TARGET=linux-glibc
 make install PREFIX=/usr/local/haproxy
5. Server configuration
 mkdir /usr/local/haproxy/etc

 cat >/usr/local/haproxy/etc/haproxy.cfg <<EOF
 global
 log 127.0.0.1  local0
 maxconn 4096
 chroot /usr/local/haproxy
 uid 99
 gid 99
 daemon
 nbproc 4
 pidfile /usr/local/haproxy/run/haproxy.pid
 maxconn     300

 defaults
 log    global
 log    127.0.0.1      local3
 mode    http
 option  httplog
 option  httpclose
 option  dontlognull
 option  forwardfor
 option  redispatch
 retries 2
 balance roundrobin
 timeout connect      5000
 timeout client       50000
 timeout server      50000
 mode    http
 option  httpchk GET /graph

 frontend http
 bind 10.67.194.43:9090
 default_backend http_back

 backend http_back
 server  s1 10.67.194.44:9090 check inter 2000 rise 3 fall 3
 server  s2 10.67.194.37:9090 check inter 2000 rise 3 fall 3 backup

 listen admin_stats
         bind 0.0.0.0:9188
         mode http
         stats uri /haproxy-status
EOF
6. Server requirements4CPU
8GB Memory
500G SSD disk storage
7. Support necessary departments
mangement by ourself
Prometheus
1. Purpose
Prometheus is an open-source systems monitoring and alerting toolkit originally built at SoundCloud
Here,we use it to replace Nagios/Zabbix
For more elaborate overviews of Prometheus, see the https://prometheus.io/docs/introduction/media/
2. Installed versionprometheus, version 2.11.0go version: go1.12.7
3. Mode of installation
Binary installation
4. Installation configuration
This is a highly available grafana group, so you need to deploy the same operation on both servers
wget https://github.com/prometheus/prometheus/releases/download/v2.11.1/prometheus-2.11.1.linux-amd64.tar.gz
It’s a slow download
if you’re on the Intranet of homecredit.cn.You can do the same thing:
wget http://10.67.194.43:8099/prometheus-2.11.0.linux-amd64.tar.gz
And then
 tar -xvfz prometheus-*.tar.gz -C /opt/prometheus
 cd /
5. Server configuration
This is a highly available grafana group, so you need to deploy the same operation on both servers
mkdir -p /nfs/prometheus/{config,alert_rules,record_rules}
cat >/nfs/prometheus/alert_rules/alertingrules.yml <<EOF
 groups:
- name: node
  rules:

  # Alert for any instance that is unreachable for >5 minutes.
  - alert: InstanceDown
    expr: up{job!="ssh_status"} == 0
    for: 3m
    labels:
      severity: critical
    annotations:
      summary: "Instance {{ $labels.instance }} down"
      description: "{{ $labels.instance }} of job {{ $labels.job }} has been down for more than 3 minutes."

  # Alert for any node instance's cpu that is greater than 80%/90% for >3m.
  - alert: CPUUsedPcentTooGreater
    expr: |
      instance:node_cpu_used:pcent{instance!~"10.111.4.114:.*",job!="cnode"} > 90
    for: 3m
    labels:
      severity: critical
    annotations:
      summary: "Node {{ $labels.instance }} cpu used percent too greater"
      description: |
        Test Node {{ $labels.instance }} cpu used percent greater than 90%
        (current value: {{ $value | printf "%.1f" }}%)
  - alert: CPUUsedPcentTooGreater
    expr: |
      instance:node_cpu_used:pcent{instance!~"10.111.4.114:.*",job!="cnode"} > 80
    for: 3m
    labels:
      severity: warning
    annotations:
      summary: "Node {{ $labels.instance }} cpu used percent too greater"
      description: |
        Node {{ $labels.instance }} cpu used percent greater than 80%
        (current value: {{ $value | printf "%.1f" }}%)

  # Alert for any node instance's memory that is greater than 80%/90% for >3m.
  - alert: MemoryUsedPcentTooGreater
    expr: instance:node_memory_MemUsed:pcent{instance!="10.111.2.4:9100"} > 90
    for: 3m
    labels:
      severity: critical
    annotations:
      summary: "Node {{ $labels.instance }} memory used percent too greater"
      description: |
        Node {{ $labels.instance }} memory used percent greater than 90%
        (current value: {{ $value | printf "%.1f" }}%)
  - alert: MemoryUsedPcentTooGreater
    expr: instance:node_memory_MemUsed:pcent{instance!="10.111.2.4:9100"} > 80
    for: 3m
    labels:
      severity: warning
    annotations:
      summary: "Node {{ $labels.instance }} memory used percent too greater"
      description: |
        Node {{ $labels.instance }} memory used percent greater than 80%
        (current value: {{ $value | printf "%.1f" }}%)

  # Alert for any filesystem.
  - alert: FilesystemUsedPcentTooGreater
    expr: mountpoint:node_filesystem:pcent{cluster="paracloud"} > 90
    for: 3m
    labels:
      severity: critical
    annotations:
      summary: "Mountpoint {{ $labels.mountpoint }} used percent too greater"
      description: >
        Node {{ $labels.instance }} mountpoint {{ $labels.mountpoint }} used percent greater than 90%
        (current value: {{ $value | printf "%.1f" }}%)
  - alert: FilesystemUsedPcentTooGreater
    expr: mountpoint:node_filesystem:pcent{cluster="paracloud"} > 80
    for: 3m
    labels:
      severity: warning
    annotations:
      summary: "Mountpoint {{ $labels.mountpoint }} used percent too greater"
      description: >
        Node {{ $labels.instance }} mountpoint {{ $labels.mountpoint }} used percent greater than 80%
        (current value: {{ $value | printf "%.1f" }}%)
  - alert: FilesystemIUsedPcentTooGreater
    expr: mountpoint:node_filesystem_files:ipcent{cluster="paracloud"} > 90
    for: 3m
    labels:
      severity: critical
    annotations:
      summary: "Mountpoint {{ $labels.mountpoint }} inode used percent too greater"
      description: >
        Node {{ $labels.instance }} mountpoint {{ $labels.mountpoint }} inode used percent greater than 90%
        (current value: {{ $value | printf "%.1f" }}%)
  - alert: FilesystemIUsedPcentTooGreater
    expr: mountpoint:node_filesystem_files:ipcent{cluster="paracloud"} > 80
    for: 3m
    labels:
      severity: warning
    annotations:
      summary: "Mountpoint {{ $labels.mountpoint }} inode used percent too greater"
      description: >
        Node {{ $labels.instance }} mountpoint {{ $labels.mountpoint }} inode used percent greater than 80%
        (current value: {{ $value | printf "%.1f" }}%)

  # Alert for GZ ln31 /home avail less than 5GiB
  - alert: FilesystemAvailTooLess
    expr: node_filesystem_avail{job="node",cluster="gz",mountpoint="/home"} < 5368709120
    for: 3m
    labels:
      severity: critical
    annotations:
      summary: "Mountpoint {{ $labels.mountpoint }} avail too less"
      description: "Node {{ $labels.instance }} mountpoint {{ $labels.mountpoint }} less than 5GiB (current value: {{ $value | humanize1024 }}B)"
/nfs/prometheus/config/prometheus.yml
cat >/nfs/prometheus/config/prometheus.yml <<EOF
 global:
  scrape_interval: 10s
  scrape_timeout: 10s
  evaluation_interval: 10s
  external_labels:
    hczone: china
    datacenter: wuqing
    location: wuqing
alerting:
  alertmanagers:
  - static_configs:
    - targets:
      - 10.67.194.37:9093
    scheme: http
    timeout: 10s
rule_files:
- /opt/prometheus/current/record_rules/recordingrules.yml
- /opt/prometheus/current/alert_rules/alertingrules.yml
scrape_configs:

- job_name: prometheus
  scrape_interval: 10s
  scrape_timeout: 10s
  metrics_path: /metrics
  scheme: http
  static_configs:
  - targets:
    - 10.67.194.37:9090
    labels:
      cluster: tooltest
      service: monitor
      env: test

- job_name: consul
  scrape_interval: 5s
  scrape_timeout: 5s
  metrics_path: /metrics
  scheme: http
  consul_sd_configs:
    - server: 10.67.194.37:8500
      services: []
      tags:
        - tooltest
        - test
  relabel_configs:
    #- source_labels: [__meta_consul_service]
    #  target_label: job
    - regex: __meta_consul_service_metadata_(.*)
      replacement: '${1}'
      action: labelmap

- job_name: http_get
  scrape_interval: 10s
  scrape_timeout: 10s
  metrics_path: /probe
  params:
    module: [http_2xx]  # Look for a HTTP 200 response.
  static_configs:
    - targets:
      - http://baidu.com
      - https://baidu.com
      - http://www.google.com
      - https://www.google.com
      labels:
        cluster: tooltest
        env: test
        service: hcpay
    - targets:
      - http://10.67.194.40:80  # Target to probe with http on port 80.
      - http://10.67.194.41:9997 # Target to probe with http on port 9997
      labels:
        cluster: tooltest
        env: test
        service: capp
  relabel_configs:
      - source_labels: [__address__]
        target_label: __param_target
      - source_labels: [__param_target]
        target_label: instance
      - target_label: __address__
        replacement: 10.67.194.37:9115  # The blackbox exporter's real hostname:port.

- job_name: ping
  scrape_interval: 1s
  scrape_timeout: 1s
  metrics_path: /probe
  params:
    module: [icmp]  # Look for a HTTP 200 response.
  static_configs:
    - targets:
      - baidu.com
      - 10.25.13.105
      - 10.29.248.11
      - 10.67.194.41
      - 223.5.5.5
      - google.com
      labels:
        cluster: tooltest
        env: test
        service: ping_check
  relabel_configs:
      - source_labels: [__address__]
        target_label: __param_target
      - source_labels: [__param_target]
        target_label: instance
      - target_label: __address__
        replacement: 10.67.194.37:9115  # The blackbox exporter's real hostname:port.

- job_name: ssh_check
  scrape_interval: 10s
  scrape_timeout: 10s
  metrics_path: /probe
  params:
    module: [ssh_banner]  # Look for a HTTP 200 response.
  static_configs:
    - targets:
      - 10.25.13.105
      - 10.67.194.41
      - 10.67.194.42
      labels:
        cluster: tooltest
        env: test
        service: ssh_check
  relabel_configs:
      - source_labels: [__address__]
        target_label: __param_target
      - source_labels: [__param_target]
        target_label: instance
      - target_label: __address__
        replacement: 10.67.194.37:9115  # The blackbox exporter's real hostname:port.

- job_name: jira_uat
  scheme: https
  metrics_path: '/plugins/servlet/prometheus/metrics'
  static_configs:
    - targets: ['jira-uat.homecredit.cn']

EOF
/nfs/prometheus/record_rules/recordingrules.yml
 cat >/nfs/prometheus/record_rules/recordingrules.yml <<EOF
 groups:
- name: node
  rules:
  # Filesystem
  - record: mountpoint:node_filesystem:used
    expr: >
      node_filesystem_size_bytes{device=~"/dev/.*", mountpoint!~"/var/lib/docker/.*"}
      - node_filesystem_free_bytes{device=~"/dev/.*", mountpoint!~"/var/lib/docker/.*"}
  - record: mountpoint:node_filesystem:pcent
    expr: >
      mountpoint:node_filesystem:used{device=~"/dev/.*", mountpoint!~"/var/lib/docker/.*"}
      * 100
      / (
        mountpoint:node_filesystem:used{device=~"/dev/.*", mountpoint!~"/var/lib/docker/.*"}
        + node_filesystem_avail_bytes{device=~"/dev/.*", mountpoint!~"/var/lib/docker/.*"}
      )
  - record: mountpoint:node_filesystem_files:iused
    expr: >
      node_filesystem_files{device=~"/dev/.*", mountpoint!~"/var/lib/docker/.*"}
      - node_filesystem_files_free{device=~"/dev/.*", mountpoint!~"/var/lib/docker/.*"}
  - record: mountpoint:node_filesystem_files:ipcent
    expr: >
      mountpoint:node_filesystem_files:iused{device=~"/dev/.*", mountpoint!~"/var/lib/docker/.*"}
      * 100
      / node_filesystem_files{device=~"/dev/.*", mountpoint!~"/var/lib/docker/.*"}

  - record: instance:node_memory_MemUsed:pcent
    expr: |
      (
        node_memory_MemTotal_bytes
        - node_memory_MemAvailable_bytes
      )
      * 100
      / node_memory_MemTotal_bytes

  - record: instance:node_cpu_used:pcent
    expr: |
      100
      - (
          sum(irate(node_cpu_seconds_total{mode="idle"}[5m])) by (service,cluster,job,instance)
          / count(node_cpu_seconds_total{mode="idle"}) by (service,cluster,job,instance)
      )
      * 100

 EOF
Making soft links
  ln -s /nfs/prometheus/alert_rules  /opt/prometheus/prometheus-2.11.0.linux-amd64/alert_rules
   ln -s /nfs/prometheus/config  /opt/prometheus/prometheus-2.11.0.linux-amd64/config
   ln -s /nfs/prometheus/record_rules  /opt/prometheus/prometheus-2.11.0.linux-amd64/record_rules
Make the startup script
Server 1
cat > /opt/prometheus/prometheus-2.11.0.linux-amd64/ << EOF
#!/bin/bash

set -o nounset
set -o errexit
#set -x

readonly ROOT_DIR=/opt/prometheus/prometheus-2.11.0.linux-amd64/
readonly CONFIG_DIR=${ROOT_DIR}/config
readonly DATA_DIR=${ROOT_DIR}/data
readonly LOG_FILE=${ROOT_DIR}/log/prometheus.log

export PATH=$PATH:${ROOT_DIR}

nohup prometheus --config.file=${CONFIG_DIR}/prometheus.yml --storage.tsdb.path=${DATA_DIR} --web.external-url=http://10.67.194.44:9090 --web.enable-lifecycle --web.enable-admin-api --web.console.templates=${ROOT_DIR}/consoles --web.console.libraries=${ROOT_DIR}/console_libraries > ${LOG_FILE} 2>&1 &
EOF
Server 2
cat > /opt/prometheus/prometheus-2.11.0.linux-amd64/ << EOF
#!/bin/bash

set -o nounset
set -o errexit
#set -x

readonly ROOT_DIR=/opt/prometheus/prometheus-2.11.0.linux-amd64/
readonly CONFIG_DIR=${ROOT_DIR}/config
readonly DATA_DIR=${ROOT_DIR}/data
readonly LOG_FILE=${ROOT_DIR}/log/prometheus.log

export PATH=$PATH:${ROOT_DIR}

nohup prometheus --config.file=${CONFIG_DIR}/prometheus.yml --storage.tsdb.path=${DATA_DIR} --web.external-url=http://10.67.194.37:9090 --web.enable-lifecycle --web.enable-admin-api --web.console.templates=${ROOT_DIR}/consoles --web.console.libraries=${ROOT_DIR}/console_libraries > ${LOG_FILE} 2>&1 &
EOF
6. Server requirements
8CPU
16GB Memory
500G SSD disk storage8CPU
16GB Memory
500G SSD disk storage
7. Support necessary departments
mangement by ourself
Alertmanager
1. Purpose
Alertmanager is mainly used for receiving warning information from Prometheus. It supports rich warning notification channels and is an advanced warning notification system that is easy to realize warning information reemphasis, noise reduction, grouping and policy routing.
For more information of alertmanager,seehttps://prometheus.io/docs/alerting/alertmanager/
2. Installed version
Alertmanager version: alertmanager, version 0.18.0
3. Mode of installation
Binary installation
4. Installation configuration
The interface of the alertmanager was specified in the Prometheus.yml
file above
wget https://github.com/prometheus/alertmanager/releases/download/v0.18.0/ale rtmanager-0.18.0.linux-amd64.tar.gz
It’s a slow download
if you’re on the Intranet of homecredit.cn.You can do the same thing:
wget http://10.67.194.43:8099/alertmanager-0.18.0.linux-amd64.tar.gz
And then
tar -zxvf v0.18.0/ale rtmanager-0.18.0.linux-amd64.tar.gz -C /opt/alertmanager/alertmanager-0.18.0.linux-amd64
5. Server configuration
 cd /opt/alertmanager/alertmanager-0.18.0.linux-amd64
 mkdir cofig

  cat >config/alertmanager.yml << EOF
  global:
    resolve_timeout: 5m
    smtp_from: 'uathccservicedesk@homecredit.cn'
    smtp_smarthost: 'relay.homecredit.cn:25'
    smtp_auth_username: 'hcg\hccservicedesk'
    smtp_auth_password: ''
    smtp_require_tls: false

  route:
    group_by: ['instance']
    group_wait: 10m
    group_interval: 10s
    repeat_interval: 10m
    receiver: 'email.alert.prometheusalert'
 receivers:
   - name: 'email.alert.prometheusalert'
     email_configs:
   - to: 'XXX@homecredit.cn'
EOF
Make the startup script
cat > run.sh << EOF
#!/bin/bash

set -o nounset
set -o errexit
#set -x

readonly ROOT_DIR=/opt/alertmanager/alertmanager-0.18.0.linux-amd64
readonly CONFIG_DIR=${ROOT_DIR}/config
readonly DATA_DIR=${ROOT_DIR}/data
readonly LOG_FILE=${ROOT_DIR}/log/alertmanager.log

export PATH=$PATH:${ROOT_DIR}

nohup alertmanager --config.file=${CONFIG_DIR}/alertmanager.yml --storage.path=${DATA_DIR} --log.level=debug > ${LOG_FILE} 2>&1 &
EOF
6. Server requirements4CPU
8GB Memory
500G disk storage
7. Support necessary departments
mangement by ourself
Consul
1. Purpose
Consul supports multiple data center is a distributed service discovery of high availability and software configuration of Shared services.
Here, we use consul to as service discovery of Prometheus, change the configuration does not require frequent restart when Prometheus
For more information of consul,see https://www.consul.io/
2. Installed version
consul version:Consul v1.6.0
3. Mode of installation
Binary installation
4. Installation configuration
This is a highly available grafana group, so you need to d
wget wget https://releases.hashicorp.com/consul/1.6.0/consul_1.6.0_linux_amd64.zip
It’s a slow download
if you’re on the Intranet of homecredit.cn.You can do the same thing:
wget http://10.67.194.43:8099/consul_1.6.0_linux_amd64.zip
And then unzip unzip consul_1*
mkdir /opt/consul
cp consul /opt/consul && cd /opt/consul
5. Server configuration
There are four nodes in total, including three servers and one client
For server 1
 mkdir -p /opt/consul/data
 mkdir /etc/consul.d
 cat > /opt/consul/run-s1.sh << EOF
 #!/bin/bash
 DIR=/opt/consul/data
 ADDRESS=$(ip a | grep inet | egrep 'eth|ens' |awk '{print $2}' |awk -F "/"  '{print $1}')
 CONSUL_CONFIG=/etc/consul.d
 nohup ./consul agent -server \
 -bootstrap-expect 3 \
 -data-dir=${DIR} \
 -config-dir=${CONSUL_CONFIG} \
 -node=${ADDRESS} \
 -bind=${ADDRESS} \
 -advertise=${ADDRESS} \
 -client=0.0.0.0 \
 -ui \
 >./consul.out  2>&1 &
 EOF
For server 2
 mkdir -p /opt/consul/data
 mkdir /etc/consul.d
 cat > /opt/consul/run-s2.sh << EOF
 #!/bin/bash
 DIR=/opt/consul/data
 ADDRESS=$(ip a | grep inet | egrep 'eth|ens' |awk '{print $2}' |awk -F "/"  '{print $1}')
 CONSUL_CONFIG=/etc/consul.d
 nohup ./consul agent -server \
 -bootstrap-expect 3 \
 -data-dir=${DIR} \
 -config-dir=${CONSUL_CONFIG} \
 -node=${ADDRESS} \
 -bind=${ADDRESS} \
 -advertise=${ADDRESS} \
 -client=0.0.0.0 \
 -join=10.67.194.42 \
 -ui \
 >./consul.out  2>&1 &
 EOF
For server 3
It is exactly the same as the script for server2For client 1
  mkdir -p /opt/consul/data
 mkdir /etc/consul.d
 cat > /opt/consul/run-s2.sh << EOF
 #!/bin/bash
 DIR=/opt/consul/data
 ADDRESS=$(ip a | grep inet | egrep 'eth|ens' |awk '{print $2}' |awk -F "/"  '{print $1}')
 CONSUL_CONFIG=/etc/consul.d
 nohup ./consul agent -client \
 -bind=${ADDRESS} \
 -client=0.0.0.0 \
 -join=10.67.194.42 \
 >./consul.out  2>&1 &
 EOF
View the results with the following command./consul members
Here is an example of a json file
  cat > node.json << EOF
   {
  "ID": "wqdcsrv031.cn.infra_node_exporter",
  "Name": "node",
  "Tags": [
    "node_exporter",
    "rhel",
    "test",
    "tooltest"
  ],
  "Address": "10.67.194.40",
  "Port": 10010,
  "Meta": {
    "zone": "WUQING",
    "cluster": "tooltest",
    "service": "splunk",
    "context": "monitoring",
    "ostype": "rhel",
    "env": "test"
  },
  "EnableTagOverride": false,
  "Checks": [
      {
    "HTTP": "http://10.67.194.40:10010/metrics",
    "Interval": "10s"
  }
 ]
 }
 EOF
By the consul API interface to register the file
curl -X PUT -d 'node.json' http://10.67.194.41:8500/v1/agent/service/register
10.67.194.41 is the address of client
6. Server requirements
4CPU
8GB Memory
500G disk storage4CPU
8GB Memory
500G disk storage4CPU
8GB Memory
500G disk storage4CPU
8GB Memory
500G disk storage
7. Support necessary departments
mangement by ourself
Monitoring Metrics Collection
For regular servers,We just need to install the node_exporter,The rest are optional personalization plug-ins
node_exporter
1. Purpose
As the exporter to the Linux server, contains most of the data we are likely to use
Here, we’re using node_exporter to provide metrics to Prometheus
2. Installed version
node_exporter version: version 0.18.1
3. Mode of installation
No complicated operations are required, and it is still binary package startup mode
4. Installation configuration
wget https://github.com/prometheus/node_exporter/releases/download/v0.18.1/node_exporter-0.18.1.linux-amd64.tar.gz
It’s a slow download
if you’re on the Intranet of homecredit.cn.You can do the same thing:
wget http://10.67.194.43:8099/node_exporter-0.18.1.linux-amd64.tar.gz
mkdir /opt/node_exporter | tar -zxvf node_exporter-* -C /opt/node_exporter
5. Server configuration
 #!/bin/bash

  set -o nounset
  set -o errexit
   #set -x

   readonly ROOT_DIR=/opt/node_exporter/
   readonly METRIC_DIR=${ROOT_DIR}/metric
   LOG_FILE=${ROOT_DIR}/node_exporter.log

  export PATH=$PATH:${ROOT_DIR}

  nohup node_exporter --collector.logind \
  --collector.processes \
  --collector.systemd \
  --collector.tcpstat \
  --collector.textfile.directory=${METRIC_DIR} \
  --no-collector.mdadm
6. Support necessary departments
linux team
jvm_exporter
1.Purpose
1. Purpose
Monitoring JVM status
2.Installed version
jmx_prometheus_javaagent-0.12.0.jar
3. Mode of installation
The javaagent approach starts with the jar
4. Installation configuration
wget https://repo1.maven.org/maven2/io/prometheus/jmx/jmx_prometheus_javaagent/0.12.0/jmx_prometheus_javaagent-0.12.0.jar
5. Server configuration
java -javaagent:./jmx_prometheus_javaagent-0.12.0.jar=8080:config.yaml -jar yourJar.jar
Oracle_exporter
Refer to https://github.com/iamseth/oracledb_exporter
Mysqld_exporter
Refer to https://github.com/prometheus/mysqld_exporter
Consul_exporter
Refer to https://github.com/prometheus/consul_exporter
Jira_exporter
Refer to https://github.com/AndreyVMarkelov/jira-prometheus-exporter
Memcached_exporter
Refer to https://github.com/prometheus/memcached_exporter
HAproxy_exporter
Refer to https://github.com/prometheus/haproxy_exporter
etc…
For The Future
See the picture
