


点击上方“icloud布道师”,“星标或置顶公众号”
逆境前行,能帮你的只有自己


Nagios概述
什么是Nagios
Nagios是一款开源的免费网络监视工具,能有效监控Windows、Linux和Unix的主机状态,交换机路由器等网络设备,打印机等。在系统或服务状态异常时发出邮件或短信报警第一时间通知网站运维人员,在状态恢复后发出正常的邮件或短信通知。
Nagios系统需求
Nagios所需要的运行条件是机器必须可以运行Linux(或是Unix变种)并且有C语言编译器。你必须正确地配置TCP/IP协议栈以使大多数的服务检测可以通过网络得以进行。你需要但并非必须正确地配置Nagios里的CGIs程序,而一旦你要使用CGI程序时,你必须要安装以下这些软件...一个WEB服务(最好是Apache)
Nagios相关网站
官方网站:http://www.nagios.org
针对于Nagios,我们需要配合许多组件和插件来工作(打开很慢,需要FQ):
https://www.nagios.org/downloads/nagios-core-frontends/
//Nagios界面很不美观,可以更换主题
https://www.nagios.org/downloads/nagios-core-addons/
//Nagios插件
https://exchange.nagios.org
//各类拓展组件官方网站,包括脚本
https://exchange.nagios.org/directory/Addons
Nginx模式优点
Nagios运行模式
数据收集是C/S模式
用户查看监控信息是B/S模式
Nagios优点
1:监控网路服务状态(HTTPD,FTP,SSH,MySql……)
2:监控主机资源(处理器符合,硬盘利用率……)
3:拓展,根据自己的需求实现拓展检测功能(插件开发)
4:自动日志回滚
5:能够定义网络主机的层次,允许逐级检查,就是从父主机开始向下检查
6:警告,基于状态的警告:OK,Warning(警告),critical(关键),unknown(未知)
7:可以支持并实现对主机的冗余监控
8:Web界面可以查看当前网络状态,通知,问题历史,日志文件等
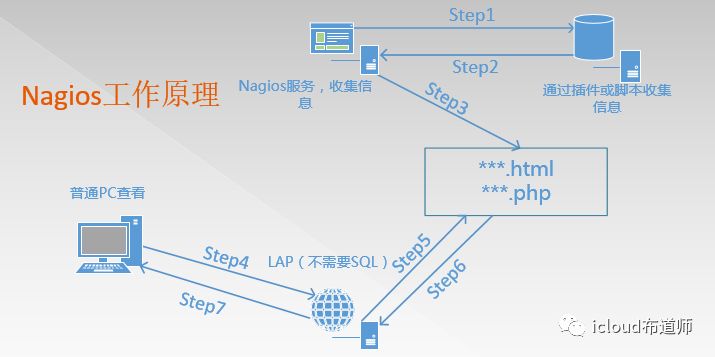
Nagios运行原理
Nagios运行原理
Nagios的功能是监控服务和主机,但是他自身并不包括这部分功能,所有的监控、检测功能都是通过各种插件来完成的。
启动Nagios后,它会周期性的自动调用插件去检测服务器状态,同时Nagios会维持一个队列,所有插件返回来的状态信息都进入队列,Nagios每次都从队首开始读取信息,并进行处理后,把状态结果通过web显示出来。
Nagios提供了许多插件,利用这些插件可以方便的监控很多服务状态。安装完成后,在nagios主目录下的/libexec里放有nagios自带的可以使用的所有插件,如,check_disk是检查磁盘空间的插件,check_load是检查CPU负载的,等等。每一个插件可以通过运行./check_xxx –h 来查看其使用方法和功能。
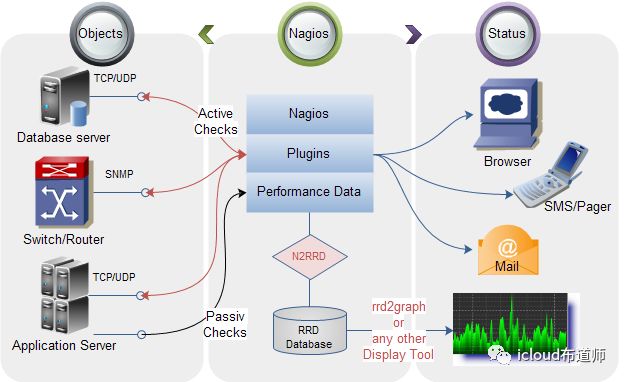
在大规模生产环境中,如果需要浏览历史数据,需要结合db
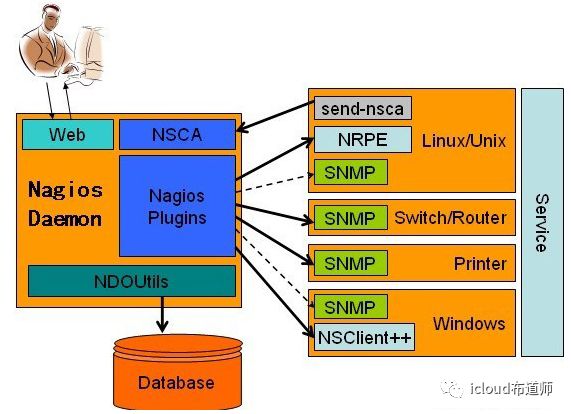
获取数据的方式:主动发送、NRPE插件、SNMP、NSClient++
Nagios 通过NRPE 来远端管理服务
1. Nagios 执行安装在它里面的check_nrpe 插件,并告诉check_nrpe 去检测哪些服务。
2. 通过SSL,check_nrpe 连接远端机子上的NRPE daemon
3. NRPE 运行本地的各种插件去检测本地的服务和状态(check_disk,..etc)
4. 最后,NRPE 把检测的结果传给主机端的check_nrpe,check_nrpe 再把结果送到Nagios状态队列中。
5. Nagios 依次读取队列中的信息,再把结果显示出来。
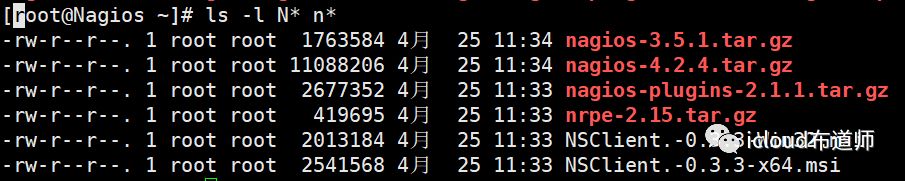
Nagios需要的软件包
LAP环境,不需要mysql
nagios-3.5.1.tar.gz
#Nagios核心文件,Nagios服务文件,不建议用最新,很多插件没做好
nagios-plugins-2.1.1.tar.gz
#Nagios插件,用于存放脚本和命令
NSCP-0.5.0
#也就是Nsclient++,用来监控Windows,分为64位、32位版本
nrpe-2.15.tar.gz
#代理服务,用于监控非Nagios服务器的服务器本地私有信息代理
vautour_style.zip
#主题包
Nagios实验环境
部署Nagios监控服务器
部署之前,需要做好最基本的环境,包括LAP环境的构建(这里直接使用yum方式安装即可
解决依赖和安装LAP环境
Centos7安装epel源:
[root@Nagios ~]# yum install epel-release -y
刷新yum源
[root@Nagios ~]# yum clean all&&yum list
安装依赖
[root@Nagios ~]# yum install -y gcc glibc glibc-common php gd gd-devel libpng libmng libjpeg zlib
安装httpd服务
[root@Nagios ~]# yum install -y httpd
httpd服务启动并设置为开机自启动
[root@Nagios ~]# systemctl start httpd[root@Nagios ~]# systemctl enable httpd
创建Ngios运行用户
[root@Nagios ~]# useradd nagios#创建Nagios用户,不能使用nologin的shell nagios会用到[root@Nagios ~]# groupadd nagcmd#创建nagcmd组[root@Nagios ~]# usermod -G nagcmd apache#将apache和nagios用户都加入到此组[root@Nagios ~]# usermod -G nagcmd nagios
Nagios核心安装
将所需软件包都上传到服务器上
解压至指定路径
[root@Nagios ~]# tar -zxvf nagios-3.5.1.tar.gz -C usr/local/
编译安装
[root@Nagios ~]# cd usr/local/nagios[root@Nagios ~]# ./configure --with-command-group=nagcmd#指定用户组,看到如下提示信息*** Configuration summary for nagios 3.5.1 08-30-2013 ***:General Options:-------------------------Nagios executable: nagiosNagios user/group: nagios,nagios #运行用户Command user/group: nagios,nagcmd #运行用户组Embedded Perl: noEvent Broker: yesInstall ${prefix}: /usr/local/nagios #默认安装到了/usr/local/nagiosLock file: ${prefix}/var/nagios.lockCheck result directory: ${prefix}/var/spool/checkresultsInit directory: etc/rc.d/init.dApache conf.d directory: etc/httpd/conf.d #apache的默认配置文件目录Mail program: bin/mailHost OS: linux-gnuWeb Interface Options:------------------------HTML URL: http://localhost/nagios/ #登陆地址CGI URL: http://localhost/nagios/cgi-bin/Traceroute (used by WAP):Review the options above for accuracy. If they look okay,type 'make all' to compile the main program and CGIs.#根据上图提示,继续执行 make all[root@Nagios ~]# make all#出现如下提示信息*** Compile finished ***If the main program and CGIs compiled without any errors, youcan continue with installing Nagios as follows (type 'make'without any arguments for a list of all possible options):#按照以下提示继续安装make install- This installs the main program, CGIs, and HTML filesmake install-init- This installs the init script in etc/rc.d/init.dmake install-commandmode- This installs and configures permissions on thedirectory for holding the external command filemake install-config- This installs *SAMPLE* config files in usr/local/nagios/etcYou'll have to modify these sample files before you canuse Nagios. Read the HTML documentation for more infoon doing this. Pay particular attention to the docs onobject configuration files, as they determine what/howthings get monitored!make install-webconf- This installs the Apache config file for the Nagiosweb interfacemake install-exfoliation #主题相关,无需安装- This installs the Exfoliation theme for the Nagiosweb interfacemake install-classicui #主题相关,无需安装- This installs the classic theme for the Nagiosweb interface#根据上图提示,继续执行[root@Nagios ~]# make install[root@Nagios ~]# make install-init[root@Nagios ~]# make install-commandmode[root@Nagios ~]# make install-config[root@Nagios ~]# make install-webconf到此,安装完成
#安装的时候,make install生成的share目录,就是访问界面的目录
#在make install-init的时候,生成脚本启动
#在make install-的时config的时候,生成nagios配置文件#包括以后安装了plugin等软件后,配置文件也会放入此目录
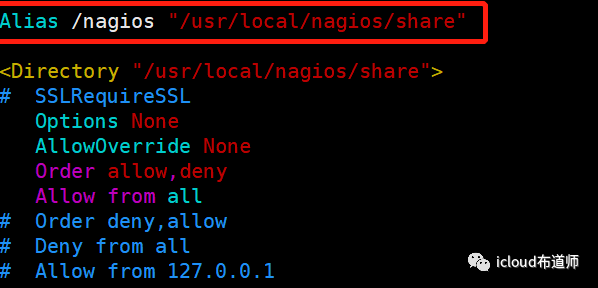
#在make install-webconf的时候,已经把web-conf的文件放入/etc/httpd/conf.d/下面了

#里面配置了一个别名,直接引用了/usr/local/nagios/share目录
#在make install-webconf的时候,已经把web-conf的文件放入/etc/httpd/conf.d/下面了


主目录配置文件解析
Nagios主目录
bin #Nagios执行程序所在目录etc #nagios配置文件所在目录,初始安装只有几个*.cfg文件libexec #监控所用命令,需要安装了nagios-plugins插件了才会有sbin #Nagios的Cgi文件所在目录,外部命令所需要的文件存放目录share #Nagios前端页面var #志文件,pid文件等
认识一下nagios的配置文件
[root@Nagios nagios]# vim usr/local/nagios/etc/nagios.cfg*************************************************************og_file=/var/log/nagios/nagios.log #日志位置cfg_file=/etc/nagios/objects/commands.cfg #这个文件定义了很多命令cfg_file=/etc/nagios/objects/contacts.cfg #定义联系人,怎么联系cfg_file=/etc/nagios/objects/timeperiods.cfg #定义了时间段cfg_file=/etc/nagios/objects/templates.cfg #模板(联系人,主机,时间)cfg_file=/etc/nagios/objects/localhost.cfg #监控本机相关配置文件#cfg_file=/etc/nagios/objects/windows.cfg #windows,默认不监控#cfg_file=/etc/nagios/objects/switch.cfg #交换机路由器监控,默认不监控#cfg_file=/etc/nagios/objects/printer.cfg #打印机监控,默认不监控#cfg_dir=/etc/nagios/servers #定义了服务合集(多个使用)#cfg_dir=/etc/nagios/printers #定义了打印机合集(多个使用)#cfg_dir=/etc/nagios/switches #定义了交换合集(多个使用)#cfg_dir=/etc/nagios/routers #定义了路由合集(多个使用)resource_file=/etc/nagios/private/resource.cfg 资源变量配置文件,包括$USER1$变量status_update_interval=10 #状态更新时间,单位slog_rotation_method=d #日志滚动,默认天service_check_timeout=60 #服务检查超时时间host_check_timeout=30 #主机检查超时时间event_handler_timeout=30notification_timeout=30ocsp_timeout=5perfdata_timeout=5
[root@Nagios nagios]# vim usr/local/nagios/etc/cgi.cfg
//此配置文件比nagios.cfg优先级高
main_config_file= /usr/local/nagios/etc/nagios.cfg #主配置文件physical_html_path= usr/local/nagios/share #物理路径url_html_path=/nagios #在URL后面加上/nagios才能访问use_authentication=1 #使用认证use_ssl_authentication=0 #不使用sslauthorized_for_system_information=nagiosadmin #认证用户
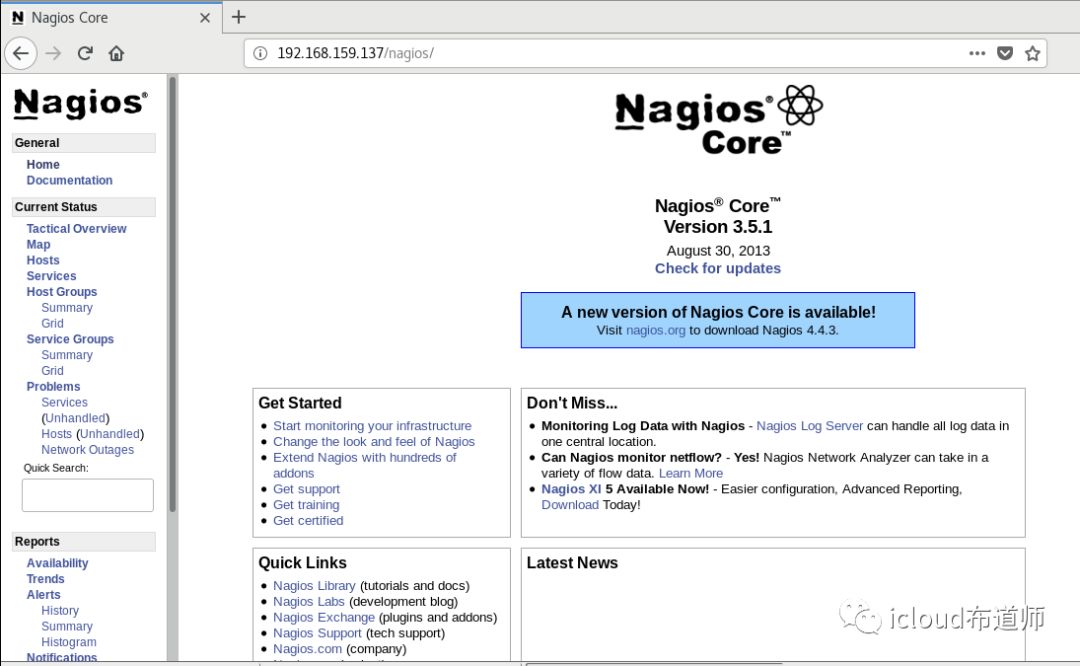
Nagios访问测试
[root@Nagios ~]# systemctl restart httpd
在浏览器访问
192.168.159/nagios
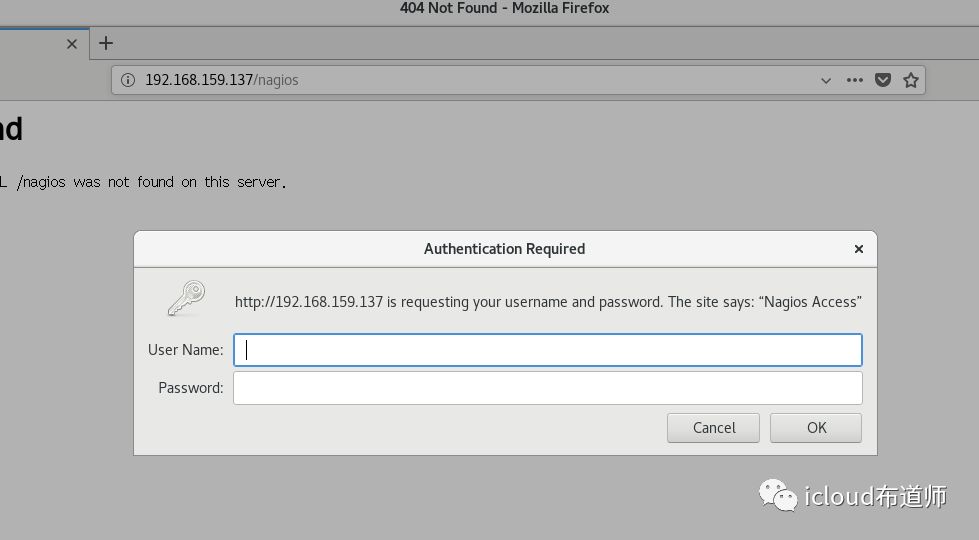
需要用户名和密码,查看配置文件
[root@Nagios ~]# vim etc/httpd/conf.d/nagios.conf在Directory字段里面有Auth这三个字段,那么就可以使用htpasswd来生成用
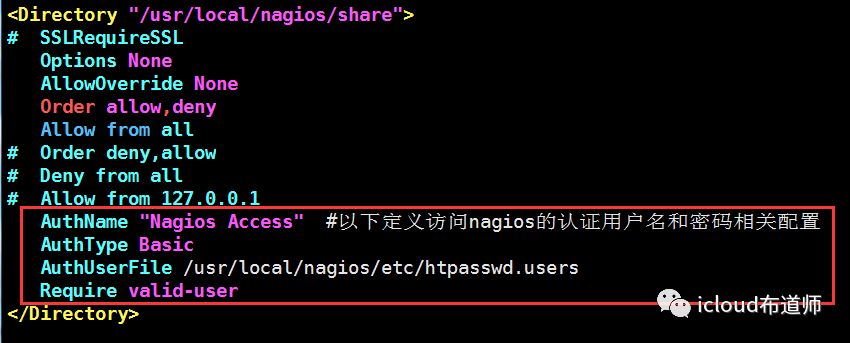
创建登陆用户
[root@Nagios ~]# htpasswd -c usr/local/nagios/etc/htpasswd.users nagiosadmin#注意!# -c表示创建,二次添加用户,不能使用-c参数
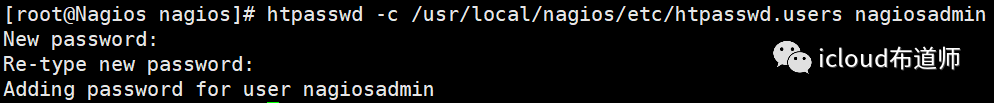
重启httpd服务
[root@Nagios ~]# systemctl restart httpd#再次测试(我创建用户名是nagiosadmin,密码123456)#nagios 默认使用nagiosadmin来管理,如果使用其他用户名,对应的配置文件
登陆成功
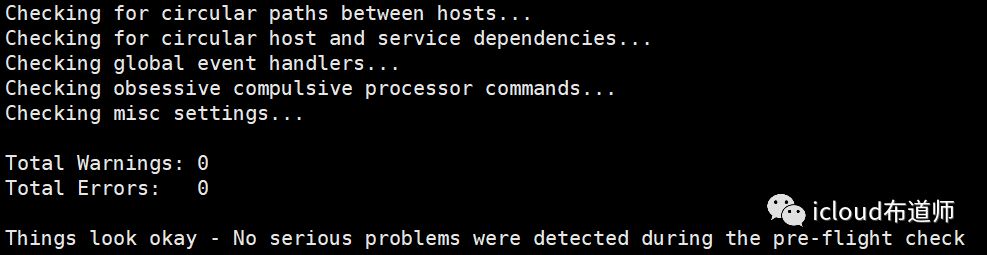
检查配置文件
在nagios的目录下,bin目录下有一个nagios命令,这个命令可以帮助我们对配置文件的检查工作以及指定相关配置文件
[root@Nagios ~]# /usr/local/nagios/bin/nagios -v usr/local/nagios/etc/nagios.cfg#看到两个0才是没有问题
启动nagios配置文件
[root@Nagios ~]# /usr/local/nagios/bin/nagios -d /usr/local/nagios/etc/nagios.cfg
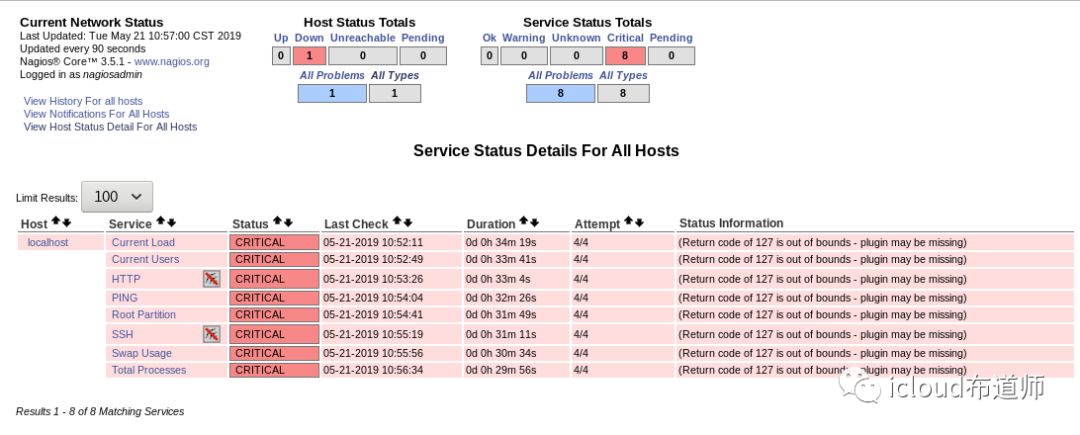
现在看services的监控都是掉的
主目录配Nagios-Plugins插件
先安装mysql开发包n
[root@Nagios ~]# yum install mariadb mariadb-devel -y
解压插件包
[root@Nagios ~]# tar -zxvf nagios-plugins-2.1.1.tar.gz -C usr/local/[root@Nagios ~]# cd usr/local/nagios-plugins-2.1.1/[root@Nagios ~]# ./configure --with-nagios-user=nagios --with-nagios-group=nagcmd
编译安装
[root@Nagios ~]# make && make install#安装完成之后放在了/usr/local/Nagios/libexec下面[root@Nagios ~]# cd usr/local/nagios/libexec[root@Nagios ~]# ll#可以看到已经有非常多的插件命令
[root@Nagios libexec]# ll总用量 6704-rwxr-xr-x. 1 nagios nagcmd 205600 5月 21 11:10 check_apt-rwxr-xr-x. 1 nagios nagcmd 2309 5月 21 11:10 check_breeze-rwxr-xr-x. 1 nagios nagcmd 209688 5月 21 11:10 check_by_sshlrwxrwxrwx. 1 root root 9 5月 21 11:10 check_clamd -> check_tcp-rwxr-xr-x. 1 nagios nagcmd 154552 5月 21 11:10 check_cluster-r-sr-xr-x. 1 root nagcmd 207296 5月 21 11:10 check_dhcp-rwxr-xr-x. 1 nagios nagcmd 224608 5月 21 11:10 check_disk-rwxr-xr-x. 1 nagios nagcmd 9348 5月 21 11:10 check_disk_smb-rwxr-xr-x. 1 nagios nagcmd 118568 5月 21 11:10 check_dummy-rwxr-xr-x. 1 nagios nagcmd 3542 5月 21 11:10 check_file_age-rwxr-xr-x. 1 nagios nagcmd 6375 5月 21 11:10 check_flexlmlrwxrwxrwx. 1 root root 9 5月 21 11:10 check_ftp -> check_tcp-rwxr-xr-x. 1 nagios nagcmd 348344 5月 21 11:10 check_http-r-sr-xr-x. 1 root nagcmd 218976 5月 21 11:10 check_icmp-rwxr-xr-x. 1 nagios nagcmd 165480 5月 21 11:10 check_ide_smart-rwxr-xr-x. 1 nagios nagcmd 15238 5月 21 11:10 check_ifoperstatus-rwxr-xr-x. 1 nagios nagcmd 13386 5月 21 11:10 check_ifstatuslrwxrwxrwx. 1 root root 9 5月 21 11:10 check_imap -> check_tcp-rwxr-xr-x. 1 nagios nagcmd 6947 5月 21 11:10 check_ircdlrwxrwxrwx. 1 root root 9 5月 21 11:10 check_jabber -> check_tcp-rwxr-xr-x. 1 nagios nagcmd 179064 5月 21 11:10 check_load-rwxr-xr-x. 1 nagios nagcmd 6595 5月 21 11:10 check_log-rwxr-xr-x. 1 nagios nagcmd 22730 5月 21 11:10 check_mailq-rwxr-xr-x. 1 nagios nagcmd 164696 5月 21 11:10 check_mrtg-rwxr-xr-x. 1 nagios nagcmd 166064 5月 21 11:10 check_mrtgtraf-rwxr-xr-x. 1 nagios nagcmd 200792 5月 21 11:10 check_mysql-rwxr-xr-x. 1 nagios nagcmd 187168 5月 21 11:10 check_mysql_query-rwxr-xr-x. 1 nagios nagcmd 182024 5月 21 11:10 check_nagioslrwxrwxrwx. 1 root root 9 5月 21 11:10 check_nntp -> check_tcplrwxrwxrwx. 1 root root 9 5月 21 11:10 check_nntps -> check_tcp-rwxr-xr-x. 1 nagios nagcmd 211016 5月 21 11:10 check_nt-rwxr-xr-x. 1 nagios nagcmd 214240 5月 21 11:10 check_ntp-rwxr-xr-x. 1 nagios nagcmd 203440 5月 21 11:10 check_ntp_peer-rwxr-xr-x. 1 nagios nagcmd 198640 5月 21 11:10 check_ntp_time-rwxr-xr-x. 1 nagios nagcmd 245560 5月 21 11:10 check_nwstat-rwxr-xr-x. 1 nagios nagcmd 8926 5月 21 11:10 check_oracle-rwxr-xr-x. 1 nagios nagcmd 184184 5月 21 11:10 check_overcr-rwxr-xr-x. 1 nagios nagcmd 214296 5月 21 11:10 check_pinglrwxrwxrwx. 1 root root 9 5月 21 11:10 check_pop -> check_tcp-rwxr-xr-x. 1 nagios nagcmd 215592 5月 21 11:10 check_procs-rwxr-xr-x. 1 nagios nagcmd 180920 5月 21 11:10 check_real-rwxr-xr-x. 1 nagios nagcmd 9642 5月 21 11:10 check_rpc-rwxr-xr-x. 1 nagios nagcmd 1465 5月 21 11:10 check_sensorslrwxrwxrwx. 1 root root 9 5月 21 11:10 check_simap -> check_tcp-rwxr-xr-x. 1 nagios nagcmd 272336 5月 21 11:10 check_smtplrwxrwxrwx. 1 root root 9 5月 21 11:10 check_spop -> check_tcp-rwxr-xr-x. 1 nagios nagcmd 180472 5月 21 11:10 check_sshlrwxrwxrwx. 1 root root 9 5月 21 11:10 check_ssmtp -> check_tcp-rwxr-xr-x. 1 nagios nagcmd 162432 5月 21 11:10 check_swap-rwxr-xr-x. 1 nagios nagcmd 257904 5月 21 11:10 check_tcp-rwxr-xr-x. 1 nagios nagcmd 182184 5月 21 11:10 check_timelrwxrwxrwx. 1 root root 9 5月 21 11:10 check_udp -> check_tcp-rwxr-xr-x. 1 nagios nagcmd 194752 5月 21 11:10 check_ups-rwxr-xr-x. 1 nagios nagcmd 154976 5月 21 11:10 check_uptime-rwxr-xr-x. 1 nagios nagcmd 153664 5月 21 11:10 check_users-rwxr-xr-x. 1 nagios nagcmd 2995 5月 21 11:10 check_wave-rwxr-xr-x. 1 nagios nagcmd 149104 5月 21 11:10 negate-rwxr-xr-x. 1 nagios nagcmd 146736 5月 21 11:10 urlize-rwxr-xr-x. 1 nagios nagcmd 1931 5月 21 11:10 utils.pm-rwxr-xr-x. 1 nagios nagcmd 2791 5月 21 11:10 utils.sh
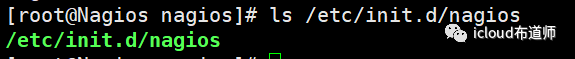
启动Nagios服务,检查环境
[root@Nagios ~]# systemctl restart httpd[root@Nagios ~]# /etc/init.d/nagios restart#可以看到已经检测成功
Nagios监控本服务器
配置监控之前,我们需要做一系列的准备工作:
(指定主配置文件需要加载的配置文件—定义主机—定义服务 –定义监控命令—检查配置文件—启动Nagios)
监控本地NFS服务器
Nagios本地安装nfs服务
[root@Nagios ~]# yum install nfs-utils -y[root@Nagios ~]# cd /usr/local/nagios/etc/objects[root@Nagios ~]# cp localhost.cfg localhost.bak#备份配置文件[root@Nagios ~]# vim localhost.cfg
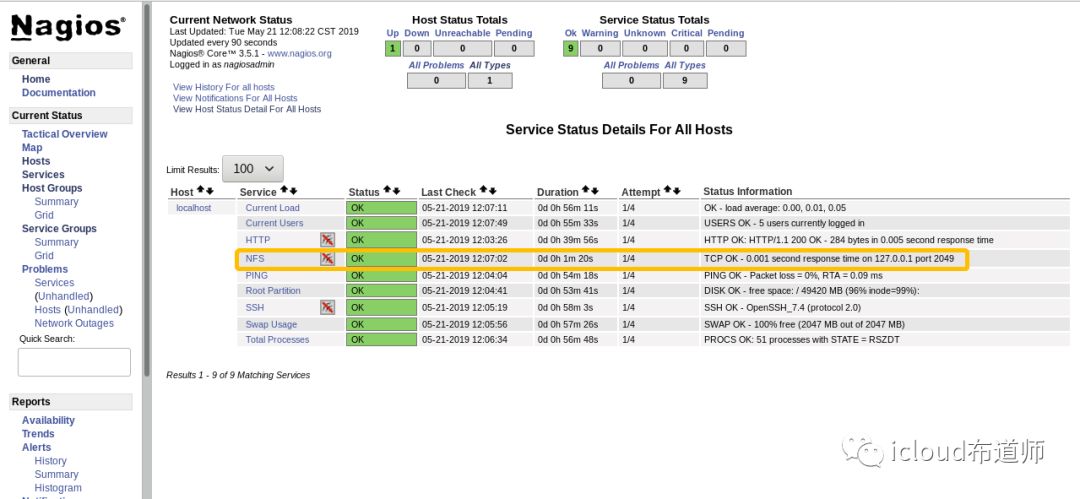
#nfsdefine service{use local-service ; Name of service template to usehost_name localhostservice_description NFScheck_command check_tcp!2049notifications_enabled 0}#在使用check命令之前,要确保下/usr/local/nagios/libexec/ 目录下有没有你需要的check命令,如果有,直接调用,如果没有,检测端口来代替,检测格式: check_tcp!端口号
[root@Nagios ~]# vim etc/exports #创建nfs服务 /tmp *(rw)
[root@Nagios ~]# systemctl restart nfs #重启nfs服务 [root@Nagios ~]# showmount -e 192.168.159.137Export list for 192.168.159.137:/tmp *
/dateserver * #可以看到nfs服务搭建成功 [root@Nagios ~]#ln -s usr/local/nagios/bin/nagios bin/nagios#创建软连接
检测配置文件是否有误
[root@Nagios ~]# nagios -v usr/local/nagios/etc/nagios.cfgChecking misc settings...Total Warnings: 0Total Errors: 0 #配置文件没有问题
重启nagios服务
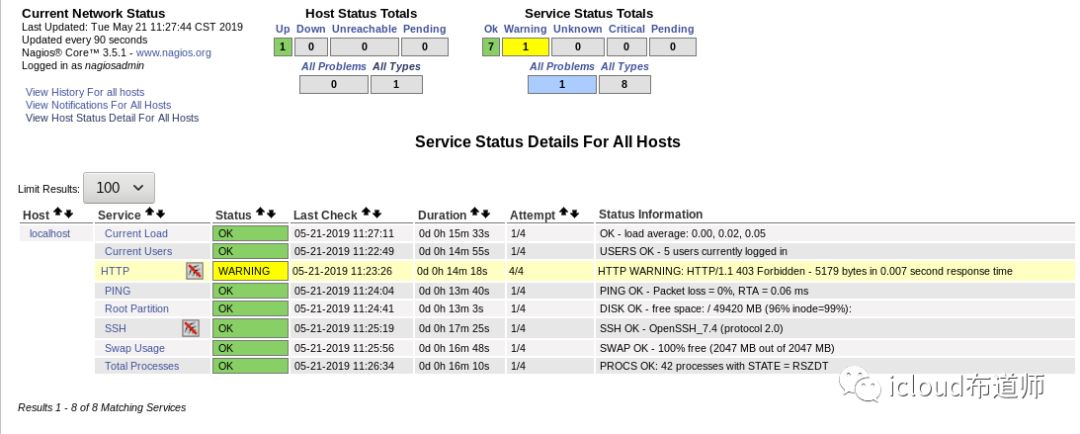
[root@Nagios ~]# systemctl restart nagios#查看监控页面
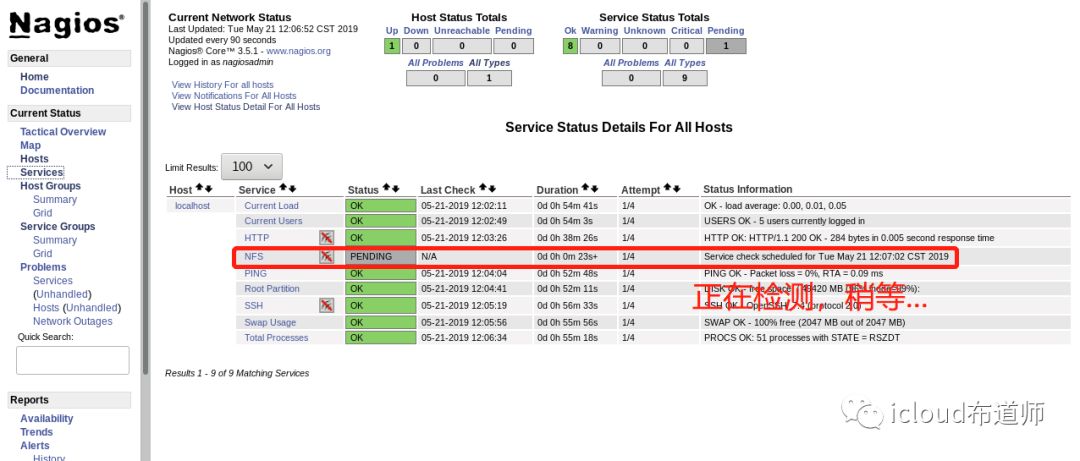
稍微一等...
停止NFS服务再观察
[root@Nagios ~]# systemctl stop nfs
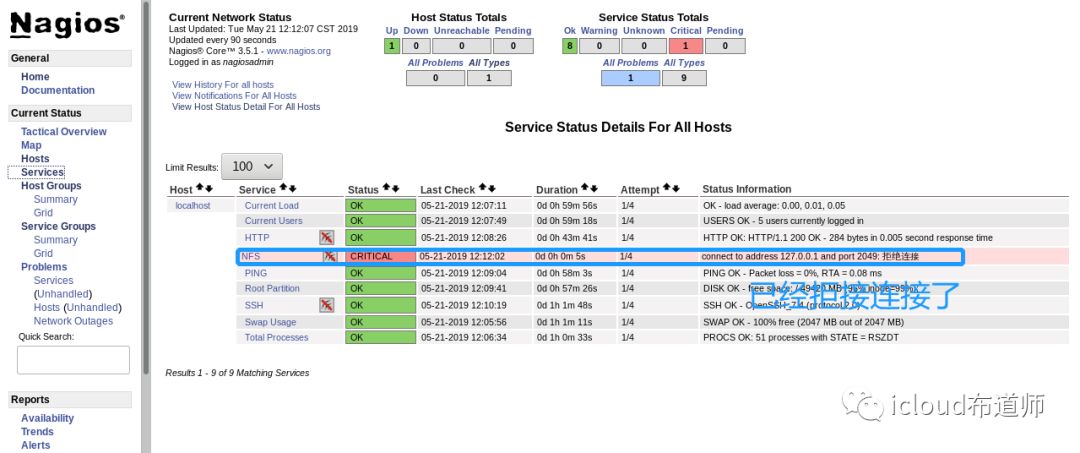
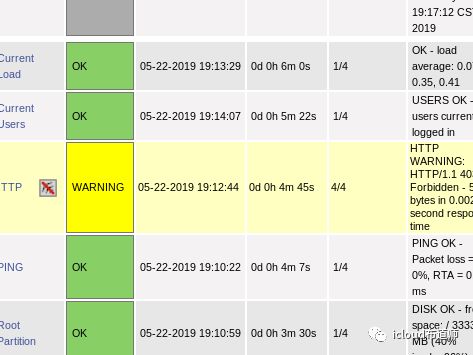
可以看到状态了,一般状态有四种颜色,如下图:

监控远程MySQL
监控任何一台服务器,工作流程是定义主机,定义服务,定义命令
[root@Server ~]# yum install mariadb mariadb-server -y #安装数据库[root@Server ~]# systemctl start mariadb[root@Server ~]# systemctl enable mariadb[root@Server ~]# mysql_secure_installation[root@Server ~]# mysql -uroot -p123 -e"create database test;"[root@Server ~]# mysql -uroot -p123MariaDB [(none)]>grant select on *.* to nagios@'192.168.159.%' identified by '123';MariaDB [(none)]> \qBye
配置Nagios服务
#打开配置文件[root@Nagios ~]# vim usr/local/nagios/etc/nagios.cfg# Definitions for monitoring the local (Linux) hostcfg_file=/usr/local/nagios/etc/objects/localhost.cfg#在下面添加:cfg_file=/usr/local/nagios/etc/objects/hosts.cfgcfg_file=/usr/local/nagios/etc/objects/services.cfg#创建hosts.cfg文件:#注释掉localhost.cfg!!!很重要[root@Nagios ~]# vim usr/local/nagios/etc/objects/hosts.cfg
define host{use linux-server #使用的模板名字host_name server.cn #主机名address 192.168.159.138 #IP地址}
#创建services.cfg文件:[root@Nagios ~]# vim /usr/local/nagios/etc/objects/services.cfg
define service{use local-servicehost_name server.cnservice_description MySqlSevcheck_command check_mysql}
#修改commands.cfg文件:[root@Nagios ~]#vim /usr/local/nagios/etc/objects/commands.cfg
# check_mysqldefine command{command_name check_mysqlcommand_line $USRE1$/check_mysql -H $HOSTADDRESS$ -u nagios -p123456 -d nagios}
在本地测试命令是否报错
[root@Server ~]# /usr/local/nagios/libexec/check_mysql -H192.168.159.138 -unagios -p123 -d test#看到以下信息:
Uptime: 3428 Threads: 1 Questions: 32 Slow queries: 0 Opens: 1 Flush tables: 2 Open tables: 27 Queries per second avg: 0.009|Connections=15c;;; Open_files=23;;; Open_tables=27;;; Qcache_free_memory=0;;; Qcache_hits=0c;;; Qcache_inserts=0c;;; Qcache_lowmem_prunes=0c;;; Qcache_not_cached=0c;;; Qcache_queries_in_cache=0;;; Queries=33c;;; Questions=32c;;; Table_locks_waited=0c;;; Threads_connected=1;;; Threads_running=1;;; Uptime=3428c;;;
注意:所有的check_command字段中的所使用的命令,必须在command.cfg中定义好才能使用,而command.cfg中的command_line中使用的命令,必须在/usr/local/Nagios/libexec/目录下存在,安装plugins会生成
注意:服务器要安装了mysql客户端软件,然后再重新编译安装下plugins 才会生成check_mysql
kaway1
看下 监控测试
NRPE插件模式监控
NRPE插件
通过NRPE(一个插件)服务可以添加本地信息的监控,将数据发送到我们的Nagios服务器
nrpe工作原理
NRPE有两部分组成
check_nrpe插件:位于监控主机上
nrpe daemon:运行在远程主机上,通常是被监控端agent
注意:nrpe daemon需要Nagios-plugins插件的支持,否则daemon不能做任何监控
当Nagios需要监控某个远程Linux主机的服务或者资源情况时:
首先:Nagios会运行check_nrpe这个插件,告诉它要检查什么;
其次:check_nrpe插件会连接到远程的NRPE daemon,所用的方式是SSL;
然后:NRPE daemon 会运行相应的Nagios插件来执行检查;
最后:NRPE daemon 将检查的结果返回给check_nrpe 插件,插件将其递交给nagios做处理。
客户端安装NRPE
1:安装nagios- plugins插件
2:安装NRPE( make install-daemon-config make install-xinetd)
3:配置我们xinted服务,允许谁来拿数据
4:启动xinetd
5:查看端口是否正常启动
#解决依赖[root@Server ~]# yum install -y openssl openssl-devel
[root@Nagios ~]# yum install -y openssl openssl-devel#上传文件[root@Nagios ~]# scp nagios-plugins-2.1.1.tar.gz 192.168.159.138:~[root@Nagios ~]# scp nrpe-2.15.tar.gz 192.168.159.138:~#添加用户[root@Server ~]# useradd -s sbin/nologin nagios[root@Server ~]# groupadd nagcmd[root@Server ~]# usermod -G nagcmd nagios[root@Server ~]# yum install -y xinetd#解压至指定目录[root@Server ~]# tar xvf nagios-plugins-2.1.1.tar.gz -C /usr/local/src/[root@Server ~]# tar xvf nrpe-2.15.tar.gz -C /usr/local/src/[root@Server ~]# cd usr/local/src/nagios-plugins-2.1.1#开始编译安装nagios-plugins[root@Server nagios-plugins-2.1.1]# ./configure && make && make install[root@Server nagios-plugins-2.1.1]# cd ../nrpe-2.15/#开始编译安装nrpe[root@Server nrpe-2.15]# ./configure && make && make install[root@Server nrpe-2.15]# make install-daemon-config#这里是客户端,不需要make-install-plugin
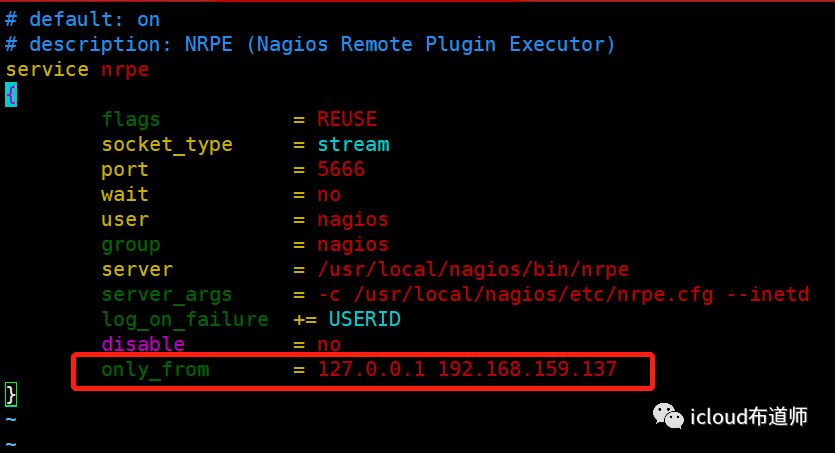
[root@Server nrpe-2.15]# make install-xinetd[root@Server ~]# vim etc/xinetd.d/nrpe#在最后的only_from添加nagios服务器的地址,如下图:
#端口注册[root@Server ~]# echo "nrpe 5666/tcp # NRPE" >> /etc/services
#/etc/services文件的作用:作用1:xinet.d来启动服务时他就会在/etc/services找相应服务对应的端口来启动服务。找不到对应端口,将不启动服务。作用2: 显示对应端口对应的协议名。例如 iptables -L 不加-n参数, 查看时,把 80转 -> www http作用3:查看常用端口
#启动xinetd服务[root@Server ~]# systemctl restart xinetd[root@Server ~]# systemctl enbale xinetd[root@Server ~]# netstat -antup | grep 5666

客户端nrpe命令
[root@Server ~]# vim /usr/local/nagios/etc/nrpe.cfg
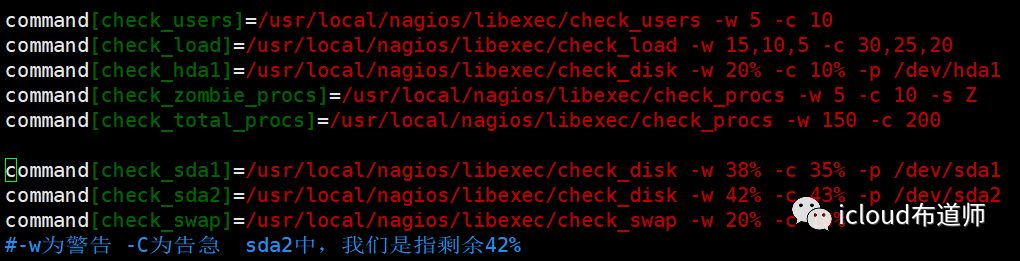
command[check_users]=/usr/local/nagios/libexec/check_users -w 5 -c 10command[check_load]=/usr/local/nagios/libexec/check_load -w 15,10,5 -c 30,25,20command[check_hda1]=/usr/local/nagios/libexec/check_disk -w 20% -c 10% -p /dev/hda1command[check_zombie_procs]=/usr/local/nagios/libexec/check_procs -w 5 -c 10 -s Zcommand[check_total_procs]=/usr/local/nagios/libexec/check_procs -w 150 -c 200command[check_sda1]=/usr/local/nagios/libexec/check_disk -w?38%?-c?35%?-p?/dev/sda1command[check_sda2]=/usr/local/nagios/libexec/check_disk -w?42%?-c?43%?-p?/dev/sda2command[check_swap]=/usr/local/nagios/libexec/check_swap -w?20%?-c?10%#-w为警告?-C为告急??sda2中,我们是指剩余42%
#重新启动xinetd服务[root@Server ~]# systemctl restart xinetd
监控端手动测试
[root@Nagios ~]# cd /usr/local/nagios/libexec/[root@Nagios libexec]# ./check_nrpe -H192.168.159.138NRPE v2.15[root@Nagios libexec]# /usr/local/nagios/libexec/check_nrpe -H192.168.159.138 -c check_sda1
DISK OK - free space: / 49486 MB (96% inode=99%); /dev 474 MB (100% inode=99%); /dev/shm 486 MB (100% inode=99%); /run 472 MB (97% inode=99%); /sys/fs/cgroup 486 MB (100% inode=99%); /boot 881 MB (86% inode=99%); /home 48064 MB (99% inode=99%); /run/user/0 97 MB (100% inode=99%);| /=1688MB;51175;;0;51175 /dev=0MB;474;;0;474 /dev/shm=0MB;486;;0;486 /run=13MB;486;;0;486 /sys/fs/cgroup=0MB;486;;0;486 /boot=132MB;1014;;0;1014 /home=32MB;48096;;0;48096 /run/user/0=0MB;97;;0;97
定义被监控主机
[root@Nagios libexec]# cd /usr/local/nagios/etc/objects[root@Nagios ~]# vim /usr/local/nagios/etc/objects/hosts.cfg
define host{use linux-serverhost_name 192.168.159.138address 192.168.159.138}
定义需要监控的服务
[root@Nagios objects]# vim services.cfg
define service{use generic-servicehost_name 192.168.159.138service_description mysqlcheck_command check_mysqlnotifications_enabled 1}define service{use local-servicehost_name 192.168.159.138service_description sda2_Partitioncheck_command check_nrpe!check_sda2notifications_enabled 1}define service{use local-servicehost_name 192.168.159.138service_description Total Processescheck_command check_nrpe!check_total_procsnotifications_enabled 1}define service{use local-servicehost_name 192.168.159.138service_description Current Loadcheck_command check_nrpe!check_loadnotifications_enabled 1}#分别是监测分区、进程总数、负载
定义NRPE监控命令
[root@Nagios objects]# vim commands.cfg
#check nrpedefine command{command_name check_nrpecommand_line $USER1$check_nrpe -H $HOSTADDRESS$ -c $ARG1$}
重启服务
#先定义一个软链接[root@Nagios objects]# ln -s /etc/init.d/nagios /bin#重新启动nagios服务[root@Nagios objects]# systemctl restart nagios#查看监控继续打开192.168.159.138/nagios/
补充:一站式告警管理系统:http://wiki.110monitor.com/
可以微信等工具告警,暂时不研究了。。。
被ngios折磨了三天...总算告一段落...不过对各种配置文件和报错算是非常熟悉了!
