


Photo by Martin Shreder on Unsplash
这是我2021年的第 2 篇文章
文章来自组内小伙伴刘洋,实际生产环境中遇到问题及排查过程。
背景
最近在做业务逻辑重构,pc、app等有类似的逻辑都写在了web层,导致新增各端保持一致的需求需要更改各自站点,增加了开发成本和维护成本,所以需要把通用逻辑抽离到业务逻辑层,web层通过rpc调用实现解耦。
问题现象
抽离出来的服务上线两周必现调用方超时,服务内部逻辑处理时间急剧增加,等待处理的请求等待时间急剧增加。如下图
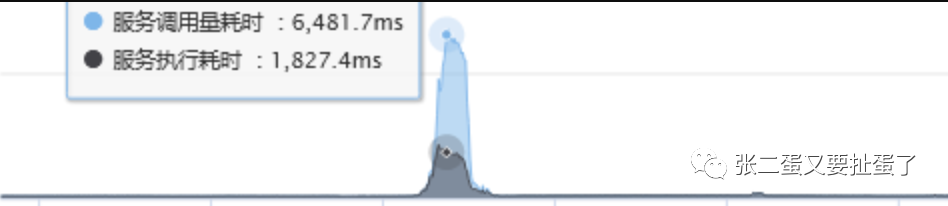
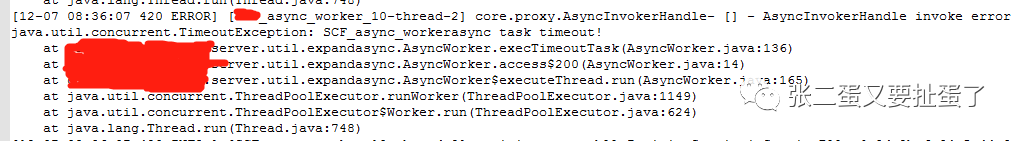
正常处理时间在100ms左右。查看日志,只能看到框架组件报待处理的请求等待超时。
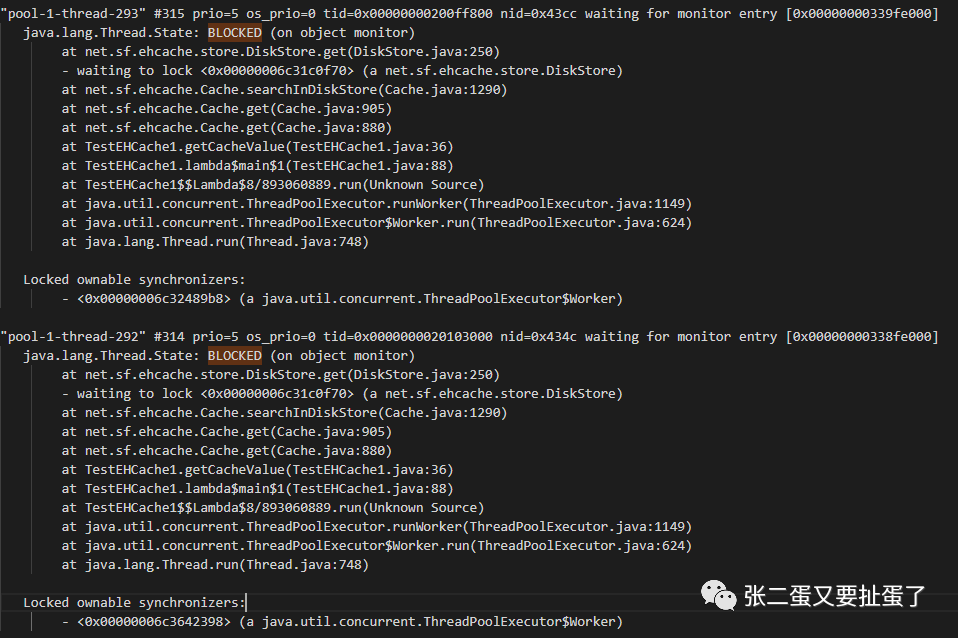
因为报的时间点是早高峰,又有大量客户反馈,情急之下立即重启机器,只留一台机器用于验证。 服务4台机器,重启三台后,耗时下降,抓取留下那台的线程堆栈,内存dump未发现异常信息。查看当时的调用量,确实有增长,但不是很多,考虑到服务内部调用了一个很耗时的外部接口,又没有分析到问题,增加了几台机器增加下服务整体的处理能力。 但是这件事由于没有找到具体原因,像是扎在胸口的一根刺,每天早高峰的时候都盯着屏幕,观察服务状态,随时准备见状不好立即重启。 就这样过了两周后,发现服务异常复现,由于一直盯着,立即抓取其中一台的内存dump,别的机器同时进行重启,等把这台机器的dump下载下来后,对这台也进行了重启。重启后服务正常,没有客诉,于是安下心来分析dump。 用Jvisual查看堆内存看不出什么问题,于是通过Jvisual通过dump得出的线程堆栈发现成堆的BLOCKED
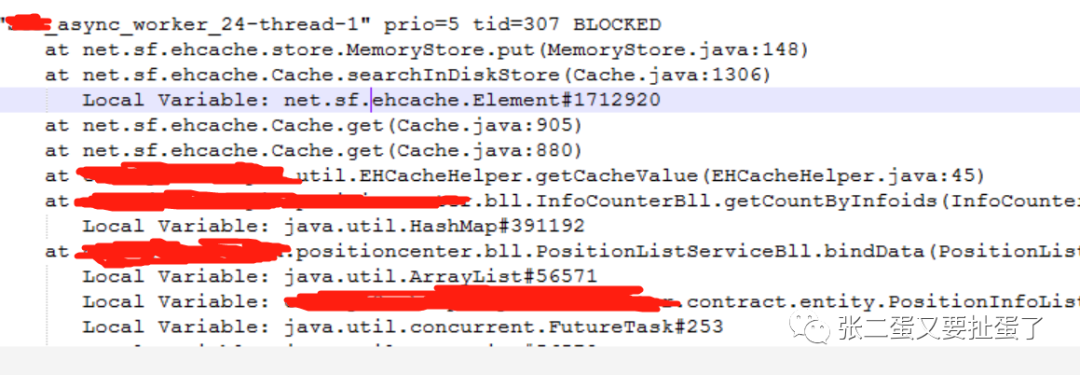
可以看到是获取缓存时ehcache内部锁等待。【ehcache版本1.6.2】那么为什么大家都在等呢,我们进去看MemoryStore 148行。
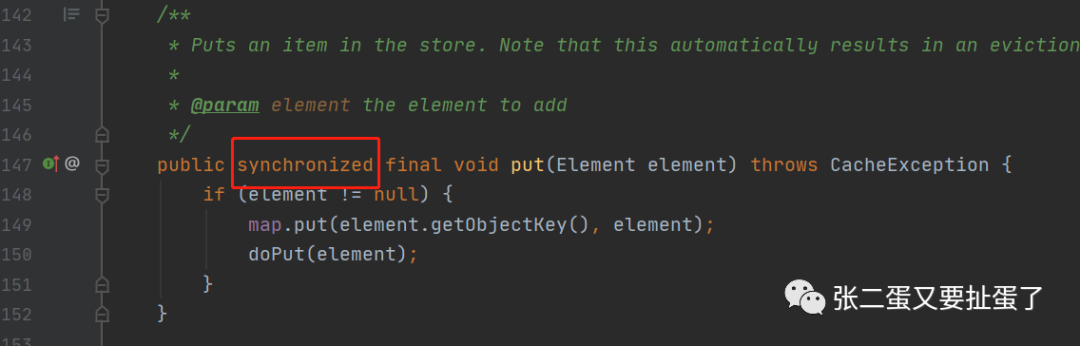
这个方法被synchronized修饰表示调用该对象方法的所有调用方都需要竞争该锁。【我们都知道使用被它修饰的方法在多线程下效率很低,此时我就想看看是否ehcache的高版本优化了这部分】那么我们put的时候有几个调用方呢。看Cache 1306行
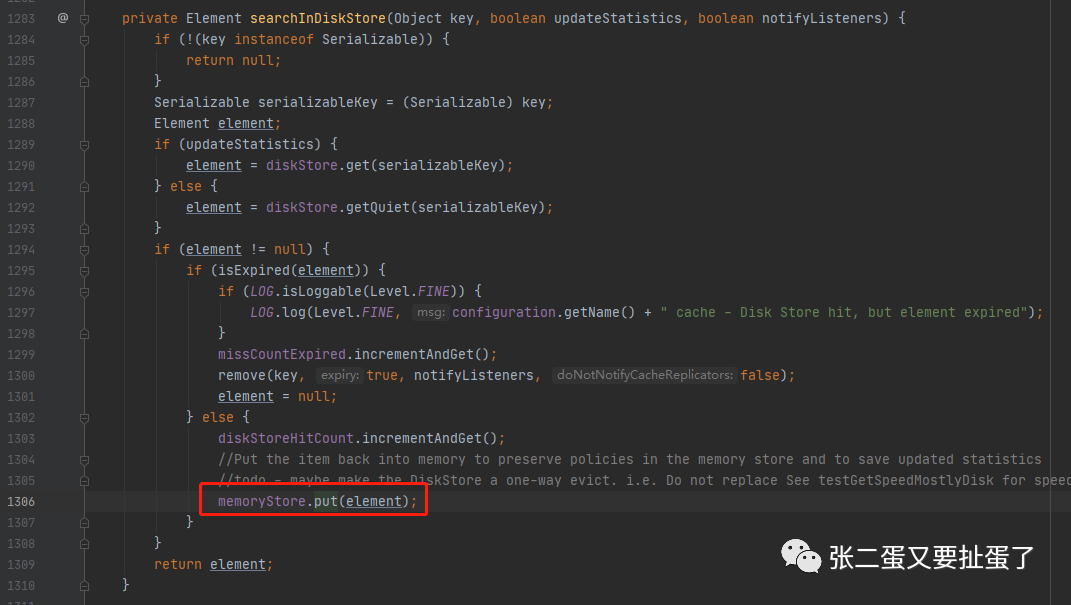
这段代码的逻辑就是从磁盘中读出数据,不为空、未过期就放回内存,memoryStore是Cache中的属性,他俩是一对一的。那么Cache有几个呢,用过ehcache大家就知道了每个cache对应配置文件中的一个cache,也就是说一个name一个cache。
巧了,我的服务里面大部分都用了longCache,那么put那块锁竞争就很激烈。 看了代码之后我们就清楚原因了 由于内存中存储的数据超过设置的maxElementsInMemory,且配置了overflowToDisk,则新增的数据会存储到磁盘,看BLOCK处都出现在从内存中获取不到数据在磁盘中获取到了,获取到之后再放到磁盘中。这就导致获取缓存和缓存数据都会竞争同一个锁。
DEMO复现
import net.sf.ehcache.Cache;import net.sf.ehcache.CacheManager;import net.sf.ehcache.Element;import java.io.InputStream;import java.util.concurrent.ArrayBlockingQueue;import java.util.concurrent.ConcurrentHashMap;import java.util.concurrent.Executor;import java.util.concurrent.ThreadPoolExecutor;import java.util.concurrent.TimeUnit;public class TestEHCache1 {private static CacheManager cm = null;private static ConcurrentHashMap<String, Cache> cacheTable = new ConcurrentHashMap<String, Cache>();public static void init() {final InputStream resourceAsStream = TestEHCache1.class.getClassLoader().getResourceAsStream("ehcache1.xml");cm = new CacheManager(resourceAsStream);String[] names = cm.getCacheNames();for (String s : names) {System.out.println("put:" + s);cacheTable.put(s.toLowerCase(), cm.getCache(s));}}private static Cache getCache(String cacheName) {return ((Cache) cacheTable.get(cacheName.toLowerCase()));}public static Object getCacheValue(String cacheName, String key) {try {Element element = getCache(cacheName).get(key);if (element != null) {return element.getObjectValue();}} catch (Exception e) {e.printStackTrace();}return null;}public static void setCacheValue(String cacheName, String key, Object value) {try {Element element = new Element(key, value);getCache(cacheName).put(element);} catch (Exception e) {e.printStackTrace();}}public static void main(String[] args) {init();setCacheValue("longCache", "test1", "value1");final Object cacheValue = getCacheValue("longCache", "test1");System.out.println(cacheValue);//给jvisual连接时间,获取线程dumptry {Thread.sleep(5000L);} catch (InterruptedException e) {e.printStackTrace();}Executor executor = new ThreadPoolExecutor(100, 320, 1000L, TimeUnit.MILLISECONDS, new ArrayBlockingQueue<Runnable>(5000));for (int i = 0; i < 100000; i++) {int finalI = i;try {executor.execute(() -> {long begin = System.currentTimeMillis();setCacheValue("longCache", "test_INFODO_DAFASDFAFEWFEWF" + finalI, "value" + finalI);System.out.println("put cost:" + (System.currentTimeMillis() - begin));});} catch (Exception e) {e.printStackTrace();}}for (int i = 0; i < 100000; i++) {int finalI = i;try {executor.execute(() -> {long beginTime = System.currentTimeMillis();final Object longCache = getCacheValue("longCache", "test_INFODO_DAFASDFAFEWFEWF" + finalI);System.out.println(longCache + " cost:" + (System.currentTimeMillis() - beginTime));});} catch (Exception e) {e.printStackTrace();}}}}
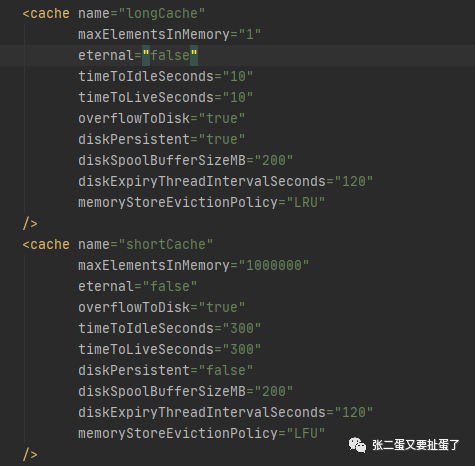
ehcache1.x配置
<?xml version="1.0" encoding="UTF-8"?><ehcache maxBytesLocalHeap="1K" maxBytesLocalOffHeap="0M" maxBytesLocalDisk="1M"><diskStore path=""/><cache name="longCache"<!--调成1,使得数据立刻存入磁盘-->maxElementsInMemory="1"eternal="false"timeToIdleSeconds="10"timeToLiveSeconds="10"overflowToDisk="true"diskPersistent="true"diskSpoolBufferSizeMB="200"diskExpiryThreadIntervalSeconds="120"memoryStoreEvictionPolicy="LRU"></ehcache>
打印耗时
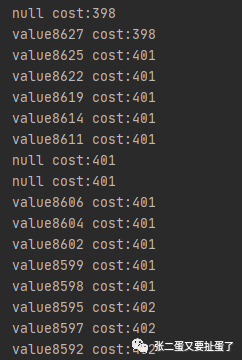
可以看到耗时在400ms左右 查看线程dump,问题复现。
修复方案
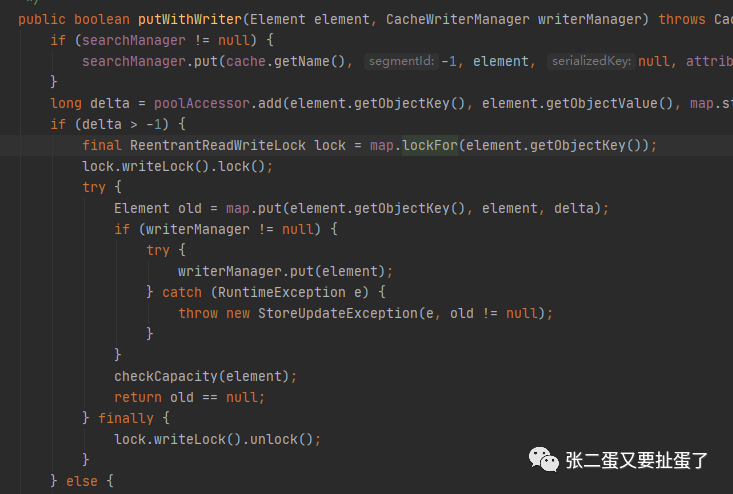
服务在此处缓存是为了降低对第三方调用,缓存到内存中的缓存数目后对第三方服务的压力没有很大,没必要再落到磁盘,且服务也不必须启动时从磁盘中读取缓存数据,所以把overflowToDisk设置为false可以解决。但是方法的同步效率不高,在查看高版本代码后,发现它优化了这部分代码【下图】,测试后在大量数据存取效率明显高于1.x版本。
由于3.x版本改动量较大,调用方式,配置文件都有很大差别,不是向下兼容的,最后比较下使用了2.x版本相对改动较小。且我们知道同一个cache名字下的数据使用同一锁,新版本的话粒度相对于1.x粒度变得很小,但是不同业务使用同一个cache也存在效率上的问题
最后改动方案
ehcache升级到2.10.6 新增cache用于该业务 ehcache最终配置如下
<?xml version="1.0" encoding="UTF-8"?><ehcache xmlns:xsi="http://www.w3.org/2001/XMLSchema-instance"xsi:noNamespaceSchemaLocation="ehcache.xsd" updateCheck="true"maxBytesLocalHeap = "800M"dynamicConfig="true"><sizeOfPolicy maxDepth="100000" maxDepthExceededBehavior="abort" ><diskStore path="java.io.tmpdir"/><defaultCacheeternal="false"timeToIdleSeconds="180"timeToLiveSeconds="180"overflowToDisk="false"diskPersistent="false"diskSpoolBufferSizeMB="50"diskExpiryThreadIntervalSeconds="120"memoryStoreEvictionPolicy="LRU"/><cache name="longCache"eternal="false"timeToIdleSeconds="3600"timeToLiveSeconds="3600"overflowToDisk="false"diskPersistent="false"diskSpoolBufferSizeMB="200"diskExpiryThreadIntervalSeconds="120"memoryStoreEvictionPolicy="LRU"/><cache name="bizXXCache"eternal="false"timeToIdleSeconds="1800"timeToLiveSeconds="1800"overflowToDisk="false"diskPersistent="false"diskSpoolBufferSizeMB="200"diskExpiryThreadIntervalSeconds="120"memoryStoreEvictionPolicy="LRU"/><cache name="shortCache"eternal="false"overflowToDisk="false"timeToIdleSeconds="300"timeToLiveSeconds="300"diskPersistent="false"diskSpoolBufferSizeMB="200"diskExpiryThreadIntervalSeconds="120"memoryStoreEvictionPolicy="LFU"/><cache name="maxCache"eternal="false"timeToIdleSeconds="86400"timeToLiveSeconds="86400"overflowToDisk="false"diskPersistent="false"diskSpoolBufferSizeMB="100"diskExpiryThreadIntervalSeconds="120"memoryStoreEvictionPolicy="LRU"/></ehcache>
上线后已平稳运行20多天,问题解决。
后记
其实在第一次出问题时,我们如果获取当时的线程dump就能够分析出问题,但是在报警和客诉的压力下,快速重启恢复导致问题再次出现,也告诉我们如果一个没有找到问题的问题还会再次出现问题。
