ELK/EFK日志系统
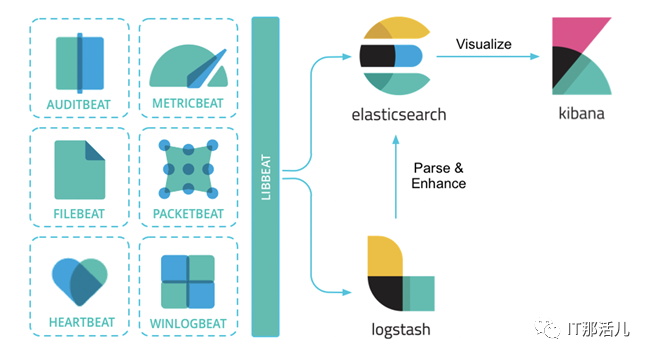
提到日志系统,一般首先想到的都是经典的ELK架构,或者现在被称为Elastic Stack。Elastic Stack架构为Elasticsearch + Logstash + Kibana + Beats的组合,其中,Beats负责日志的采集, Logstash负责做日志的聚合和处理,Elasticsearch作为日志的存储和搜索系统,Kibana作为可视化前端展示,整体架构如下图所示:
此外,在容器化场景中,尤其是在Kubernetes环境中,用户经常使用的另一套框架是EFK架构。其中,E还是Elasticsearch,K还是Kibana,其中的F代表Fluent Bit,一个开源多平台的日志处理器和转发器。Fluent Bit可以让用户从不同的来源收集数据/日志,统一并发送到多个目的地,并且它完全兼容Docker和Kubernetes环境。

PLG日志系统
但是,Grafana Labs提供的另一个日志解决方案PLG目前也逐渐变得流行起来。PLG架构为Promtail + Loki + Grafana的组合,整体架构图下所示:
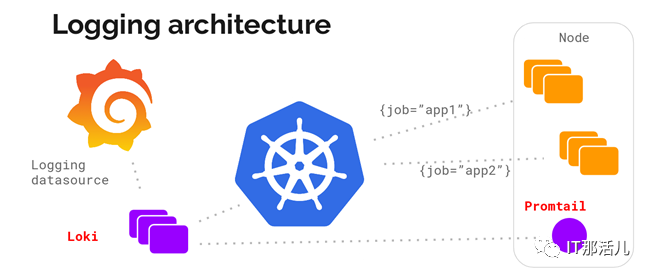
其中,Grafana大家应该都比较熟悉,它是一款开源的可视化和分析软件,它允许用户查询、可视化、警告和探索监控指标。Grafana主要提供时间序列数据的仪表板解决方案,支持超过数十种数据源(还在陆续添加支持中)。
这里稍微介绍下另外两个软件Promtail和Loki。官方介绍Grafana Loki是一组可以组成一个功能齐全的日志堆栈组件,与其它日志系统不同的是,Loki只建立日志标签的索引而不索引原始日志消息,而是为日志数据设置一组标签,这意味着Loki的运营成本更低,效率也能提高几个数量级。
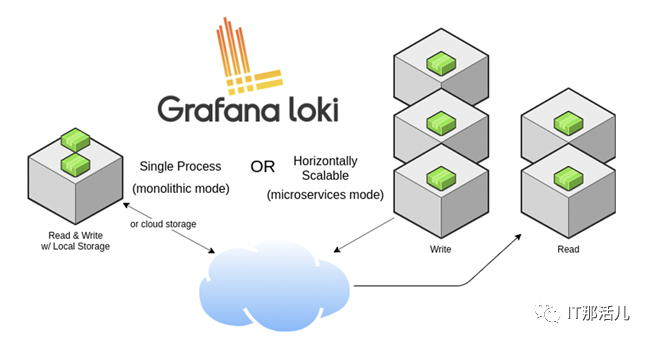
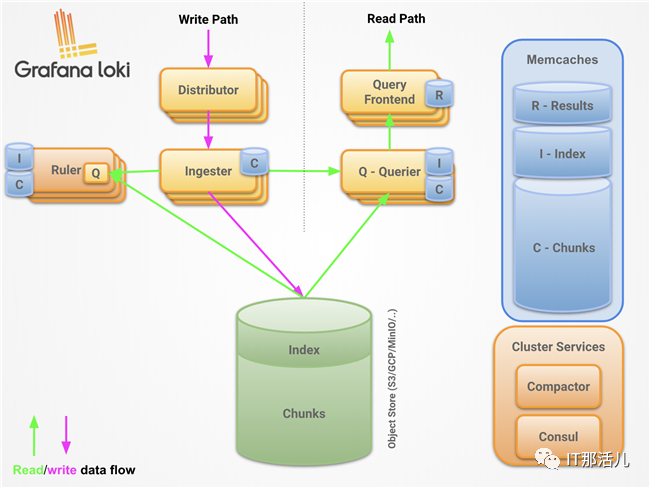
Loki的设计理念收到了很多Prometheus的启发,可以实现可水平扩展、高可用的多租户日志系统。Loki整体架构也是由不同的组件来协同完成日志收集、索引、存储等工作的,各个组件如下所示,有关Loki架构的更多信息这里不再展开描述,可以参考官方文档Loki’s Architecture进一步深入了解。最后,一句话形容下Loki就是like Prometheus, but for logs。
Promtail是一个日志收集的代理,它会将本地日志的内容发送到一个Loki实例,它通常部署到需要监视应用程序的每台机器/容器上。Promtail主要是用来发现目标、将标签附加到日志流以及将日志推送到Loki。截止到目前,Promtail可以跟踪两个来源的日志:本地日志文件和systemd日志(仅支持AMD64架构)。
这样看上去,PLG和ELK都能完成类似的日志管理工作,那它们之间的差别在哪里呢?
日志方案对比
首先,ELK/EFK架构功能确实强大,也经过了多年的实际环境验证,其中存储在Elasticsearch中的日志通常以非结构化JSON对象的形式存储在磁盘上,并且Elasticsearch为每个对象都建立了索引,以便进行全文搜索,然后用户可以特定查询语言来搜索这些日志数据。与之对应的Loki的数据存储是解耦的,既可以在磁盘上存储数据,也可以使用如Amazon S3的云存储系统。Loki中的日志带有一组标签名和值,其中只有标签对被索引,这种权衡使得它比完整索引的操作成本更低,但是针对基于内容的查询,需要通过LogQL再单独查询。
和Fluentd相比,Promtail是专门为Loki量身定制的,它可以为运行在同一节点上的Kubernetes Pods做服务发现,从指定文件夹读取日志。Loki采用了类似于Prometheus的标签方式。因此,当与Prometheus部署在同一个环境中时,因为相同的服务发现机制,来自Promtail的日志通常具有与应用程序指标相同的标签,统一了标签管理。
Kibana提供了许多可视化工具来进行数据分析,高级功能比如异常检测等机器学习功能。Grafana专门针对Prometheus和Loki等时间序列数据打造,可以在同一个仪表板上查看日志的指标。
部署解决方案
在EKS上部署Promtail + Loki + Grafana解决方案
接下来,我们将演示如何在EKS上部署Promtail + Loki + Grafana组合,下面演示需要有满足一些前提条件:
一个正常运行的EKS集群
可以执行kubectl命令行的环境
可以执行helm命令行的环境
演示环境如下:
EKS集群版本19.8
EKS集群为2个托管节点
Helm版本5.1
1. 部署Promtail + Loki + Grafana
首先,添加helm的repo信息。
$ helm repo add grafana https://grafana.github.io/helm-charts
然后,更新helm repo。
$ helm repo update
更新完成后,使用helm安装loki和grafana。默认情况下,Loki和Grafana都是安装在default命名空间的,可以添加 –namespace <命名空间> 参数将Loki和Grafana部署在指定的命名空间,这里演示创建一个新的命名空间loki,并将Loki和Grafana都安装在这里。其中grafana.enabled=true选项可以将Grafana一起进行部署,如果希望同时安装Prometheus,则也可以选择配置prometheus.enabled=true参数,演示中并未开启此参数。
$ kubectl create namespace loki$ helm upgrade --install loki --namespace=loki grafana/loki-stack --set grafana.enabled=truePowerShell
正常安装会返回以下输出结果:
BindingNAME: lokiLAST DEPLOYED: Thu May 13 12:38:52 2021NAMESPACE: lokiSTATUS: deployedREVISION: 1NOTES:The Loki stack has been deployed to your cluster. Loki can now be added as a datasource in Grafana.
See http://docs.grafana.org/features/datasources/loki/ for more detail.
部署完成后,我们来检查下使用helm部署的资源情况:
$ kubectl -n loki get allNAME READY STATUS RESTARTS AGEpod/loki-0 1/1 Running 0 113spod/loki-grafana-b664d6c4f-qlg87 1/1 Running 0 113spod/loki-promtail-jm8x8 1/1 Running 0 113spod/loki-promtail-lb8jq 1/1 Running 0 113sNAME TYPE CLUSTER-IP EXTERNAL-IP PORT(S) AGEservice/loki ClusterIP 10.100.52.51 <none> 3100/TCP 114sservice/loki-grafana ClusterIP 10.100.134.81 <none> 80/TCP 114sservice/loki-headless ClusterIP None <none> 3100/TCP 114sNAME DESIRED CURRENT READY UP-TO-DATE AVAILABLE NODE SELECTOR AGEdaemonset.apps/loki-promtail 2 2 2 2 2 <none> 114sNAME READY UP-TO-DATE AVAILABLE AGEdeployment.apps/loki-grafana 1/1 1 1 114sNAME DESIRED CURRENT READY AGEreplicaset.apps/loki-grafana-b664d6c4f 1 1 1 114sNAME READY AGEstatefulset.apps/loki 1/1 114s
可以看到通过Helm部署后自动完成了Promtail + Loki + Grafana组合的安装,其中Promtail部署模式为daemonset,在每个计算节点上都有部署,来收集节点以及Pod上的日志信息,具体配置如下所示:
$ kubectl describe ds loki-promtail -n lokiName: loki-promtailSelector: app=promtail,release=lokiNode-Selector: <none>Labels: app=promtail app.kubernetes.io/managed-by=Helm chart=promtail-2.2.0 heritage=Helm release=lokiAnnotations: deprecated.daemonset.template.generation: 1 meta.helm.sh/release-name: loki meta.helm.sh/release-namespace: lokiDesired Number of Nodes Scheduled: 2Current Number of Nodes Scheduled: 2Number of Nodes Scheduled with Up-to-date Pods: 2Number of Nodes Scheduled with Available Pods: 2Number of Nodes Misscheduled: 0Pods Status: 2 Running 0 Waiting 0 Succeeded 0 FailedPod Template: Labels: app=promtail release=loki Annotations: checksum/config: 8c87a13d751c87f1b8726a725bffbe18c827c5e60d4a7aea47cd4871ea8271f3 prometheus.io/port: http-metrics prometheus.io/scrape: true Service Account: loki-promtail Containers: promtail: Image: grafana/promtail:2.1.0 Port: 3101/TCP Host Port: 0/TCP Args: -config.file=/etc/promtail/promtail.yaml -client.url=http://loki:3100/loki/api/v1/push Readiness: http-get http://:http-metrics/ready delay=10s timeout=1s period=10s #success=1 #failure=5 Environment: HOSTNAME: (v1:spec.nodeName) Mounts: /etc/promtail from config (rw) /run/promtail from run (rw) /var/lib/docker/containers from docker (ro) /var/log/pods from pods (ro) Volumes: config: Type: ConfigMap (a volume populated by a ConfigMap) Name: loki-promtail Optional: false run: Type: HostPath (bare host directory volume) Path: run/promtail HostPathType: docker: Type: HostPath (bare host directory volume) Path: /var/lib/docker/containers HostPathType: pods: Type: HostPath (bare host directory volume) Path: /var/log/pods HostPathType: Events: Type Reason Age From Message ---- ------ ---- ---- ------- Normal SuccessfulCreate 14m daemonset-controller Created pod: loki-promtail-lb8jq Normal SuccessfulCreate 14m daemonset-controller Created pod: loki-promtail-jm8x8
Loki本身默认是通过statefulset的方式部署,这是为了避免在数据摄入组件崩溃时丢失索引,因此官方建议将Loki通过statefulset运行,并使用持久化存储来存储索引文件,具体配置如下所示:
$ kubectl describe deployment loki-grafana -n lokiName: loki-grafanaNamespace: lokiCreationTimestamp: Thu, 13 May 2021 12:38:53 +0000Labels: app.kubernetes.io/instance=loki app.kubernetes.io/managed-by=Helm app.kubernetes.io/name=grafana app.kubernetes.io/version=6.7.0 helm.sh/chart=grafana-5.7.10Annotations: deployment.kubernetes.io/revision: 1 meta.helm.sh/release-name: loki meta.helm.sh/release-namespace: lokiSelector: app.kubernetes.io/instance=loki,app.kubernetes.io/name=grafanaReplicas: 1 desired | 1 updated | 1 total | 1 available | 0 unavailableStrategyType: RollingUpdateMinReadySeconds: 0RollingUpdateStrategy: 25% max unavailable, 25% max surgePod Template: Labels: app.kubernetes.io/instance=loki app.kubernetes.io/name=grafana Annotations: checksum/config: 19aac1c3228c4f4807da30538c8541c01e6b17fa3b518f80ab4f400621bb175c checksum/dashboards-json-config: 01ba4719c80b6fe911b091a7c05124b64eeece964e09c058ef8f9805daca546b checksum/sc-dashboard-provider-config: 01ba4719c80b6fe911b091a7c05124b64eeece964e09c058ef8f9805daca546b checksum/secret: 416bf8ba1672c41e905574cab63bd1f658e30bc29309dcb7e68effdfbcb989f6 Service Account: loki-grafana Init Containers: grafana-sc-datasources: Image: kiwigrid/k8s-sidecar:0.1.209 Port: <none> Host Port: <none> Environment: METHOD: LIST LABEL: grafana_datasource FOLDER: /etc/grafana/provisioning/datasources RESOURCE: both Mounts: /etc/grafana/provisioning/datasources from sc-datasources-volume (rw) Containers: grafana: Image: grafana/grafana:6.7.0 Ports: 80/TCP, 3000/TCP Host Ports: 0/TCP, 0/TCP Liveness: http-get http://:3000/api/health delay=60s timeout=30s period=10s #success=1 #failure=10 Readiness: http-get http://:3000/api/health delay=0s timeout=1s period=10s #success=1 #failure=3 Environment: GF_SECURITY_ADMIN_USER: <set to the key 'admin-user' in secret 'loki-grafana'> Optional: false GF_SECURITY_ADMIN_PASSWORD: <set to the key 'admin-password' in secret 'loki-grafana'> Optional: false Mounts: /etc/grafana/grafana.ini from config (rw,path="grafana.ini") /etc/grafana/provisioning/datasources from sc-datasources-volume (rw) /var/lib/grafana from storage (rw) Volumes: config: Type: ConfigMap (a volume populated by a ConfigMap) Name: loki-grafana Optional: false storage: Type: EmptyDir (a temporary directory that shares a pod's lifetime) Medium: SizeLimit: <unset> sc-datasources-volume: Type: EmptyDir (a temporary directory that shares a pod's lifetime) Medium: SizeLimit: <unset>Conditions: Type Status Reason ---- ------ ------ Available True MinimumReplicasAvailable Progressing True NewReplicaSetAvailableOldReplicaSets: loki-grafana-b664d6c4f (1/1 replicas created)NewReplicaSet: <none>Events: Type Reason Age From Message ---- ------ ---- ---- ------- Normal ScalingReplicaSet 16m deployment-controller Scaled up replica set loki-grafana-b664d6c4f to 1
最后Grafana是通过deployment来完成的,具体配置如下所示:
$ kubectl describe deployment loki-grafana -n lokiName: loki-grafanaNamespace: lokiCreationTimestamp: Thu, 13 May 2021 12:38:53 +0000Labels: app.kubernetes.io/instance=loki app.kubernetes.io/managed-by=Helm app.kubernetes.io/name=grafana app.kubernetes.io/version=6.7.0 helm.sh/chart=grafana-5.7.10Annotations: deployment.kubernetes.io/revision: 1 meta.helm.sh/release-name: loki meta.helm.sh/release-namespace: lokiSelector: app.kubernetes.io/instance=loki,app.kubernetes.io/name=grafanaReplicas: 1 desired | 1 updated | 1 total | 1 available | 0 unavailableStrategyType: RollingUpdateMinReadySeconds: 0RollingUpdateStrategy: 25% max unavailable, 25% max surgePod Template: Labels: app.kubernetes.io/instance=loki app.kubernetes.io/name=grafana Annotations: checksum/config: 19aac1c3228c4f4807da30538c8541c01e6b17fa3b518f80ab4f400621bb175c checksum/dashboards-json-config: 01ba4719c80b6fe911b091a7c05124b64eeece964e09c058ef8f9805daca546b checksum/sc-dashboard-provider-config: 01ba4719c80b6fe911b091a7c05124b64eeece964e09c058ef8f9805daca546b checksum/secret: 416bf8ba1672c41e905574cab63bd1f658e30bc29309dcb7e68effdfbcb989f6 Service Account: loki-grafana Init Containers: grafana-sc-datasources: Image: kiwigrid/k8s-sidecar:0.1.209 Port: <none> Host Port: <none> Environment: METHOD: LIST LABEL: grafana_datasource FOLDER: /etc/grafana/provisioning/datasources RESOURCE: both Mounts: /etc/grafana/provisioning/datasources from sc-datasources-volume (rw) Containers: grafana: Image: grafana/grafana:6.7.0 Ports: 80/TCP, 3000/TCP Host Ports: 0/TCP, 0/TCP Liveness: http-get http://:3000/api/health delay=60s timeout=30s period=10s #success=1 #failure=10 Readiness: http-get http://:3000/api/health delay=0s timeout=1s period=10s #success=1 #failure=3 Environment: GF_SECURITY_ADMIN_USER: <set to the key 'admin-user' in secret 'loki-grafana'> Optional: false GF_SECURITY_ADMIN_PASSWORD: <set to the key 'admin-password' in secret 'loki-grafana'> Optional: false Mounts: /etc/grafana/grafana.ini from config (rw,path="grafana.ini") /etc/grafana/provisioning/datasources from sc-datasources-volume (rw) /var/lib/grafana from storage (rw) Volumes: config: Type: ConfigMap (a volume populated by a ConfigMap) Name: loki-grafana Optional: false storage: Type: EmptyDir (a temporary directory that shares a pod's lifetime) Medium: SizeLimit: <unset> sc-datasources-volume: Type: EmptyDir (a temporary directory that shares a pod's lifetime) Medium: SizeLimit: <unset>Conditions: Type Status Reason ---- ------ ------ Available True MinimumReplicasAvailable Progressing True NewReplicaSetAvailableOldReplicaSets: loki-grafana-b664d6c4f (1/1 replicas created)NewReplicaSet: <none>Events: Type Reason Age From Message ---- ------ ---- ---- ------- Normal ScalingReplicaSet 16m deployment-controller Scaled up replica set loki-grafana-b664d6c4f to 1
接下来,访问Grafana UI界面来查看部署结果。首先,通过以下命令获取Grafana管理员的密码:
$ kubectl get secret --namespace loki loki-grafana -o jsonpath="{.data.admin-password}" | base64 --decode ; echo
然后通过以下命令转发Grafana的接口,以便通过Web UI进行访问。默认情况下,端口转发的地址localhost,可以根据kubectl所在实例的情况补充设置–address <IP地址>。
$ kubectl port-forward --namespace loki service/loki-grafana 3000:80
打开localhost:3000或者<IP地址>:3000来查看Grafana,登录过程输入用户名admin和上面获得到的密码。
成功登录后可以正常进入到Grafana首页,如下图所示。
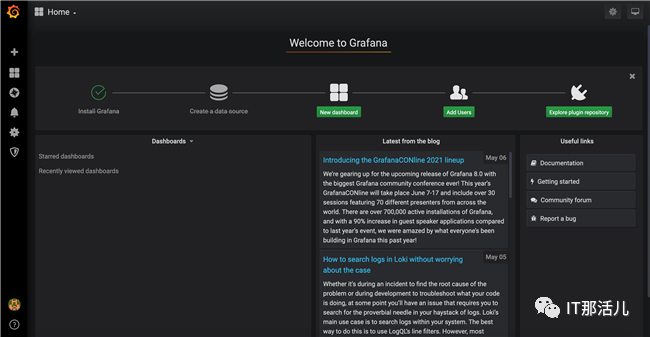
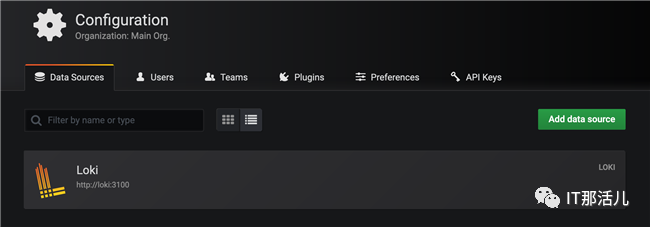
默认Loki数据源(http://loki:3100)已经添加进去了。
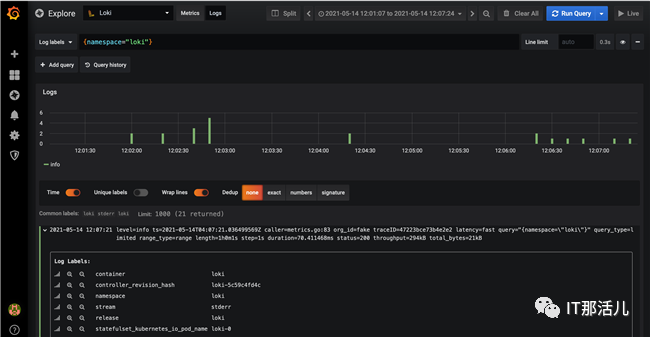
在Grafana侧边栏选择Explore进行快速日志查看,进入到Explore页面后选择Loki数据源,然后选择Logs标签,最后在Logs Labels中输入标签的查询条件,例如{namespace=”loki”},执行查询后就可以看到类似下图中的日志信息。
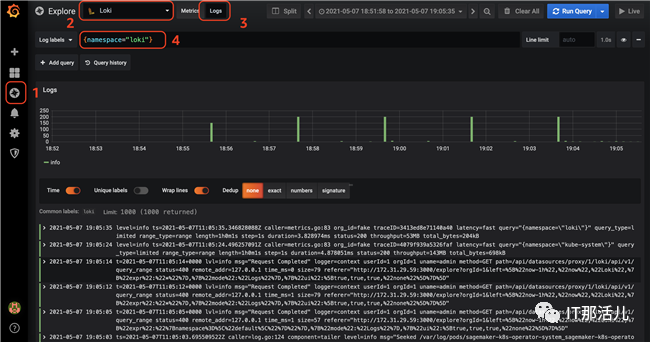
上面的日志信息是通过默认部署的Daemon Set的Promtail收集到的日志。
默认情况下,Loki的索引存储是通过boltdb-shipper来实现的,关于boltdb-shipper的更多信息请参考官方文档Single Store Loki (boltdb-shipper index type)。这些配置是通过secret(内容为loki.yaml的详细配置)挂载到Pod中的,查看Loki配置文件的默认值:
$ kubectl get secrets loki -n loki -o "jsonpath={.data['loki\.yaml']}" | base64 -dauth_enabled: falsechunk_store_config: max_look_back_period: 0scompactor: shared_store: filesystem working_directory: /data/loki/boltdb-shipper-compactoringester: chunk_block_size: 262144 chunk_idle_period: 3m chunk_retain_period: 1m lifecycler: ring: kvstore: store: inmemory replication_factor: 1 max_transfer_retries: 0limits_config: enforce_metric_name: false reject_old_samples: true reject_old_samples_max_age: 168hschema_config: configs: - from: "2020-10-24" index: period: 24h prefix: index_ object_store: filesystem schema: v11 store: boltdb-shipperserver: http_listen_port: 3100storage_config: boltdb_shipper: active_index_directory: /data/loki/boltdb-shipper-active cache_location: /data/loki/boltdb-shipper-cache cache_ttl: 24h shared_store: filesystem filesystem: directory: /data/loki/chunkstable_manager: retention_deletes_enabled: false retention_period: 0s
其中store: boltdb-shipper和object_store: filesystem分别指定了使用boltdb-shipper和文件系统来作为索引和日志文件的存储,这些都需要额外的维护,因为Loki实现了计算存储分离,所以这里可以充分借助云上的资源来减轻运维管理的负担,在亚马逊云平台上可以使用Amazon DynamoDB作为索引实现快速的键值存储的读写,使用Amazon S3作为日志存储实现大规模日志存储,同时也具备极高的存储性价比,下面将演示这些内容的配置。
2. 使用DynamoDB作为索引,S3作为日志存储
首先,节点要操作DynamoDB和S3就需要有足够的IAM权限:
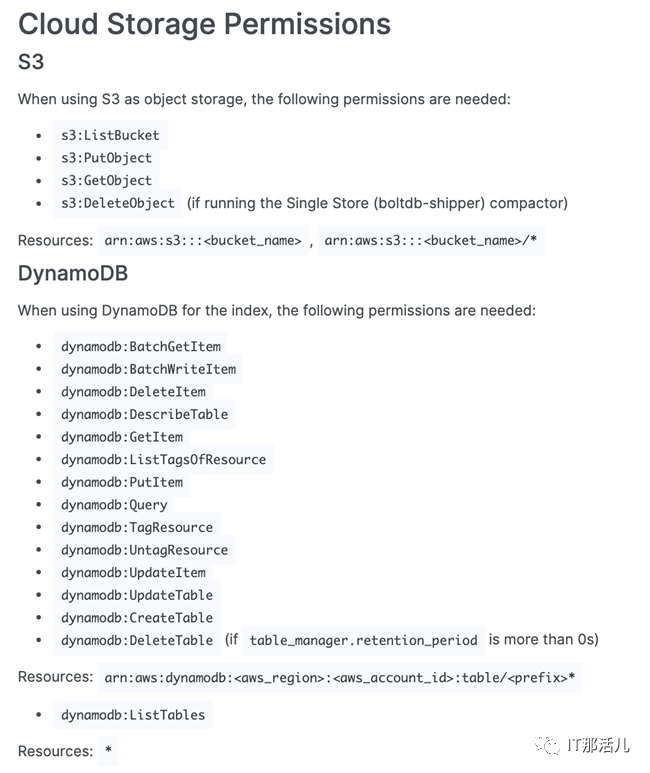
具体权限请参考官方文档Loki Storage为EKS的节点配置相应权限。
接下来,要想真正使用DynamoDB作为Loki的索引存储、S3作为日志存储,需要配置loki.yaml文件,这里可以修改secret文件,也可以配置新的configmap来挂载到Pod上。无论采用哪一种方式,主要的修改内容为schema_config和storage_config,具体配置如下所示:
schema_config: configs: - from: "2020-10-24" index: period: 0 prefix: loki_index object_store: s3 schema: v11 store: awsserver: http_listen_port: 3100storage_config: aws: s3: s3://us-east-1/loki-shtian dynamodb: dynamodb_url: dynamodb://us-east-1
其中,schema_config 中的store: aws设置指定索引存储,object_store: s3设置指定日志存储,需要注意的是period的值需要设置为0,否则Loki将会为每个时间段的日志都创建出单独的索引表,设置为0可以保证只有一个DynamaDB表被创建出来,存储所有索引信息。prefix为我们指定的DynamoDB表的名称。
存储配置storage_config中分别填写了DynamaDB和S3的相关信息,这里的S3存储桶以之前创建的loki-shtian为例,请根据实际情况进行调整,示例选择的区域以美东区(us-east-1)为例。其他配置保持默认不变。
完成上述配置编写后,前文提到既可以通过修改secret对象loki来生效,也可以使用configmap单独配置挂载,这里以更新secrets对象为例,通过以下命令更新secret对象(假设当前路径下有配置好的loki.yaml文件):
$ kubectl -n loki create secret generic loki --from-file=./loki.yaml -o yaml --dry-run=client | kubectl apply -f -
PowerShell
之后,通过以下命令重启statefulset中的Pod:
$ kubectl -n loki rollout restart statefulset loki
查看Pod日志信息,如下所示,可以看到Loki会自动创建DynamoDB表loki_index,并按照默认的参数配置DynamoDB的WCU(1000)和RCU值(300),这些都可以参考官方文档Configuring Loki进行定制化配置。
$ kubectl -n loki logs -f loki-0level=info ts=2021-05-13T15:17:41.673886077Z caller=table_manager.go:476 msg="creating table" table=loki_indexlevel=info ts=2021-05-13T15:19:41.603526262Z caller=table_manager.go:324 msg="synching tables" expected_tables=1level=info ts=2021-05-13T15:19:42.627187815Z caller=table_manager.go:531 msg="provisioned throughput on table, skipping" table=loki_index read=300 write=1000level=info ts=2021-05-13T15:21:41.603525185Z caller=table_manager.go:324 msg="synching tables" expected_tables=1level=info ts=2021-05-13T15:21:42.623189111Z caller=table_manager.go:531 msg="provisioned throughput on table, skipping" table=loki_index read=300 write=1000
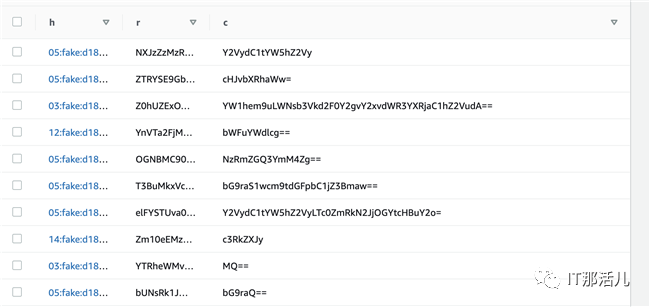
关于DynamaDB和S3的配置示例可以参考官方文档Loki Configuration Examples,详细的配置信息可以参考官方文档Configuring Loki。配置后的DynamoDB表使用h作为分区键,使用r作为排序键,如下图所示:

根据日志中的信息可以看到DynamoDB的WCU和RCU值配置为1000和300,如下图所示:

DynamoDB表使用c 作为索引的内容列,如下图所示:
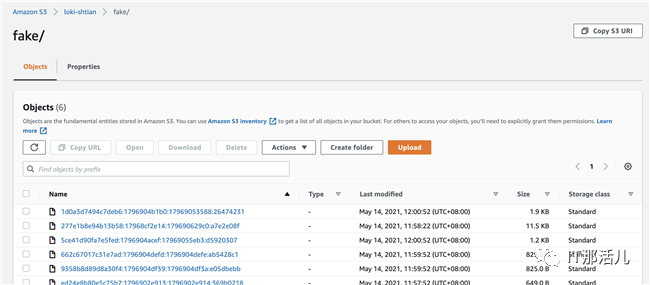
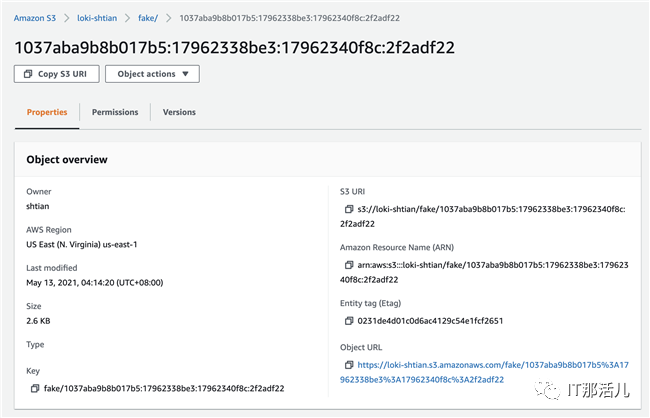
查看S3中的日志数据,如下图所示:
再次查看Grafana界面,查询日志信息一切正常运行。
小结:
本文首先简单介绍了经典的日志系统ELK/EFK架构,引出了Grafana新推出的PLG架构,并探讨了两种架构之间的对比和重点发展的方向。然后,本文介绍了在亚马逊云平台的EKS服务上部署Promtail + Loki + Grafana解决方案,以及配置使用Amazon DynamoDB和Amazon S3,以充分借助云服务的高性价比优势,降低用户维护管理成本。

更多精彩干货分享
点击下方名片关注
IT那活儿