推荐一个超好用的python包folium, 专门用于地理数据可视化,官方英文教程教程点击这里,查看本文源代码请点击这里。
folium:https://pypi.org/project/folium/
英文教程:https://python-visualization.github.io/folium/quickstart.html
源代码:https://python-visualization.github.io/folium/quickstart.html
使用方法很简单,操作如下:
1.导入包,创建一副世界地图
import folium
import pandas as pd
In [2]:
# define the world map
world_map = folium.Map()
# display world mapworld_map
2. 输入经纬度,尺度,在这里我们以旧金山(37.7749° N, 122.4194° W)为例。
# San Francisco latitude and longitude values
latitude = 37.77
longitude = -122.42
# Create map and display it
san_map = folium.Map(location=[latitude, longitude], zoom_start=12)
# Display the map of San Francisco
san_map
更改地图显示,默认为'OpenStreetMap'风格,我们还可以选择'Stamen Terrain', 'Stamen Toner'等。
# Create map and display it
san_map = folium.Map(location=[latitude, longitude], zoom_start=12,tiles='Stamen Toner')3. 读取数据集(旧金山犯罪数据集)
# Read Dataset
cdata = pd.read_csv('https://cocl.us/sanfran_crime_dataset')
cdata.head()
4. 在地图上显示前200条犯罪数据
# get the first 200 crimes in the cdata
limit = 200
data = cdata.iloc[0:limit, :]
# Instantiate a feature group for the incidents in the dataframe
incidents = folium.map.FeatureGroup()
# Loop through the 200 crimes and add each to the incidents feature group
for lat, lng, in zip(cdata.Y, data.X):
incidents.add_child(
folium.CircleMarker(
[lat, lng],
radius=7, # define how big you want the circle markers to be
color='yellow',
fill=True,
fill_color='red',
fill_opacity=0.4
)
)
# Add incidents to map
san_map = folium.Map(location=[latitude, longitude], zoom_start=12)
san_map.add_child(incidents)
5. 添加地理标签
# add pop-up text to each marker on the map
latitudes = list(data.Y)
longitudes = list(data.X)
labels = list(data.Category)
for lat, lng, label in zip(latitudes, longitudes, labels):
folium.Marker([lat, lng], popup=label).add_to(san_map)
# add incidents to map
san_map.add_child(incidents)
6. 统计区域犯罪总数
from folium import plugins
# let's start again with a clean copy of the map of San Francisco
san_map = folium.Map(location = [latitude, longitude], zoom_start = 12)
# instantiate a mark cluster object for the incidents in the dataframe
incidents = plugins.MarkerCluster().add_to(san_map)
# loop through the dataframe and add each data point to the mark cluster
for lat, lng, label, in zip(data.Y, data.X, cdata.Category):
folium.Marker(
location=[lat, lng],
icon=None,
popup=label,
).add_to(incidents)
# add incidents to map
san_map.add_child(incidents)
7. 读取geojson文件,可视化旧金山市10个不同Neighborhood的边界
import json
import requests
url = 'https://cocl.us/sanfran_geojson'
san_geo = f'{url}'
san_map = folium.Map(location=[37.77, -122.4], zoom_start=12)
folium.GeoJson(
san_geo,
style_function=lambda feature: {
'fillColor': '#ffff00',
'color': 'black',
'weight': 2,
'dashArray': '5, 5'
}
).add_to(san_map)
#display map
san_map
8. 统计每个区域的犯罪事件数目
# Count crime numbers in each neighborhood
disdata = pd.DataFrame(cdata['PdDistrict'].value_counts())
disdata.reset_index(inplace=True)
disdata.rename(columns={'index':'Neighborhood','PdDistrict':'Count'},inplace=True)
disdata
9. 创建Choropleth Map (颜色深浅代表各区犯罪事件数目)
m = folium.Map(location=[37.77, -122.4], zoom_start=12)
folium.Choropleth(
geo_data=san_geo,
data=disdata,
columns=['Neighborhood','Count'],
key_on='feature.properties.DISTRICT',
#fill_color='red',
fill_color='YlOrRd',
fill_opacity=0.7,
line_opacity=0.2,
highlight=True,
legend_name='Crime Counts in San Francisco'
).add_to(m)
m
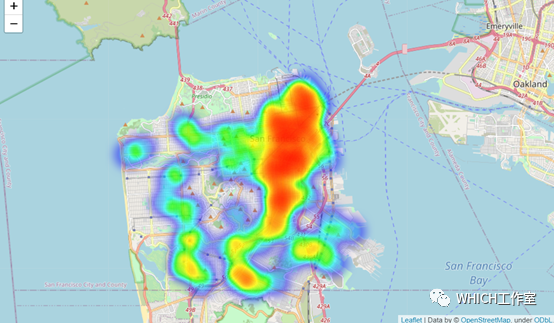
10. 创建热力图
from folium.plugins import HeatMap
# let's start again with a clean copy of the map of San Francisco
san_map = folium.Map(location = [latitude, longitude], zoom_start = 12)
# Convert data format
heatdata = data[['Y','X']].values.tolist()
# add incidents to map
HeatMap(heatdata).add_to(san_map)
san_map
本文源代码Jupyter notebook地址:https://nbviewer.jupyter.org/github/gaonanlee/Visualization-Practice/blob/master/Folium%20Visualization%20Examples.ipynb
GitHub下载地址:https://github.com/gaonanlee/Visualization-Practice/blob/master/Folium%20Visualization%20Examples.ipynb
最后,folium还可以用来创建动态热力图,动态路径图等,具体可参考Medium上的这篇文章。
https://towardsdatascience.com/data-101s-spatial-visualizations-and-analysis-in-python-with-folium-39730da2adf