


1 SkyWalking 简介
SkyWalking 是一个APM(应用程序性能监视器)系统,专门为微服务,云原生和基于容器(Docker,Kubernetes,Mesos)的体系结构而设计。
SkyWalking的功能包括对Cloud Native体系结构中的分布式系统的监视,跟踪,诊断功能。核心功能如下:
服务、服务实例、端点指标分析 根本原因分析,在运行时分析代码 服务拓扑图分析 服务、服务实例和端点依赖关系分析 检测慢速服务和端点 性能优化 分布式跟踪和上下文传播 数据库访问指标,检测慢速数据库访问语句(包括SQL语句) 报警 浏览器性能监控
详情可访问Github地址:https://github.com/apache/skywalking,本文将介绍如何在k8s环境中部署使用SkyWalking 8.3.0版本,实操,不要错过哦!
2 K8s部署
monitoring-nm.yaml
#创建namespace - monitoringapiVersion: v1kind: Namespacemetadata:name: monitoring
oap-serviceaccount.yaml
#创建SkyWalking相关的rbac权限#相关文件可查看https://github.com/apache/skywalking-kubernetes/tree/master/chart/skywalking/templates下的k8s配置apiVersion: v1kind: ServiceAccountmetadata:labels:app: skywalking-oap-serverrelease: 8.3.0name: skywalking-oap-servernamespace: monitoring---kind: RoleapiVersion: rbac.authorization.k8s.io/v1metadata:name: skywalking-oap-servernamespace: monitoringlabels:app: skywalking-oap-serverrelease: 8.3.0rules:- apiGroups: [""]resources: ["pods","configmaps"]verbs: ["get", "watch", "list"]---apiVersion: rbac.authorization.k8s.io/v1kind: ClusterRolemetadata:name: skywalking-oap-servernamespace: monitoringlabels:app: skywalking-oap-serverrelease: 8.3.0rules:- apiGroups: [""]resources: ["pods", "endpoints", "services"]verbs: ["get", "watch", "list"]- apiGroups: ["extensions"]resources: ["deployments", "replicasets"]verbs: ["get", "watch", "list"]---apiVersion: rbac.authorization.k8s.io/v1kind: RoleBindingmetadata:name: skywalking-oap-servernamespace: monitoringlabels:app: skywalking-oap-serverrelease: 8.3.0roleRef:apiGroup: rbac.authorization.k8s.iokind: Rolename: skywalking-oap-serversubjects:- kind: ServiceAccountname: skywalking-oap-servernamespace: monitoring---apiVersion: rbac.authorization.k8s.io/v1kind: ClusterRoleBindingmetadata:name: skywalking-oap-serverlabels:app: skywalking-oap-serverrelease: 8.3.0roleRef:apiGroup: rbac.authorization.k8s.iokind: ClusterRolename: skywalking-oap-serversubjects:- kind: ServiceAccountname: skywalking-oap-servernamespace: monitoring
alarm-settings-cmp.yaml
#创建SkyWalking的alarm-settings.yaml ConfigMap配置文件kind: ConfigMapapiVersion: v1metadata:name: alarm-settingsnamespace: monitoringdata:alarm-settings.yml: |rules:# Rule unique name, must be ended with `_rule`.#1.过去3分钟内服务平均响应时间超过1秒service_resp_time_rule:metrics-name: service_resp_timeop: ">"threshold: 1000period: 10count: 3silence-period: 60message: Response time of service {name} is more than 1000ms in 3 minutes of last 10 minutes.# 2.服务成功率在过去2分钟内低于80%。service_sla_rule:# Metrics value need to be long, double or intmetrics-name: service_slaop: "<"threshold: 8000# The length of time to evaluate the metricsperiod: 10# How many times after the metrics match the condition, will trigger alarmcount: 2# How many times of checks, the alarm keeps silence after alarm triggered, default as same as period.silence-period: 60message: Successful rate of service {name} is lower than 80% in 2 minutes of last 10 minutes#3.服务90%响应时间在过去3分钟内低于1000毫秒.service_resp_time_percentile_rule:# Metrics value need to be long, double or intmetrics-name: service_percentileop: ">"threshold: 1000,1000,1000,1000,1000period: 10count: 3silence-period: 60message: Percentile response time of service {name} alarm in 3 minutes of last 10 minutes, due to more than one condition of p50 > 1000, p75 > 1000, p90 > 1000, p95 > 1000, p99 > 1000#4.服务实例在过去2分钟内的平均响应时间超过1秒service_instance_resp_time_rule:metrics-name: service_instance_resp_timeop: ">"threshold: 1000period: 10count: 2silence-period: 60message: Response time of service instance {name} is more than 1000ms in 2 minutes of last 10 minutesdatabase_access_resp_time_rule:metrics-name: database_access_resp_timethreshold: 1000op: ">"period: 10count: 2silence-period: 60message: Response time of database access {name} is more than 1000ms in 2 minutes of last 10 minutesendpoint_relation_resp_time_rule:metrics-name: endpoint_relation_resp_timethreshold: 1000op: ">"period: 10count: 2silence-period: 60message: Response time of endpoint relation {name} is more than 1000ms in 2 minutes of last 10 minutes# Active endpoint related metrics alarm will cost more memory than service and service instance metrics alarm.# Because the number of endpoint is much more than service and instance.#5.端点平均响应时间过去2分钟超过1秒。endpoint_avg_rule:metrics-name: endpoint_avgop: ">"threshold: 1000period: 10count: 2silence-period: 60message: Response time of endpoint {name} is more than 1000ms in 2 minutes of last 10 minutes
sky-deployment.yaml
#创建SkyWalking deployment,这里containers端口开放了11800、12800分别作为grpc、rest端口,且通过nodeport形式暴露给内网环境,使非本k8s环境主机可以访问。#为了便捷,直接使用aliyun的elasticsearch7.7云服务作为SkyWalking的数据源存储,其余数据源可以查看已支持的https://github.com/apache/skywalking/tree/master/oap-server/server-storage-pluginapiVersion: apps/v1kind: Deploymentmetadata:name: skywalking-oap-servernamespace: monitoringlabels:app: skywalking-oap-serverrelease: 8.3.0spec:replicas: 2selector:matchLabels:app: skywalking-oap-servertemplate:metadata:labels:app: skywalking-oap-serverdevops: k8s-appspec:serviceAccountName: skywalking-oap-servercontainers:- name: skywalking-oap-serverimage: apache/skywalking-oap-server:latestimagePullPolicy: IfNotPresentlivenessProbe:tcpSocket:port: 12800initialDelaySeconds: 15periodSeconds: 20readinessProbe:tcpSocket:port: 12800initialDelaySeconds: 15periodSeconds: 20securityContext:allowPrivilegeEscalation: falseports:- name: grpccontainerPort: 11800- name: restcontainerPort: 12800resources:requests:memory: "128Mi"limits:memory: "4Gi"cpu: 4env:- name: JAVA_OPTSvalue: "-Xmx2g -Xms2g"- name: SW_CLUSTERvalue: kubernetes- name: SW_CLUSTER_K8S_NAMESPACEvalue: monitoring- name: SW_CONFIGURATIONvalue: k8s-configmap- name: SW_CONFIG_CONFIGMAP_PERIODvalue: "60"- name: SKYWALKING_COLLECTOR_UIDvalueFrom:fieldRef:fieldPath: metadata.uid- name: SW_STORAGEvalue: elasticsearch7- name: SW_STORAGE_ES_CLUSTER_NODESvalue: xxxxxxx.elasticsearch.aliyuncs.com:9200- name: SW_ES_USERvalue: elastic- name: SW_ES_PASSWORDvalue: xxxxxvolumeMounts:- name: zonemountPath: etc/localtimereadOnly: true- name: alarm-settingsmountPath: skywalking/config/alarm-settings.ymlreadOnly: truesubPath: alarm-settings.ymlvolumes:- name: zonehostPath:path: etc/localtime- name: alarm-settingsconfigMap:name: alarm-settings---apiVersion: v1kind: Servicemetadata:name: skywalking-oap-servernamespace: monitoringlabels:app: skywalking-oap-serverspec:selector:app: skywalking-oap-serverports:- name: grpcportport: 11800targetPort: 11800protocol: TCPnodePort: 31180- name: restportport: 12800targetPort: 12800protocol: TCPnodePort: 31280type: NodePort
sky-ui.yaml
#创建SkyWalking的ui,注意的是spec.spec.template.spec.containers.env.SW_OAP_ADDRESS需要跟sky-deployment.yaml的name对齐,并加上rest port,并且通过traefik2 的IngressRoute暴露域名。apiVersion: apps/v1kind: Deploymentmetadata:name: skywalking-uinamespace: monitoringlabels:app: skywalking-uispec:replicas: 1selector:matchLabels:app: skywalking-uitemplate:metadata:labels:app: skywalking-uispec:containers:- name: skywalking-uiimage: apache/skywalking-ui:latestimagePullPolicy: IfNotPresentports:- containerPort: 8080name: pageresources:requests:memory: "128Mi"limits:memory: "3G"cpu: 2env:- name: SW_OAP_ADDRESSvalue: skywalking-oap-server:12800volumeMounts:- name: zonemountPath: etc/localtimereadOnly: truevolumes:- name: zonehostPath:path: etc/localtime---apiVersion: v1kind: Servicemetadata:labels:app: skywalking-uiname: skywalking-uinamespace: monitoringspec:ports:- port: 80targetPort: 8080protocol: TCPname: pageselector:app: skywalking-ui---apiVersion: traefik.containo.us/v1alpha1kind: IngressRoutemetadata:name: skywalking-uinamespace: monitoringlabels:app: skywalking-uispec:entryPoints:- httproutes:- match: Host(`sw.domain.com`) && PathPrefix(`/`)kind: Rulepriority: 10middlewares:- name: net-officalnamespace: defaultservices:- name: skywalking-uinamespace: monitoringport: 80
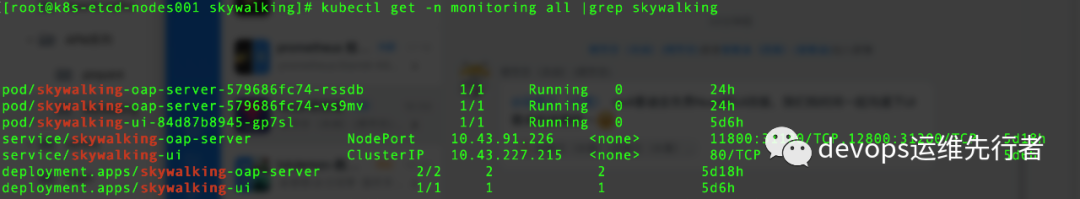
按顺序分别kubectl apply部署SkyWalking,部署完成后可查看相关SkyWalking资源。
3 SkyWalking使用
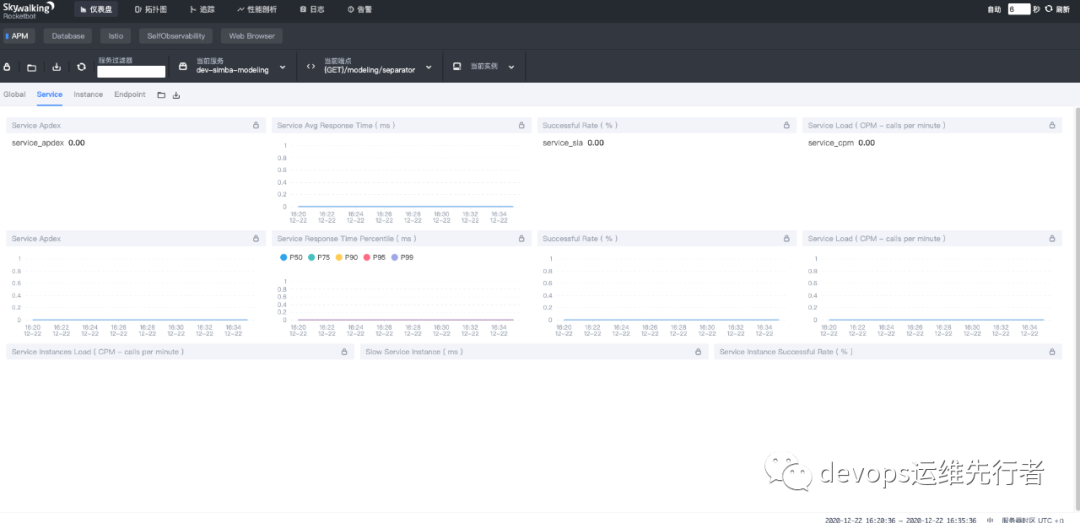
当浏览器登录sw.domain.com的时候,可以看到SkyWalking UI已经准备完成,只不过现在没有服务接入,所有都是空白的,
接下来我们来准备SkyWalking Agent,让JAVA服务接入agent。
3.1 SkyWalking Agent准备
#SkyWalking Agent DockerfileFROM alpine:3.8LABEL maintainer=xiayunENV SKYWALKING_VERSION=8.3.0ADD http://mirrors.tuna.tsinghua.edu.cn/apache/skywalking/${SKYWALKING_VERSION}/apache-skywalking-apm-${SKYWALKING_VERSION}.tar.gzRUN tar -zxvf apache-skywalking-apm-${SKYWALKING_VERSION}.tar.gz && \mv apache-skywalking-apm-bin skywalking && \mv skywalking/agent/optional-plugins/apm-trace-ignore-plugin* skywalking/agent/plugins/ && \chmod -R 777 skywalking/agent && \echo -e "\n# Ignore Path" >> /skywalking/agent/config/apm-trace-ignore-plugin.config && \echo "# see https://github.com/apache/skywalking/blob/8.3.0/docs-hotfix/docs/en/setup/service-agent/java-agent/agent-optional-plugins/trace-ignore-plugin.md" >> /skywalking/agent/config/apm-trace-ignore-plugin.config && \echo 'trace.ignore_path=${SW_AGENT_TRACE_IGNORE_PATH:/health}' >> /skywalking/agent/config/apm-trace-ignore-plugin.config && \echo 'agent.namespace=${SW_AGENT_NAMESPACE:default-namespace}' >> /skywalking/agent/config/agent.config && \echo 'logging.max_file_size=${SW_LOGGING_MAX_FILE_SIZE:1073741824}' >> /skywalking/agent/config/agent.config
通过此SkyWalking Agent Dockerfile文件,生成skywalking-agent:r1.0镜像,并上传至nexus3(nexus3在k8s中部署可以查看公众号的上一篇文章<<云原生利器 -- Nexus3>>)
3.2 java k8s文件准备
在java服务的Dockerfile中需要加${JAVA_OPTS}参数,在k8s配置文件中,我们需要增加env变量,如:CMD java ${JAVA_OPTS} -jar jar-name
然后在java k8s配置文件中,增加initContainers,以k8s sidecar的形式部署SkyWalking agent
#java k8s配置文件apiVersion: apps/v1kind: Deploymentmetadata:name: server-namenamespace: ENVlabels:prometheus: ENV-serverspec:replicas: 1selector:matchLabels:app: server-nametemplate:metadata:labels:app: server-nameprometheus: ENV-serverdevops: k8s-appspec:initContainers:- name: skywalking-agentimage: skywalking-agent:r1.0securityContext:allowPrivilegeEscalation: falseresources:limits:memory: 1Girequests:memory: 100Micommand:- 'sh'- '-c'- 'set -ex;mkdir -p /vmskywalking/agent;cp -r /skywalking/agent/* /vmskywalking/agent'volumeMounts:- name: zonemountPath: /etc/localtimereadOnly: true- name: sw-agentmountPath: /vmskywalking/agentcontainers:- name: server-nameimage: 172.16.10.13/ENV-server/server-name:<BUILD_TAG>imagePullPolicy: AlwayssecurityContext:allowPrivilegeEscalation: falsereadinessProbe:tcpSocket:port: 8081initialDelaySeconds: 5periodSeconds: 5livenessProbe:tcpSocket:port: 8081initialDelaySeconds: 300periodSeconds: 5ports:- name: webprotocol: TCPcontainerPort: 8081resources:requests:cpu: "100m"memory: "128Mi"limits:memory: "MAXMEM"env:- name: JAVA_OPTSvalue: -javaagent:/usr/lib/agent/skywalking-agent.jar- name: SW_AGENT_NAMEvalue: ENV-server-name- name: SW_AGENT_COLLECTOR_BACKEND_SERVICESvalue: skywalking-oap-server.monitoring.svc.cluster.local:11800- name: SW_LOGGING_LEVELvalue: ERROR- name: SW_LOGGING_MAX_FILE_SIZEvalue: "1073741824"- name: SW_AGENT_NAMESPACEvalue: ENV- name: SW_MOUNT_FOLDERSvalue: plugins,activations- name: SW_AGENT_TRACE_IGNORE_PATHvalue: /health,/actuator/prometheus,/prometheusvolumeMounts:- name: zonemountPath: /etc/localtimereadOnly: true- name: app-logsmountPath: /home/admin/server-name/logs- name: fontsmountPath: /usr/share/fontssubPath: fontsreadOnly: true- name: sw-agentmountPath: /usr/lib/agentvolumes:- name: zonehostPath:path: /etc/localtime- name: app-logsemptyDir: {}- name: sw-agentemptyDir: {}- name: fontspersistentVolumeClaim:claimName: fonts---apiVersion: v1kind: Servicemetadata:name: server-name-svcnamespace: ENVlabels:prometheus: ENV-serverannotations:prometheus.io/scrape: "true"prometheus.io/port: "8081"prometheus.io/path: "/actuator/prometheus"spec:template:metadata:labels:name: server-name-svcnamespace: ENVprometheus: ENV-serverspec:selector:app: server-nameports:- name: webport: 80targetPort: 8081
配置完成后,运行java 服务。让我们来看下现在k8s SkyWalking的基础架构,
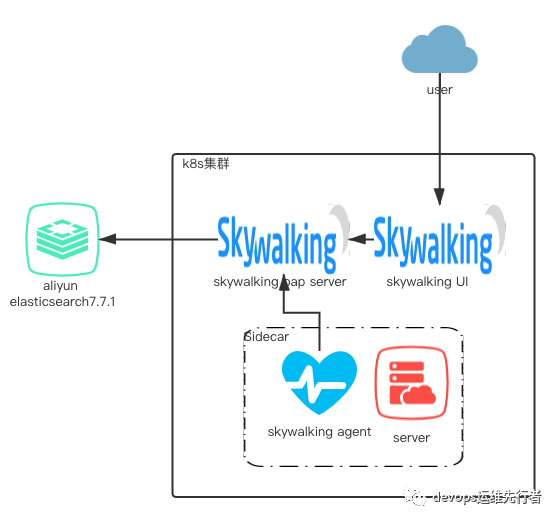
采用aliyun elasticsearch作为skywalking的存储源,skywalking server跟ui都部署在k8s上,skywalking agent客户端采用k8s sidecar 边车模式跟微服务共享容器空间。
3.3 SkyWalking使用
登录SkyWalking UI页面,右上角刷新一下,可以显示出新增的java服务,如,
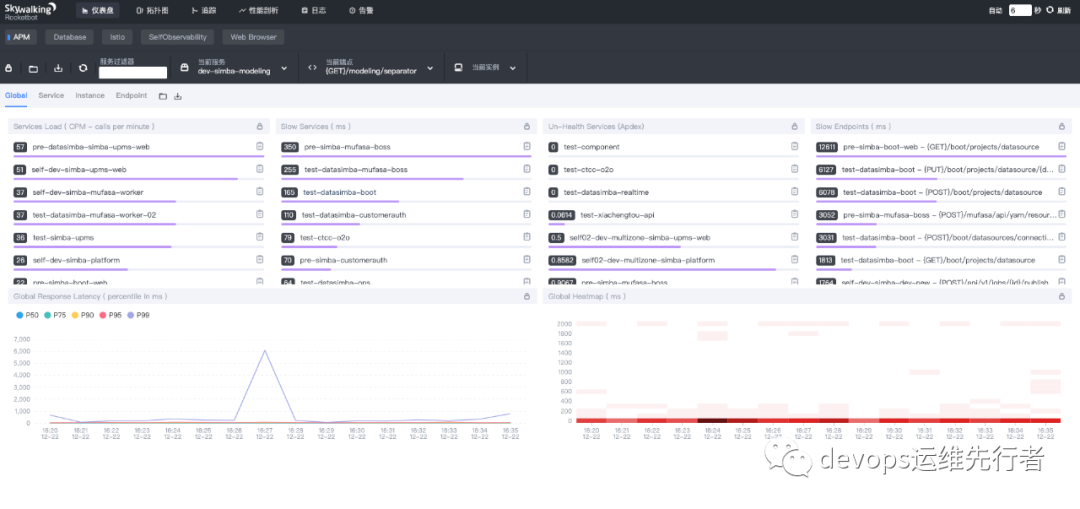
从仪表盘的APM中,可以看到Services Load、Slow Services、Un-Health Service、Slow Endpoints的Top10情况。
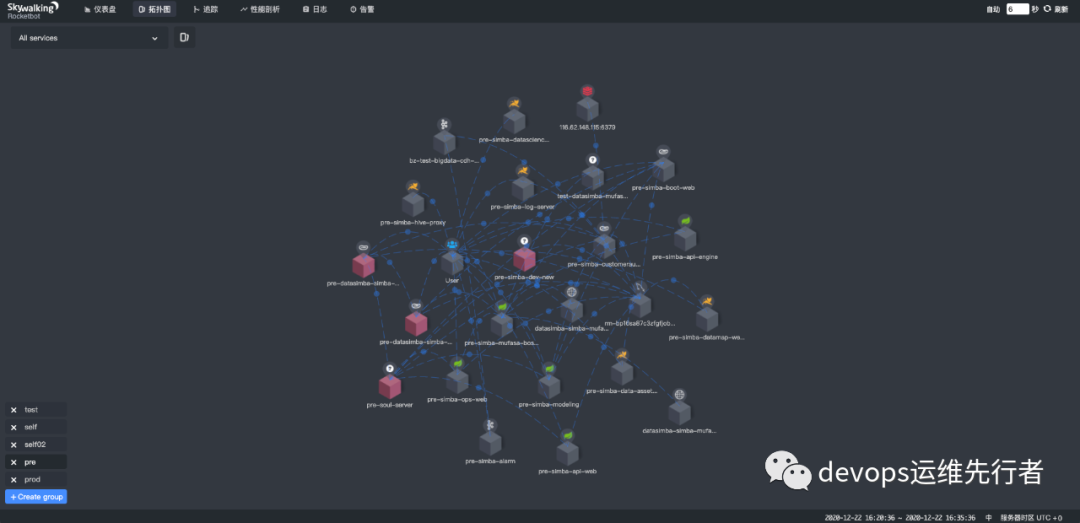
从拓扑图中,可以看到整个环境中的服务链路调用情况,如,
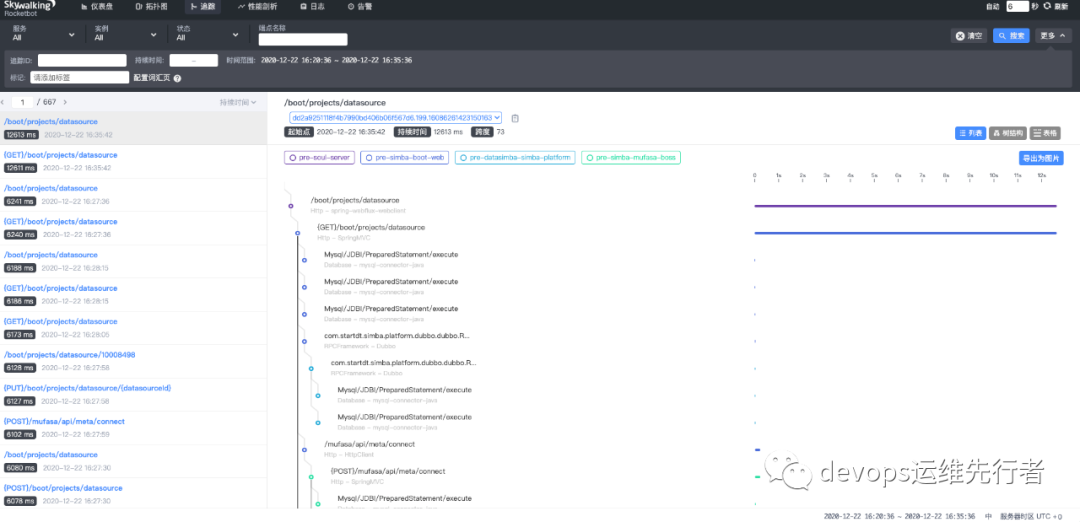
从追踪中,可以看到服务的链路情况明细,如,
如果trace链路需要忽略某些路径,如/health,/actuator/prometheus,/prometheus这些监控uri,可以在java k8s配置文件中的env.SW_AGENT_TRACE_IGNORE_PATH配置,如需通配路径,参考trace.ignore_path=/your/path/1/**,/your/path/2/**
,具体可以查阅https://github.com/apache/skywalking/blob/8.3.0/docs-hotfix/docs/en/setup/service-agent/java-agent/agent-optional-plugins/trace-ignore-plugin.md
性能剖析和日志,目前没有使用到,暂不介绍,等后续更新吧···
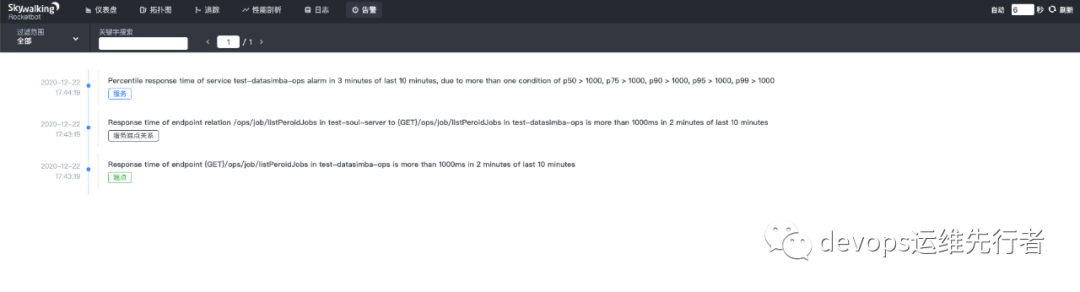
从告警中,可以看到当前服务的链路告警详情,告警规则可以在alarm-settings.yml里配置,告警可以接入WebHook,如Dingtalk Hook,WeChat Hook,Slack Chat Hook,gRPCHook等
rules:service_resp_time_rule:metrics-name: service_resp_timeop: ">"threshold: 1000period: 10count: 3silence-period: 60message: Response time of service {name} is more than 1000ms in 3 minutes of last 10 minutes.
如此配置中,service_resp_time_rule的告警规则为过去3分钟内服务平均响应时间超过1秒就告警,沉默时间为60分钟。
告警规则主要有以下几点:
Rule name。在告警信息中显示的唯一名称。必须以_rule结尾。指定的规则(与规则名不同,这里是对应的告警中的规则map,具体可查看 https://github.com/apache/skywalking/blob/master/docs/en/setup/backend/backend-alarm.md#list-of-all-potential-metrics-name,其中一些常见的,endpoint_percent_rule——端点相应半分比告警,service_percent_rule——服务相应百分比告警) Metrics name。也是 OAL 脚本中的度量名。只支持long,double和int类型。详情见所有可能的度量名称列表. Include names。使用本规则告警的服务列表。比如服务名,端点名。 Threshold。阈值,与metrics-name和下面的比较符号相匹配 OP。操作符, 支持 >, <, =。欢迎贡献所有的操作符。如 metrics-name: endpoint_percent, threshold: 75,op: < ,表示如果相应时长小于平均75%则发送告警 Period.。多久告警规则需要被核实一下。这是一个时间窗口,与后端部署环境时间相匹配。 Count。在一个Period窗口中,如果values超过Threshold值(按op),达到Count值,需要发送警报。 Silence period。在时间N中触发报警后,在TN -> TN + period这个阶段不告警。默认情况下,它和Period一样,这意味着相同的告警(在同一个Metrics name拥有相同的Id)在同一个Period内只会触发一次。 来看一下dingding的监控告警, 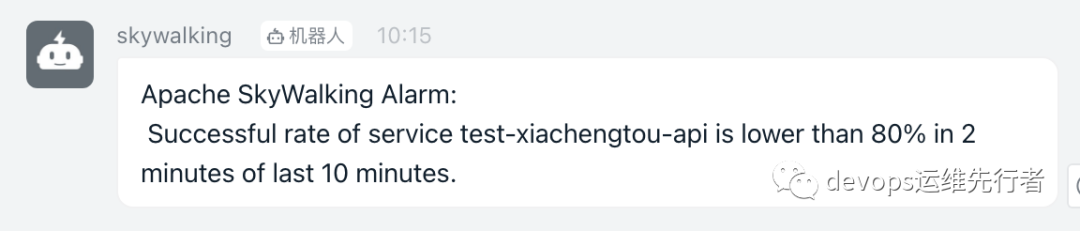
参考文献
1.https://github.com/apache/skywalking
2.https://github.com/apache/skywalking-kubernetes
3.https://skywalking-handbook.netlify.app/


往期推荐
