


线条风格
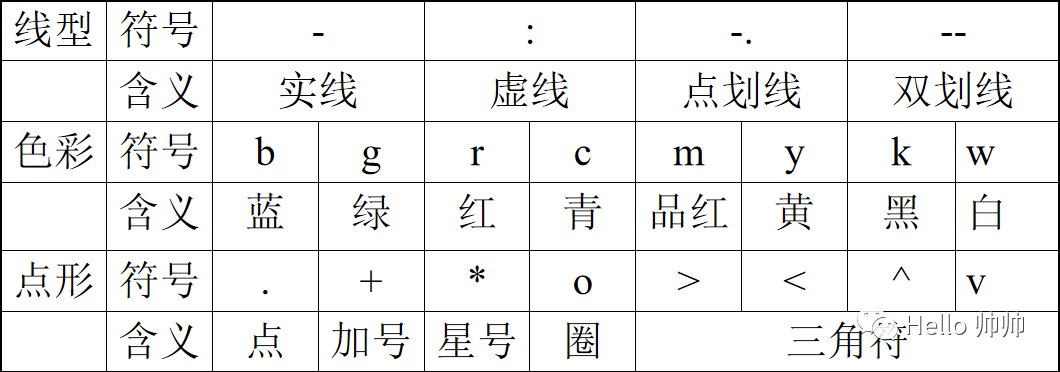
图片组件
画图窗口打开
figure
设置标题
title
坐标显示:
grid on
grid off
命名坐标轴
xlabel('x轴')
ylabel('y轴')
内嵌文字
text(x,y,str)
标注曲线
legend(str,str)
设置坐标轴
axis([xmin xmax ymin ymax]) 设定最大和最小值
axis (’square’) 将当前坐标图形设置为方形
axis (’equal’) 两个坐标因子设成相等
axis (’off’) 关闭坐标系统
axis (’on’) 显示坐标系统
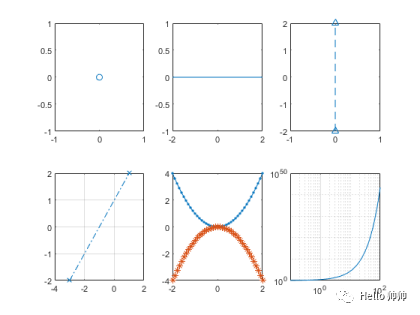
设置子图
subplot(x,y,n)
示例:
figure %创建图形窗口subplot(2,3,1) %选择2行3列第1个子窗口plot(0,0,'o') %画点(圈)subplot(2,3,2),plot([-2,2],[0,0]) %选择2行3列第2个子窗口,画水平实线subplot(2,3,3),plot([0,0],[-2,2],'--^')%选择2行3列第3个子窗口,画竖直虚线subplot(2,3,4),plot([-3,1],[-2,2],'-.x')%选择2行3列第4个子窗口,画斜点虚线grid %加网格x=-2:0.1:2; %横坐标向量y=x.^2; %纵坐标向量subplot(2,3,5),plot(x,y,'.-',x,-y,':*')%选择2行3列第5个子窗口,画上下抛物线subplot(2,3,6),plot(y,x,'p-r',-y,x,':hc')%选择2行3列第6个子窗口,画左右抛物线x=logspace(-1,2);loglog(x,exp(x),'-')grid on %标注格栅
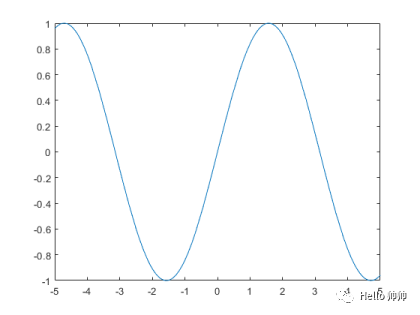
符号函数画图
显函数
fplot(@(x) sin(x)) %中间不能有逗号分隔符
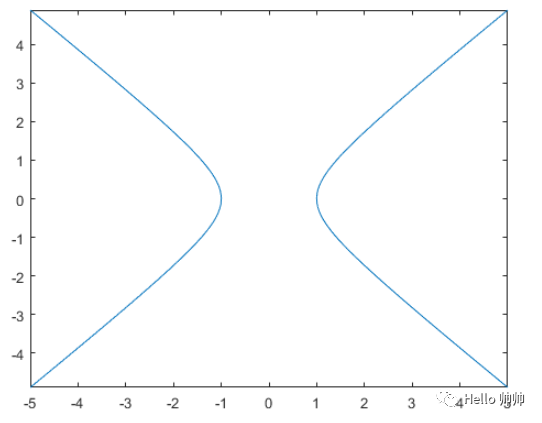
隐函数
fimplicit(@(x,y) x.^2 - y.^2 - 1)
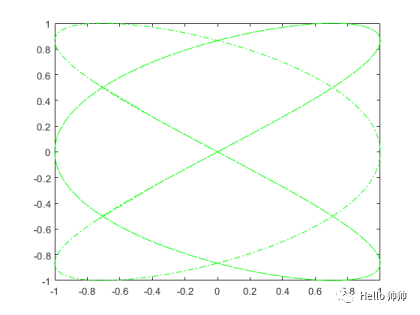
参数方程
xt = @(t) cos(3*t);yt = @(t) sin(2*t);fplot(xt,yt,'g-.')
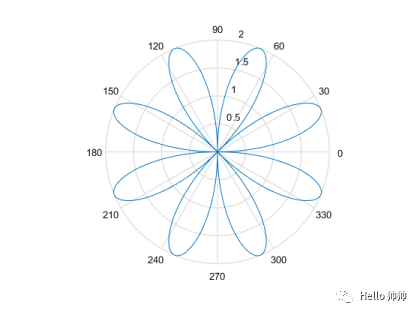
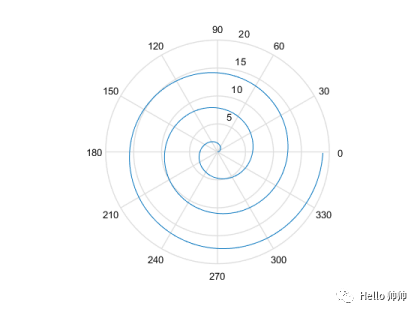
极坐标函数
theta=0:0.01:2*pi;%玫瑰线rho=2*sin(4*theta);polar(theta,rho)theta=0:0.01:6*pi;%阿基米德螺线rho=theta;polar(theta,rho)
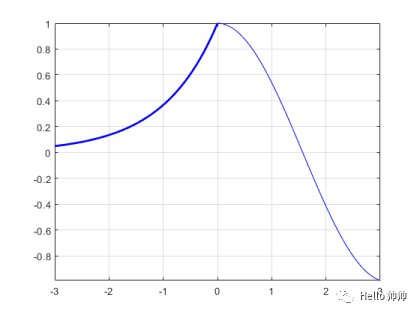
分段函数
fplot(@(x) exp(x),[-3 0],'b','Linewidth',2)hold onfplot(@(x) cos(x),[0 3],'b')hold offgrid on
文章转载自Hello 帅帅,如果涉嫌侵权,请发送邮件至:contact@modb.pro进行举报,并提供相关证据,一经查实,墨天轮将立刻删除相关内容。
