



什么是 SafePoint?
为什么 safepoint 的位置只在特定的位置?
挂在 safepoint 的调试符号信息要占用空间。如果允许每条机器码都可以是 safepoint 的话,需要存储的数据量会很大(当然这有办法解决,例如用 delta 存储和使用压缩) safepoint 会影响优化。特别是 deoptimization safepoint,会迫使 JVM 保留一些只有解释器可能需要的、JIT 编译器认定无用的变量的值。本来 JIT 编译器可能可以发现某些值不需要而消除他们对应的运算。
什么是 Stop The World?
为什么需要 SafePoint 以及 Stop The World?
Thread.interrup(),线程只有运行到 Safepoint 才知道是否
interrupted。
Safepoint 如何实现的?
Polling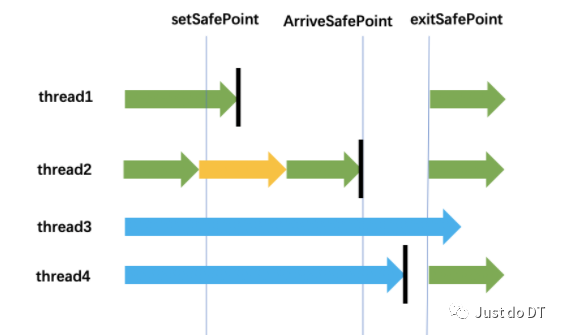
两类:
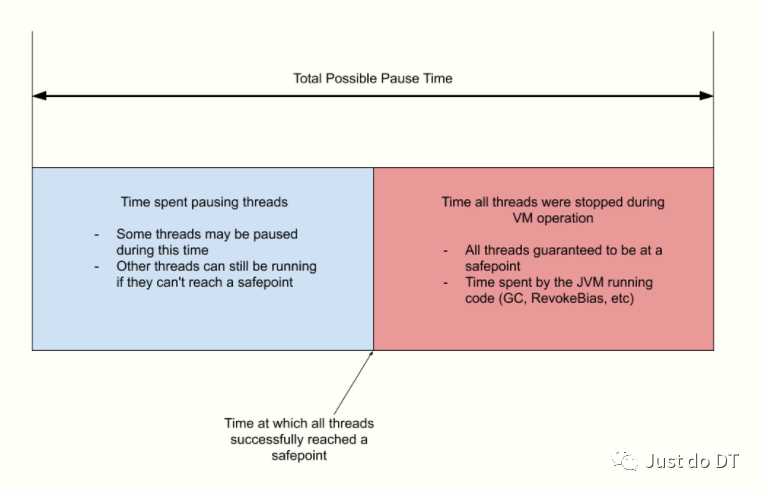
从发起安全点请求到所有线程到达安全点所用的时间 执行安全点操作所需的时间
SafePoint 案例
案例1
package com.justdodt.jvm;/*** @Author:JustDoDT* @Description:* @Date:Create in 23:43 2021/11/10* @Modified By:*//**-Xms20M 堆初始化大最小容量-Xmx20M 堆初始化最大容量-Xmn10M 新生代容量-XX:SurvivorRatio=8 配置新生代和survivor的大小比例为8:1:1-XX:+PrintSafepointStatistics 输出safepoint 统计信息,与下面的 PrintSafepointStatisticsCount 相结合使用-XX:PrintSafepointStatisticsCount=1-XX:+UnlockDiagnosticVMOptions 这个参数与下面的 GuaranteedSafepointInterval 配合使用,关闭定时让所有线程进入 safepoint-XX:GuaranteedSafepointInterval=0-XX:+PrintGCDetails 输出详细的 GC 信息-XX:+PrintGCApplicationConcurrentTime 两次连续暂停的时间间隔-XX:+PrintGCApplicationStoppedTime 程序 JVM 暂停的时间*/public class SafepointTest {public static void main(String[] args) {int size = 1024 * 1024;byte[] bytes1 = new byte[2 * size];byte[] bytes2 = new byte[2 * size];byte[] bytes3 = new byte[3 * size];byte[] bytes4 = new byte[3 * size];//当需要分配内存的对象的大小超出了新生代的容量时,对象会被直接分配到老年代System.out.println("hello world");}}
输出结果为:
"D:\\Program Files\\Java\\jdk1.8.0_172\\bin\\java" -Xms20M -Xmx20M -Xmn10M -XX:+PrintSafepointStatistics -XX:PrintSafepointStatisticsCount=1 -XX:+UnlockDiagnosticVMOptions -XX:+PrintGCDetails -XX:GuaranteedSafepointInterval=0 -XX:+PrintGCApplicationConcurrentTime -XX:+PrintGCApplicationStoppedTime "-javaagent:D:\\Program Files\\Java\\IntelliJ IDEA 2017.2\\lib\\idea_rt.jar=61059:D:\\Program Files\\Java\\IntelliJ IDEA 2017.2\\bin" -Dfile.encoding=UTF-8 -classpath "D:\\Program Files\\Java\\jdk1.8.0_172\\jre\\lib\\charsets.jar;D:\\Program Files\\Java\\jdk1.8.0_172\\jre\\lib\\deploy.jar;D:\\Program Files\\Java\\jdk1.8.0_172\\jre\\lib\\ext\\access-bridge-64.jar;D:\\Program Files\\Java\\jdk1.8.0_172\\jre\\lib\\ext\\cldrdata.jar;D:\\Program Files\\Java\\jdk1.8.0_172\\jre\\lib\\ext\\dnsns.jar;D:\\Program Files\\Java\\jdk1.8.0_172\\jre\\lib\\ext\\jaccess.jar;D:\\Program Files\\Java\\jdk1.8.0_172\\jre\\lib\\ext\\jfxrt.jar;D:\\Program Files\\Java\\jdk1.8.0_172\\jre\\lib\\ext\\localedata.jar;D:\\Program Files\\Java\\jdk1.8.0_172\\jre\\lib\\ext\\nashorn.jar;D:\\Program Files\\Java\\jdk1.8.0_172\\jre\\lib\\ext\\sunec.jar;D:\\Program Files\\Java\\jdk1.8.0_172\\jre\\lib\\ext\\sunjce_provider.jar;D:\\Program Files\\Java\\jdk1.8.0_172\\jre\\lib\\ext\\sunmscapi.jar;D:\\Program Files\\Java\\jdk1.8.0_172\\jre\\lib\\ext\\sunpkcs11.jar;D:\\Program Files\\Java\\jdk1.8.0_172\\jre\\lib\\ext\\zipfs.jar;D:\\Program Files\\Java\\jdk1.8.0_172\\jre\\lib\\javaws.jar;D:\\Program Files\\Java\\jdk1.8.0_172\\jre\\lib\\jce.jar;D:\\Program Files\\Java\\jdk1.8.0_172\\jre\\lib\\jfr.jar;D:\\Program Files\\Java\\jdk1.8.0_172\\jre\\lib\\jfxswt.jar;D:\\Program Files\\Java\\jdk1.8.0_172\\jre\\lib\\jsse.jar;D:\\Program Files\\Java\\jdk1.8.0_172\\jre\\lib\\management-agent.jar;D:\\Program Files\\Java\\jdk1.8.0_172\\jre\\lib\\plugin.jar;D:\\Program Files\\Java\\jdk1.8.0_172\\jre\\lib\\resources.jar;D:\\Program Files\\Java\\jdk1.8.0_172\\jre\\lib\\rt.jar;D:\\eclipse-workspace\\jvm\\target\\classes" com.justdodt.jvm.SafepointTestApplication time: 0.0051033 seconds[GC (Allocation Failure) [PSYoungGen: 6150K->840K(9216K)] 6150K->4944K(19456K), 0.0030366 secs] [Times: user=0.00 sys=0.00, real=0.00 secs]vmop [threads: total initially_running wait_to_block] [time: spin block sync cleanup vmop] page_trap_count0.132: ParallelGCFailedAllocation [ 11 0 1 ] [ 0 0 0 0 3 ] 0Total time for which application threads were stopped: 0.0032516 seconds, Stopping threads took: 0.0000747 secondshello worldHeapPSYoungGen total 9216K, used 7307K [0x00000000ff600000, 0x0000000100000000, 0x0000000100000000)eden space 8192K, 78% used [0x00000000ff600000,0x00000000ffc50e68,0x00000000ffe00000)from space 1024K, 82% used [0x00000000ffe00000,0x00000000ffed2020,0x00000000fff00000)to space 1024K, 0% used [0x00000000fff00000,0x00000000fff00000,0x0000000100000000)ParOldGen total 10240K, used 4104K [0x00000000fec00000, 0x00000000ff600000, 0x00000000ff600000)object space 10240K, 40% used [0x00000000fec00000,0x00000000ff002020,0x00000000ff600000)Metaspace used 3429K, capacity 4496K, committed 4864K, reserved 1056768Kclass space used 373K, capacity 388K, committed 512K, reserved 1048576KApplication time: 0.0010636 secondsvmop [threads: total initially_running wait_to_block] [time: spin block sync cleanup vmop] page_trap_count0.137: no vm operation [ 10 1 2 ] [ 0 0 0 0 0 ] 0Polling page always armedParallelGCFailedAllocation 10 VM operations coalesced during safepointMaximum sync time 0 msMaximum vm operation time (except for Exit VM operation) 3 msProcess finished with exit code 0
可以从上面结果看到
Total time for which application threads were stopped: 0.0032516 seconds, Stopping threads took: 0.0000747 seconds
0.0032516秒表示线程可能已经停止的总时间,这包括上面图中的蓝色和红色部分。
0.0000747秒表示在上面图中蓝色部分花费的时间,即,在安全点停止所有线程所花费的时间,尽管在 JVM 中此对应的参数为 -XX:+PrintGCApplicationStoppedTime ,她实际上是记录了所有 JVM 暂停,而不仅仅是 GC 暂停。
可能是因为 JVM 正试图到达一个安全点,大多数线程已经停止,除了一两个, 或者 JVM 已经到达安全点并正在运行一些内部操作,可能是 GC ,偏向锁撤销,cache line 失效等。
案例2
package com.justdodt.jvm;import java.util.ArrayList;import java.util.Collection;/*** @Author:JustDoDT* @Description:* @Date:Create in 18:33 2021/11/17* @Modified By:*/public class FullGC {private static final Collection<Object> leak = new ArrayList<>();private static volatile Object sink;// Notice that all the stop the world pauses coincide with GC pausespublic static void main(String[] args) {while(true) {try {leak.add(new byte[1024 * 1024]);sink = new byte[1024 * 1024];} catch(OutOfMemoryError e) {leak.clear();}}}}
-XX:+PrintGCApplicationStoppedTime -XX:+PrintGCDetails,然后会出现如下的结果
Application time: 0.0013760 secondsTotal time for which application threads were stopped: 0.0000805 seconds, Stopping threads took: 0.0000293 secondsApplication time: 0.0268820 secondsTotal time for which application threads were stopped: 0.0059423 seconds, Stopping threads took: 0.0000255 seconds
注意:所有的 Stop The World 暂停都与 GC 暂停一致。
案例3
package com.justdodt.jvm;/*** @Author:JustDoDT* @Description:* @Date:Create in 18:59 2021/11/17* @Modified By:*/import java.util.concurrent.locks.LockSupport;import java.util.stream.Stream;public class BiasedLocks {private static synchronized void contend() {LockSupport.parkNanos(100_000);}// Biased locks are on by default, but you can disable them by -XX:-UseBiasedLocking// It is quite possible that in the modern massively parallel world, they should be// turned back off by defaultpublic static void main(String[] args) throws InterruptedException {Thread.sleep(5_000); // Because of BiasedLockingStartupDelayStream.generate(() -> new Thread(BiasedLocks::contend)).limit(10).forEach(Thread::start);}}
当 JVM 参数里面加上 -XX:+PrintGCApplicationStoppedTime
-XX:+PrintGCDetails
时,输出的结果为
Application time: 0.0013760 secondsTotal time for which application threads were stopped: 0.0000805 seconds, Stopping threads took: 0.0000293 secondsApplication time: 0.0268820 secondsTotal time for which application threads were stopped: 0.0059423 seconds, Stopping threads took: 0.0000255 seconds
-XX:+PrintSafepointStatistics -XX:PrintSafepointStatisticsCount=1添加到应用程序中。每次发生安全点操作时,添加这两个参数将打印到标准输出或配置的日志文件。从 JDK 8 开始,日志输出由两行组成,如下所示(时间以毫秒为单位):
vmop [threads: total initially_running wait_to_block] [time: spin block sync cleanup vmop] page_trap_count1.042: no vm operation [ 11 0 0 ] [ 0 0 0 0 0 ] 0vmop [threads: total initially_running wait_to_block] [time: spin block sync cleanup vmop] page_trap_count4.446: EnableBiasedLocking [ 11 0 0 ] [ 0 0 0 0 0 ] 0vmop [threads: total initially_running wait_to_block] [time: spin block sync cleanup vmop] page_trap_count5.532: RevokeBias [ 17 4 2 ] [ 0 0 0 0 0 ] 0vmop [threads: total initially_running wait_to_block] [time: spin block sync cleanup vmop] page_trap_count5.533: RevokeBias [ 18 1 1 ] [ 0 0 0 0 0 ] 0vmop [threads: total initially_running wait_to_block] [time: spin block sync cleanup vmop] page_trap_count5.534: RevokeBias [ 21 0 0 ] [ 0 0 0 0 0 ] 0vmop [threads: total initially_running wait_to_block] [time: spin block sync cleanup vmop] page_trap_count5.536: RevokeBias [ 20 0 0 ] [ 0 0 0 0 0 ] 0vmop [threads: total initially_running wait_to_block] [time: spin block sync cleanup vmop] page_trap_count5.538: RevokeBias [ 19 0 0 ] [ 0 0 0 0 0 ] 0vmop [threads: total initially_running wait_to_block] [time: spin block sync cleanup vmop] page_trap_count5.541: RevokeBias [ 18 0 0 ] [ 0 0 0 0 0 ] 0vmop [threads: total initially_running wait_to_block] [time: spin block sync cleanup vmop] page_trap_count5.543: RevokeBias [ 17 0 0 ] [ 0 0 0 0 0 ] 0vmop [threads: total initially_running wait_to_block] [time: spin block sync cleanup vmop] page_trap_count5.544: RevokeBias [ 16 0 0 ] [ 0 0 0 0 0 ] 0vmop [threads: total initially_running wait_to_block] [time: spin block sync cleanup vmop] page_trap_count5.546: RevokeBias [ 15 0 0 ] [ 0 0 0 0 0 ] 0vmop [threads: total initially_running wait_to_block] [time: spin block sync cleanup vmop] page_trap_count5.548: RevokeBias [ 14 0 0 ] [ 0 0 0 0 0 ] 0vmop [threads: total initially_running wait_to_block] [time: spin block sync cleanup vmop] page_trap_count5.549: RevokeBias [ 13 0 0 ] [ 0 0 0 0 0 ] 0vmop [threads: total initially_running wait_to_block] [time: spin block sync cleanup vmop] page_trap_count5.551: RevokeBias [ 12 0 0 ] [ 0 0 0 0 0 ] 0vmop [threads: total initially_running wait_to_block] [time: spin block sync cleanup vmop] page_trap_count5.551: no vm operation [ 10 0 0 ] [ 0 0 0 0 332 ] 0Polling page always armedEnableBiasedLocking 1RevokeBias 120 VM operations coalesced during safepointMaximum sync time 0 msMaximum vm operation time (except for Exit VM operation) 0 ms
vmop  [threads: total initially_running wait_to_block]    [time: spin block sync cleanup vmop] page_trap_count
5.544: RevokeBias   [      16          0              0    ]      [     0     0     0     0     0    ]  0
到达 safepoint 的时间或者
线程停止时间通常仅包括自旋和阻塞时间。
常见的 SafePoint 调优参数以及讲解
1、建议关闭定时让所有线程进入 Safepoint
-XX:+UnlockDiagnosticVMOptions -XX:GuaranteedSafepointInterval=02、建议取消偏向锁
-XX:-UseBiasedLocking3、建议打开循环内添加 Safepoint 参数
4、建议打开 debug 级别的 safepoint 日志
Xlog:safepoint=debug:file=safepoint.log:utctime,level,tags:filecount=50,filesize=100M为啥会出现 Safe Region ?
JVM 何时会 Stop The World
[ ] 由于 jstack,jmap,jstat 等命令,也就是 Singal Dispatcher 线程要处理的大部分命令,都会导致 Stop The World,这种命令都需要采集堆栈信息,所以需要所有线程进入 Safepoint 并暂停。 [ ] 偏向锁取消(这个不一定会引发整体的 Stop The World,参考 JEP 312:Thread-Local Handshakes):Java 认为,锁大部分情况是没有竞争的(某个同步块大多数都不会出现线程同时竞争锁),所以可以通过偏向锁来提高性能。既在无竞争时,之前获得锁的线程再次获得锁时,会判断是否偏向锁指向我,那么该线程将不用再获得锁,直接就可以进入同步块。但是高并发的情况下,偏向锁会经常失效,导致需要取消偏向锁,取消偏向锁的时候,需要 Stop The World,因为要获取每个线程使用锁的状态以及运行状态。 [ ] Java Instrument 导致的 Agent 加载以及类的重定义:由于涉及到类重定义,需要修改栈上和这个类相关的信息,所以需要 Stop The World。 [ ] Java Code Cache 相关:当发生 JIT 编译优化或者去优化,需要 OSR 或者 Baiilout 或者清理代码缓存的时候,由于需要读取线程执行的方法以及改变线程执行的方法,所以需要 Stop The World [ ] GC:这个由于需要每个线程的对象使用信息,以及回收一些对象,释放某些堆内存或者直接内存,所以需要 Stop The World。 [ ] JFR 的一些事件:如果开启了 JFR 的 OldObject 采集,这个是定时采集一些存活时间比较久的对象,所以需要 Stop The World。同时,JFR 在 dump 的时候,由于每个线程都有一个 JFR 事件的 buffer,需要将 buffer 中的事件采集出来,所以需要 Stop The World。
参考
https://www.zhihu.com/question/29268019
https://zhuanlan.zhihu.com/p/161710652
https://blanco.io/blog/jvm-safepoint-pauses/#safepoint-operations
文章转载自Just do DT,如果涉嫌侵权,请发送邮件至:contact@modb.pro进行举报,并提供相关证据,一经查实,墨天轮将立刻删除相关内容。
