


34. 面积图绘制
清除当前环境中的变量
rm(list=ls())
设置工作目录
setwd("C:/Users/Dell/Desktop/R_Plots/34area/")
使用ggplot2包绘制面积图
# 加载所需的R包
library(ggplot2)
# 构建示例数据
xValue <- 1:50
yValue <- cumsum(rnorm(50))
data <- data.frame(xValue,yValue)
# 查看示例数据
head(data)
## xValue yValue
## 1 1 0.23272473
## 2 2 -0.43662890
## 3 3 -0.07695937
## 4 4 -1.64320298
## 5 5 -2.32700864
## 6 6 -3.02549140
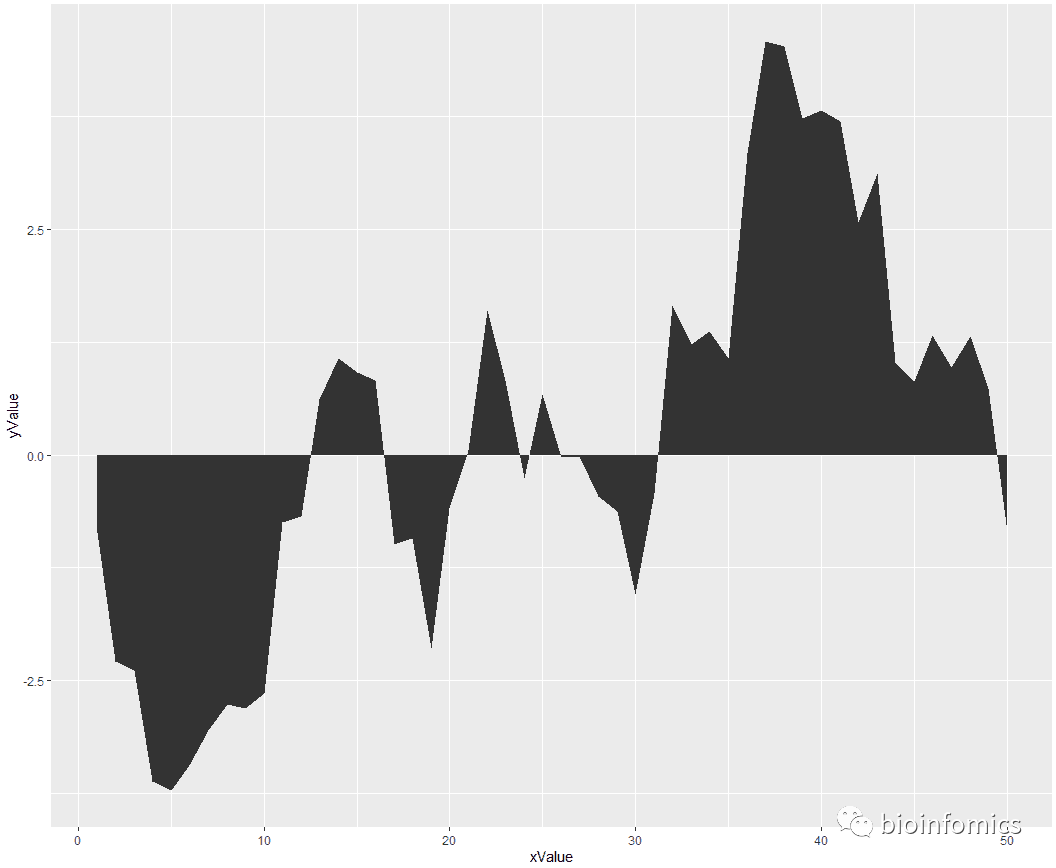
# 使用geom_area()函数绘制基础面积图
ggplot(data, aes(x=xValue, y=yValue)) +
geom_area()
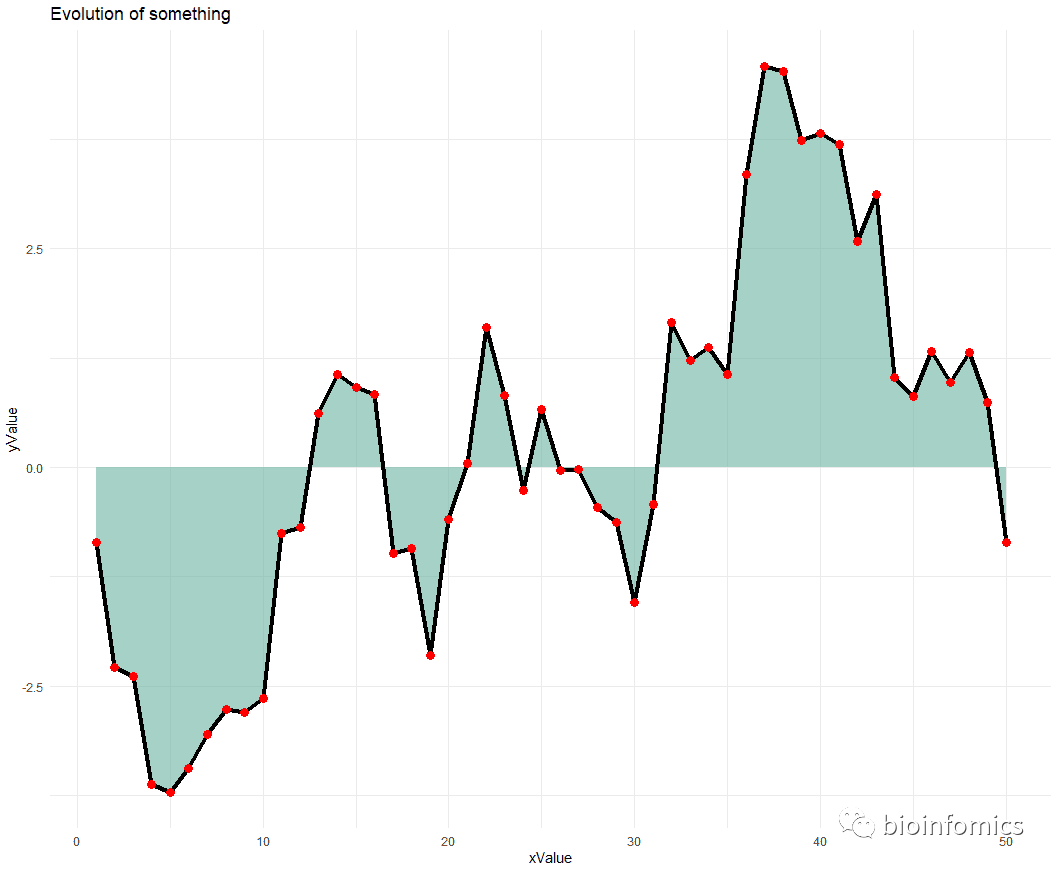
# 添加填充颜色,边界线和点,更换主题
ggplot(data, aes(x=xValue, y=yValue)) +
  geom_area(fill="#69b3a2", alpha=0.6) +
  geom_line(color="black", size=1.5) +
  geom_point(size=3, color="red") +
  theme_minimal() +
  ggtitle("Evolution of something")
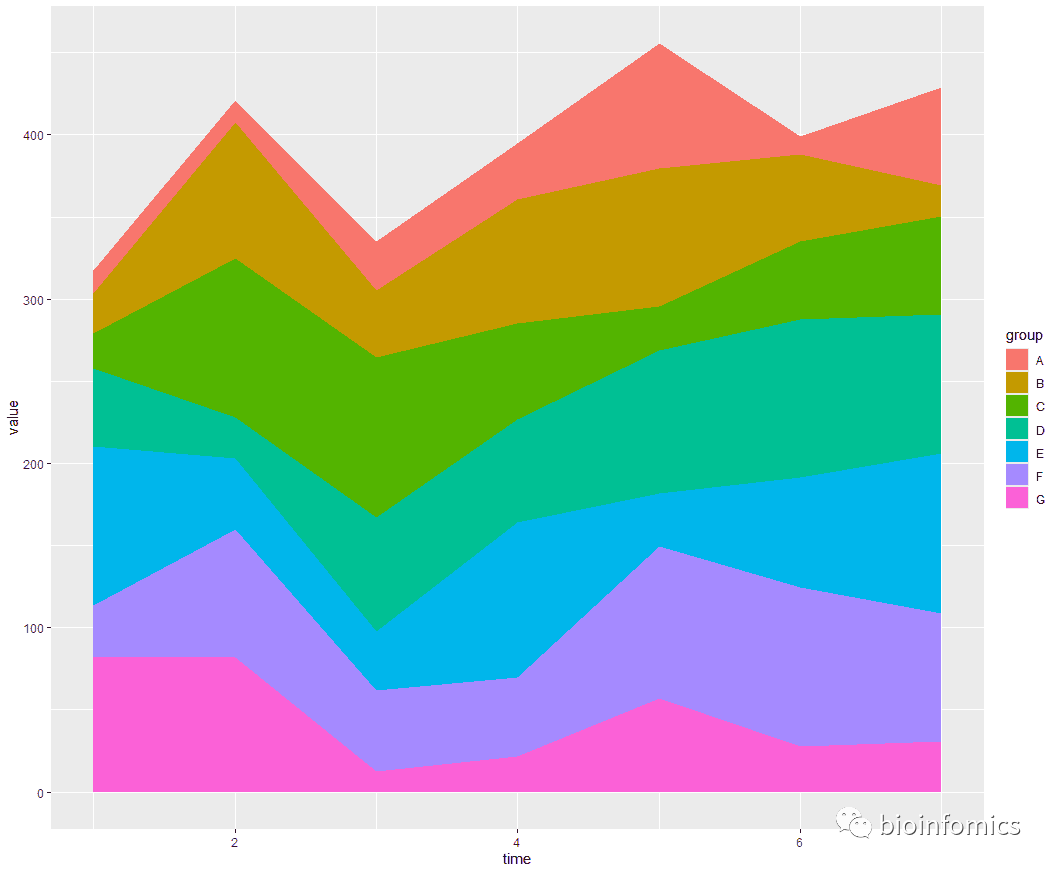
# 绘制堆叠面积图
library(dplyr)
## Warning: package 'dplyr' was built under R version 3.6.3
##
## Attaching package: 'dplyr'
## The following objects are masked from 'package:stats':
##
##     filter, lag
## The following objects are masked from 'package:base':
##
##     intersect, setdiff, setequal, union

# 构建示例数据
time <- as.numeric(rep(seq(1,7),each=7))  # x Axis
value <- runif(49, 10, 100)               # y Axis
group <- rep(LETTERS[1:7],times=7)        # group, one shape per group
data <- data.frame(time, value, group)
head(data)
##   time    value group
## 1    1 89.38125     A
## 2    1 98.02650     B
## 3    1 89.63381     C
## 4    1 96.27630     D
## 5    1 44.17764     E
## 6    1 97.44857     F

# 绘制基础堆叠面积图
ggplot(data, aes(x=time, y=value, fill=group)) +
  geom_area()
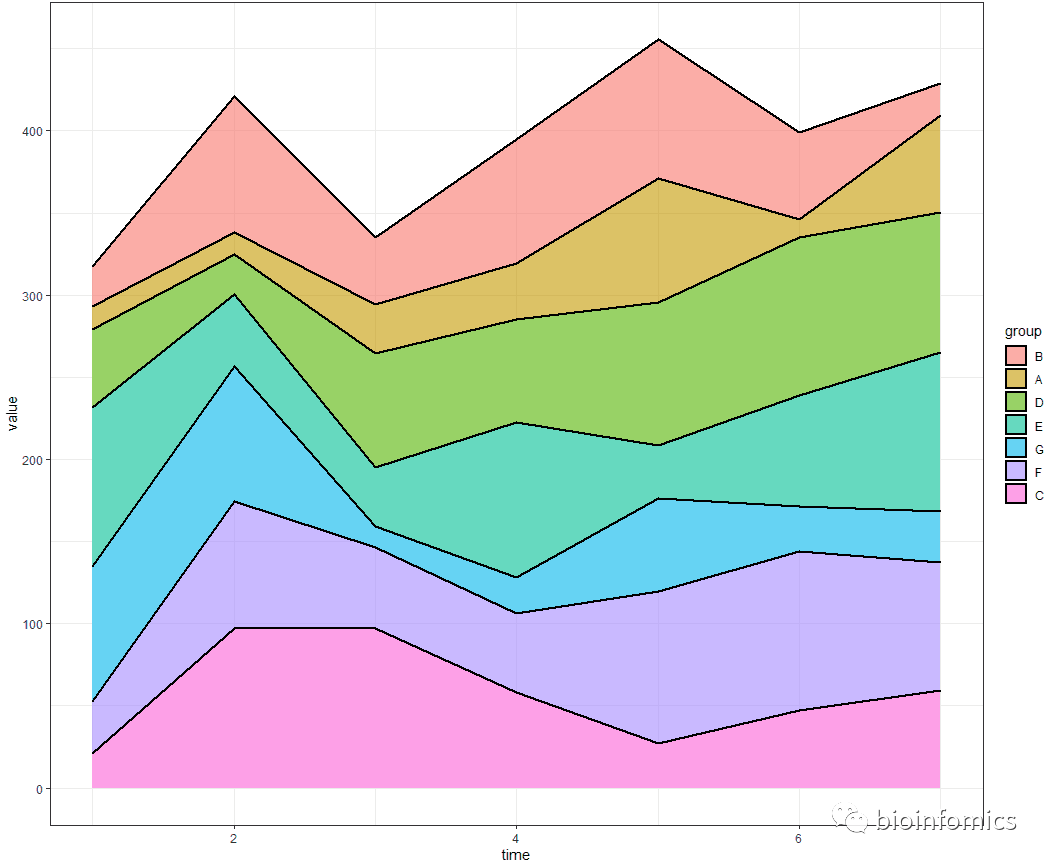
# 指定顺序进行堆叠
data$group <- factor(data$group, levels=c("B", "A", "D", "E", "G", "F", "C"))

# Plot again
ggplot(data, aes(x=time, y=value, fill=group)) +
  geom_area(color="black",alpha=0.6,size=1) + theme_bw()
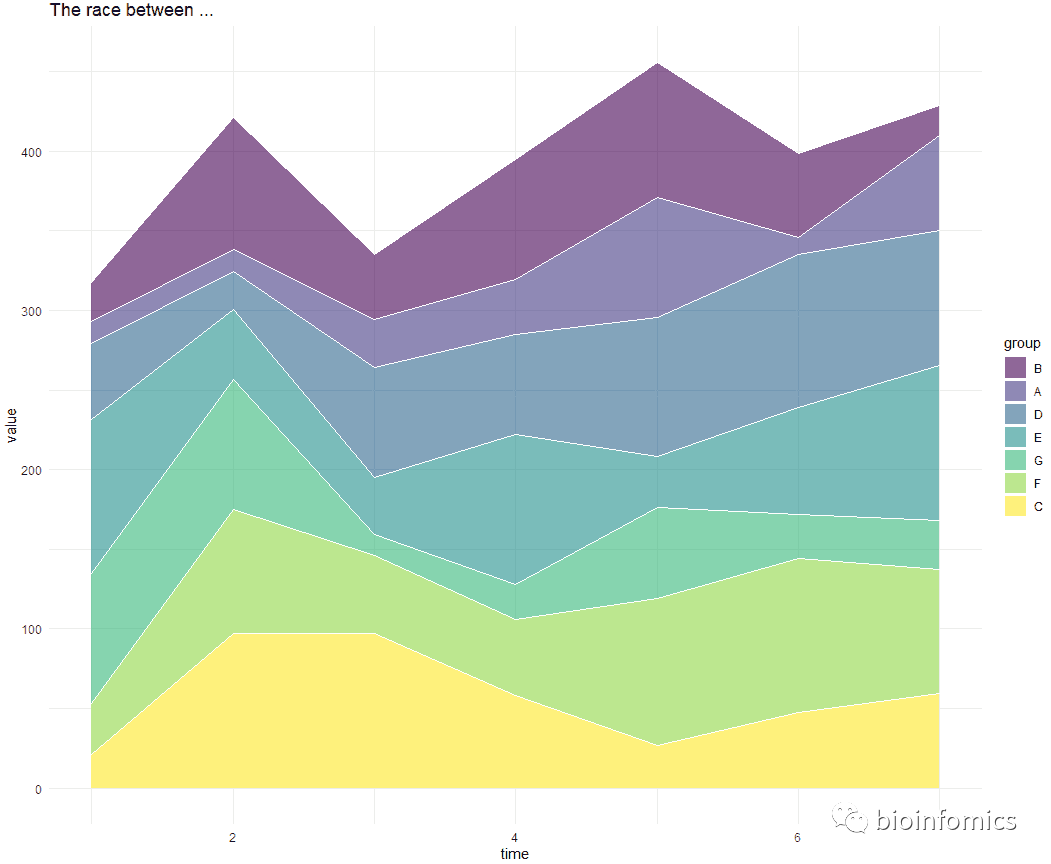
# 更换填充色和主题
library(viridis)
## Loading required package: viridisLite

ggplot(data, aes(x=time, y=value, fill=group)) +
  geom_area(alpha=0.6 , size=.5, colour="white") +
  scale_fill_viridis(discrete = T) +
  theme_minimal() +
  ggtitle("The race between ...")
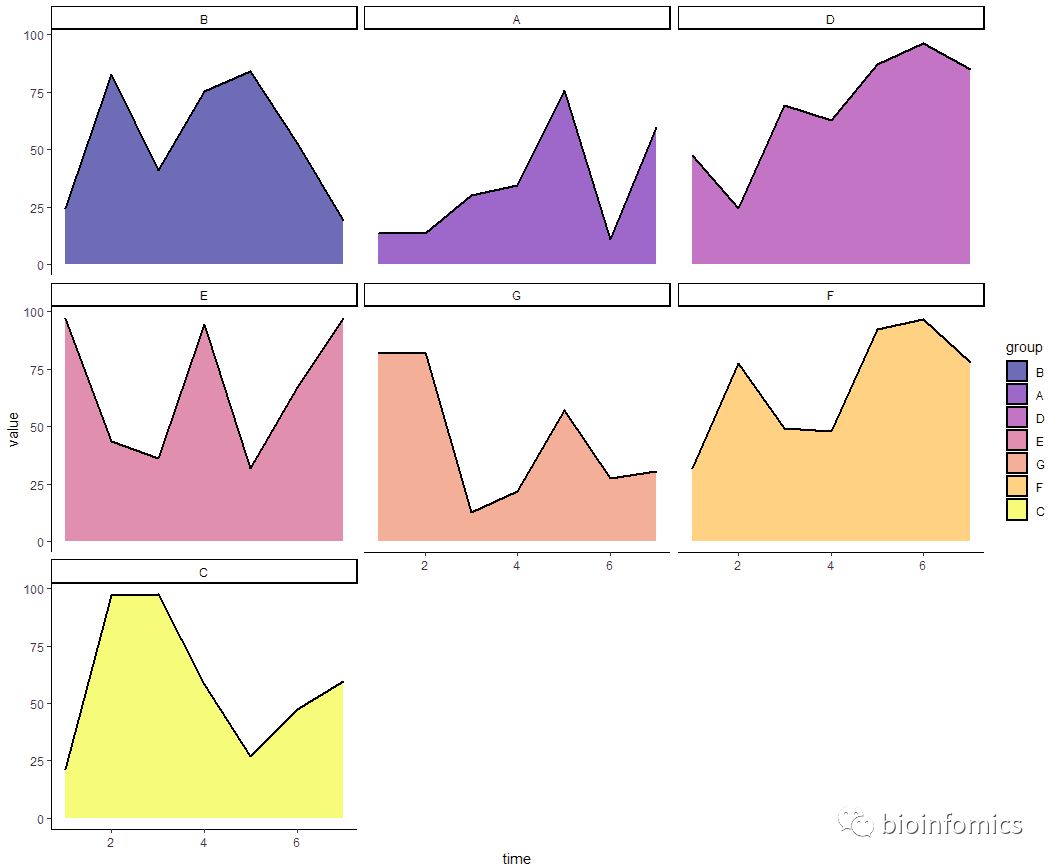
# 进行分面展示
ggplot(data, aes(x=time, y=value, fill=group)) +
  geom_area(alpha=0.6 , size=.8, colour="black") +
  scale_fill_viridis(option = "C",discrete = T) +
  theme_classic() + facet_wrap(.~group,ncol = 3)
sessionInfo()
## R version 3.6.0 (2019-04-26)
## Platform: x86_64-w64-mingw32/x64 (64-bit)
## Running under: Windows 10 x64 (build 18363)
##
## Matrix products: default
##
## locale:
## [1] LC_COLLATE=Chinese (Simplified)_China.936
## [2] LC_CTYPE=Chinese (Simplified)_China.936
## [3] LC_MONETARY=Chinese (Simplified)_China.936
## [4] LC_NUMERIC=C
## [5] LC_TIME=Chinese (Simplified)_China.936
##
## attached base packages:
## [1] stats     graphics  grDevices utils     datasets  methods   base
##
## other attached packages:
## [1] viridis_0.5.1     viridisLite_0.3.0 dplyr_1.0.2       ggplot2_3.3.2
##
## loaded via a namespace (and not attached):
##  [1] Rcpp_1.0.5       knitr_1.23       magrittr_1.5     tidyselect_1.1.0
##  [5] munsell_0.5.0    colorspace_1.4-1 R6_2.4.0         rlang_0.4.7
##  [9] stringr_1.4.0    tools_3.6.0      grid_3.6.0       gtable_0.3.0
## [13] xfun_0.8         withr_2.1.2      htmltools_0.3.6  yaml_2.2.0
## [17] digest_0.6.20    lifecycle_0.2.0  tibble_2.1.3     crayon_1.3.4
## [21] gridExtra_2.3    purrr_0.3.2      vctrs_0.3.2      glue_1.4.2
## [25] evaluate_0.14    rmarkdown_1.13   labeling_0.3     stringi_1.4.3
## [29] compiler_3.6.0   pillar_1.4.2     generics_0.0.2   scales_1.0.0
## [33] pkgconfig_2.0.2

END


文章转载自bioinfomics,如果涉嫌侵权,请发送邮件至:contact@modb.pro进行举报,并提供相关证据,一经查实,墨天轮将立刻删除相关内容。
