


25. 曼哈顿图绘制
清除当前环境中的变量
rm(list=ls())
设置工作目录
setwd("C:/Users/Dell/Desktop/R_Plots/25manhattan/")
使用qqman包绘制曼哈顿图
# 安装并加载所需的R包
# install.packages("qqman")
library(qqman)
##
## For example usage please run: vignette('qqman')
##
## Citation appreciated but not required:
## Turner, S.D. qqman: an R package for visualizing GWAS results using Q-Q and manhattan plots. biorXiv DOI: 10.1101/005165 (2014).
##

# 查看内置示例数据
head(gwasResults)
##   SNP CHR BP         P
## 1 rs1   1  1 0.9148060
## 2 rs2   1  2 0.9370754
## 3 rs3   1  3 0.2861395
## 4 rs4   1  4 0.8304476
## 5 rs5   1  5 0.6417455
## 6 rs6   1  6 0.5190959

# 使用manhattan函数绘制曼哈顿图
manhattan(gwasResults)

# 调整参数
manhattan(gwasResults,
          main = "Manhattan Plot", #设置主标题
          ylim = c(0, 10), #设置y轴范围
          cex = 0.6, #设置点的大小
          cex.axis = 0.9, #设置坐标轴字体大小
          col = c("blue4", "orange3","red"), #设置散点的颜色
          suggestiveline = F, genomewideline = F, #remove the suggestive and genome-wide significance lines
          chrlabs = c(paste0("chr",c(1:20)),"P","Q") #设置x轴染色体标签名
          )

# 提取特定染色体的数据绘图
manhattan(subset(gwasResults, CHR == 1))

# 查看感兴趣的snp信息
head(snpsOfInterest)
## [1] "rs3001" "rs3002" "rs3003" "rs3004" "rs3005" "rs3006"
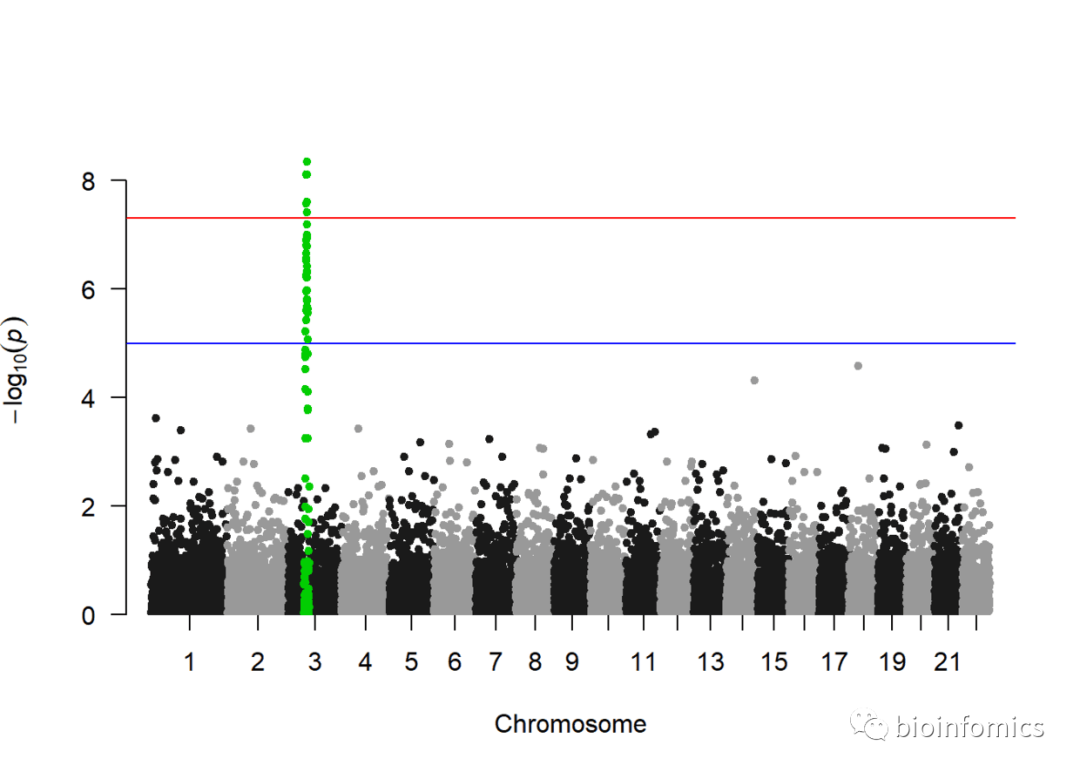
# 使用highlight参数高亮感兴趣的snp位点
manhattan(gwasResults, highlight = snpsOfInterest)
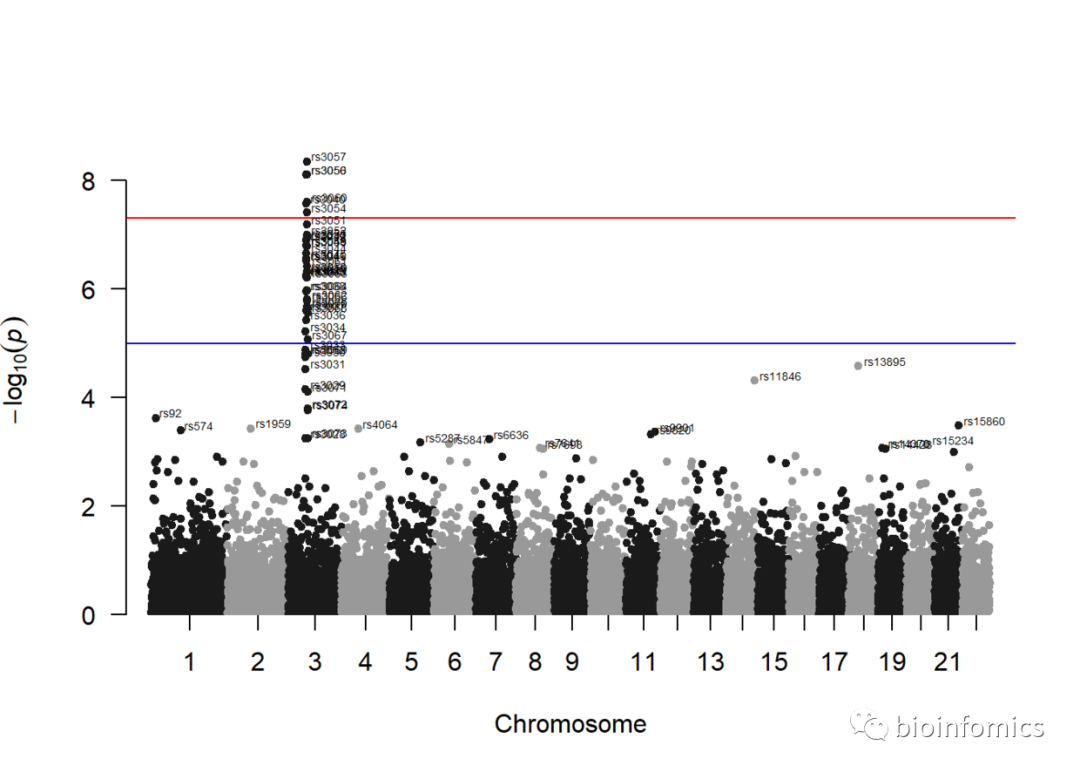
# 注释pval超过指定阈值的snp位点
manhattan(gwasResults, annotatePval = 0.001, annotateTop = F)
使用CMplot包绘制曼哈顿图
# 安装并加载所需的R包
# install.packages("CMplot")
library(CMplot)
## Full description, Bug report, Suggestion and the latest codes:
## https://github.com/YinLiLin/R-CMplot

#加载并查看示例数据
data(pig60K)
head(pig60K)
##           SNP Chromosome Position    trait1     trait2     trait3
## 1 ALGA0000009          1    52297 0.7738187 0.51194318 0.51194318
## 2 ALGA0000014          1    79763 0.7738187 0.51194318 0.51194318
## 3 ALGA0000021          1   209568 0.7583016 0.98405289 0.98405289
## 4 ALGA0000022          1   292758 0.7200305 0.48887140 0.48887140
## 5 ALGA0000046          1   747831 0.9736840 0.22096836 0.22096836
## 6 ALGA0000047          1   761957 0.9174565 0.05753712 0.05753712

# 使用CMplot函数绘制曼哈顿图
# 绘制圆形曼哈顿图
CMplot(pig60K,plot.type="c",r=0.5,
       threshold=c(0.01,0.05)/nrow(pig60K),cex = 0.5,
       threshold.col = c("red","orange"), threshold.lty = c(1,2),amplify = T, cir.chr.h = 2,
       signal.cex = c(2,2), signal.pch = c(19,20), signal.col=c("red","green"),outward=TRUE)
## [1] "Circular_Manhattan Plotting trait1..."
## [1] "Circular_Manhattan Plotting trait2..."
## [1] "Circular_Manhattan Plotting trait3..."
## [1] "Plots are stored in: C:/Users/Dell/Desktop/R_Plots/25manhattan"

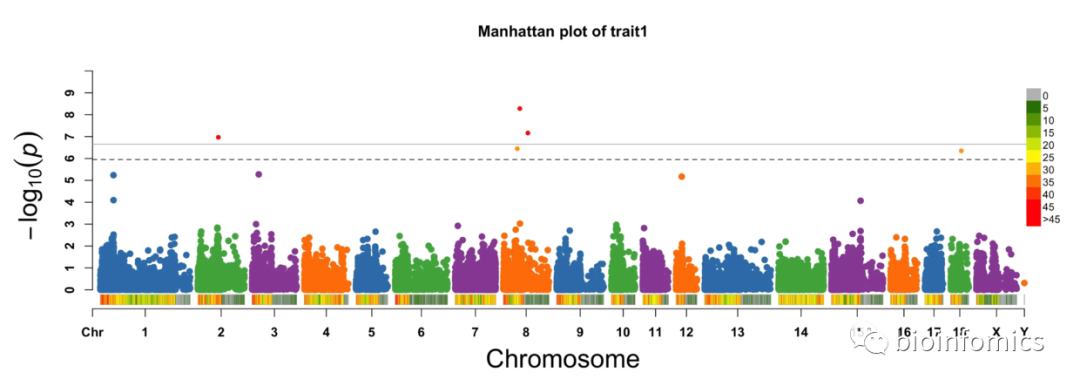
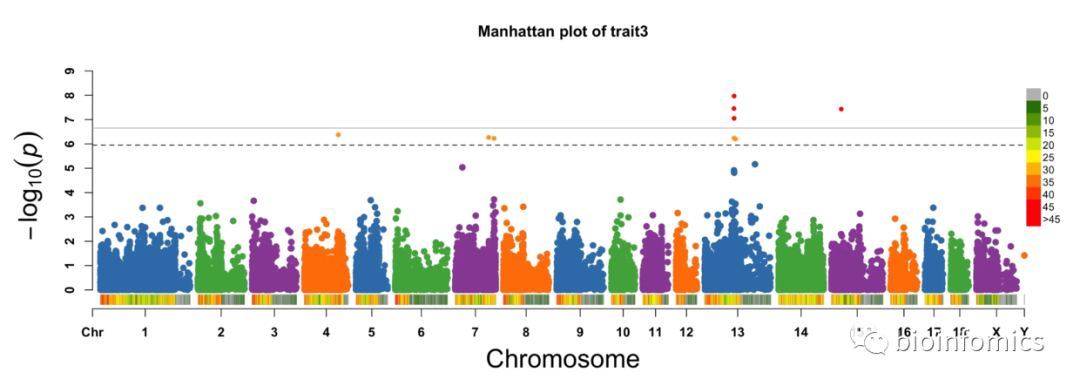
# 绘制单性状曼哈顿图
CMplot(pig60K,plot.type = "m",
       threshold = c(0.01,0.05)/nrow(pig60K),
       threshold.col=c('grey','black'),
       threshold.lty = c(1,2),threshold.lwd = c(1,1), amplify = T,
       signal.cex = c(1,1), signal.pch = c(20,20),signal.col = c("red","orange"))
## [1] "Rectangular_Manhattan Plotting trait1..."
## [1] "Rectangular_Manhattan Plotting trait2..."
## [1] "Rectangular_Manhattan Plotting trait3..."
## [1] "Plots are stored in: C:/Users/Dell/Desktop/R_Plots/25manhattan"

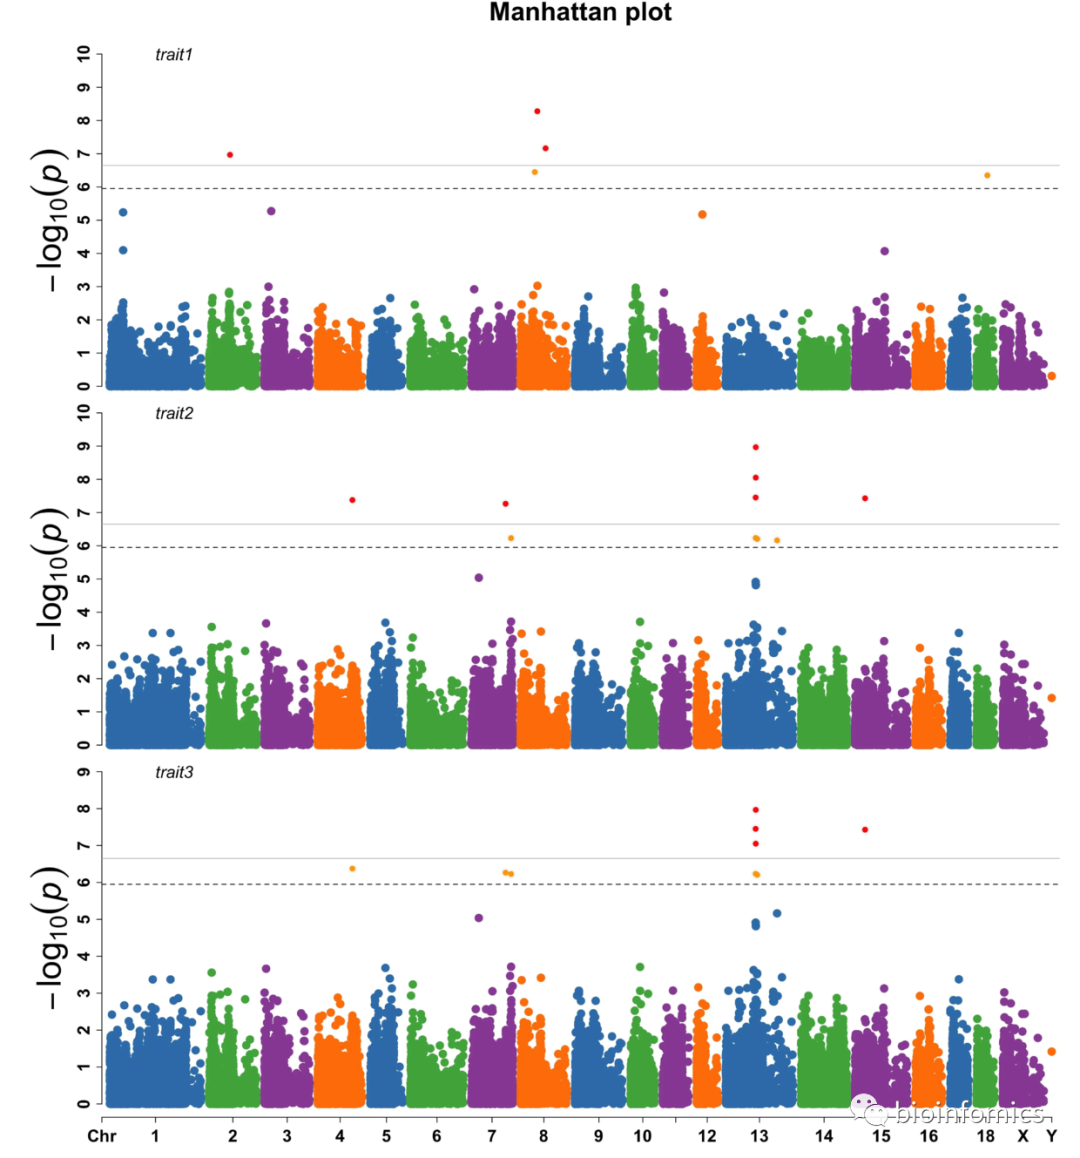
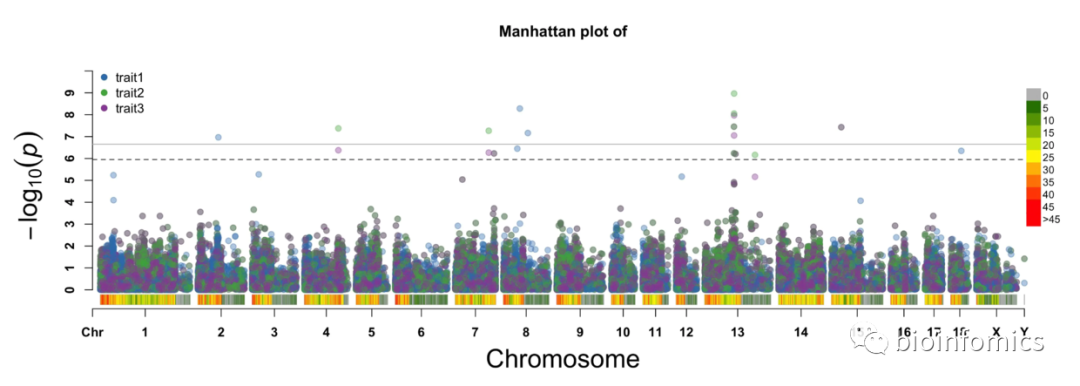
# 绘制多性状曼哈顿图
CMplot(pig60K,plot.type = "m",
       threshold = c(0.01,0.05)/nrow(pig60K),
       threshold.col=c('grey','black'),
       threshold.lty = c(1,2),threshold.lwd = c(1,1), amplify = T,
       multracks = T,
       signal.cex = c(1,1), signal.pch = c(20,20),signal.col = c("red","orange"))
## [1] "Multracks_Rectangular Plotting trait1..."
## [1] "Multracks_Rectangular Plotting trait2..."
## [1] "Multracks_Rectangular Plotting trait3..."
## [1] "Multraits_Rectangular Plotting..."
## [1] "Plots are stored in: C:/Users/Dell/Desktop/R_Plots/25manhattan"
sessionInfo()
## R version 3.6.0 (2019-04-26)
## Platform: x86_64-w64-mingw32/x64 (64-bit)
## Running under: Windows 10 x64 (build 18363)
##
## Matrix products: default
##
## locale:
## [1] LC_COLLATE=Chinese (Simplified)_China.936
## [2] LC_CTYPE=Chinese (Simplified)_China.936
## [3] LC_MONETARY=Chinese (Simplified)_China.936
## [4] LC_NUMERIC=C
## [5] LC_TIME=Chinese (Simplified)_China.936
##
## attached base packages:
## [1] stats     graphics  grDevices utils     datasets  methods   base
##
## other attached packages:
## [1] CMplot_3.3.3 qqman_0.1.4
##
## loaded via a namespace (and not attached):
##  [1] compiler_3.6.0  magrittr_1.5    tools_3.6.0     htmltools_0.3.6
##  [5] yaml_2.2.0      Rcpp_1.0.5      calibrate_1.7.2 stringi_1.4.3
##  [9] rmarkdown_1.13  knitr_1.23      stringr_1.4.0   xfun_0.8
## [13] digest_0.6.20   evaluate_0.14

END


文章转载自bioinfomics,如果涉嫌侵权,请发送邮件至:contact@modb.pro进行举报,并提供相关证据,一经查实,墨天轮将立刻删除相关内容。
