


1 背景
之前文章介绍过通过Clickhouse展示MySQL的审计日志(基于ck+redash构建MySQL慢日志+审计日志展示平台),实时拉取审计日志文件到clickhouse的工具是Clicktail(Clicktail部署文档)。
公司最近引入了Doris,开始尝试将审计日志拉取到Doris,并通过redash看板展示。
2 思路
Doris官方文档-生态扩展 里提供了beats插件:Beats Doris Output Plugin
这里主要使用filebeat工具实现
Beats Doris Output Plugin
这是 elastic beats 的输出实现,支持 Filebeat, Metricbeat, Packetbeat, Winlogbeat, Auditbeat, Heartbeat 到 Apache Doris。

该插件用于 beats 输出数据到 Doris,使用 HTTP 协议与 Doris FE Http 接口交互,并通过 Doris 的 stream load 的方式进行数据导入.

了解Doris Stream Load

了解更多关于Doris

兼容性
此插件是使用 Beats 7.3.1 开发和测试的
部署、配置和示例参考文档描述即可。
配置示例如下:
# cat filebeat_audit_3306.yml
logging.level: info
logging.to_files: true
logging.files:
  path: /path/filebeat/logs/
  name: filebeat.log
  keepfiles: 7
  permissions: 0640

filebeat.inputs:
  - type: log
    enabled: true
    paths:
      - /path2/server_audit.log
      #- /tmp/doris.json

#queue.mem:
#  events: 10000
#  flush.min_events: 10000
#  flush.timeout: 5s

output.doris:
  fenodes: ["http://xxxxxxxx:8030"] # your doris fe address
  user: xxx # your doris user
  password: xxx # your doris password
  database: clicktail # your doris database
  table: mysql_audit_log  # your doris table
  #table: logstash_output_test2  # your doris table
  #bulk_max_size: 1000000

  codec_format_string: "%{[message]}"
  headers:
    format: json
    jsonpaths: xxxxxxxxxxxxxxxxxxxxxxxxxxxxxxxxxx
    read_json_by_line: true
columns : xxxxxxxxxxxxxxxxxxxxxxxxxxxxxxxxxxjsonpath和columns配置参考:JSON Path 和 Columns
3 测试
启动filebeat,doris的clicktail.mysql_audit_log表里可以看到有记录进来。
select * from mysql_audit_log order by _time desc limit 5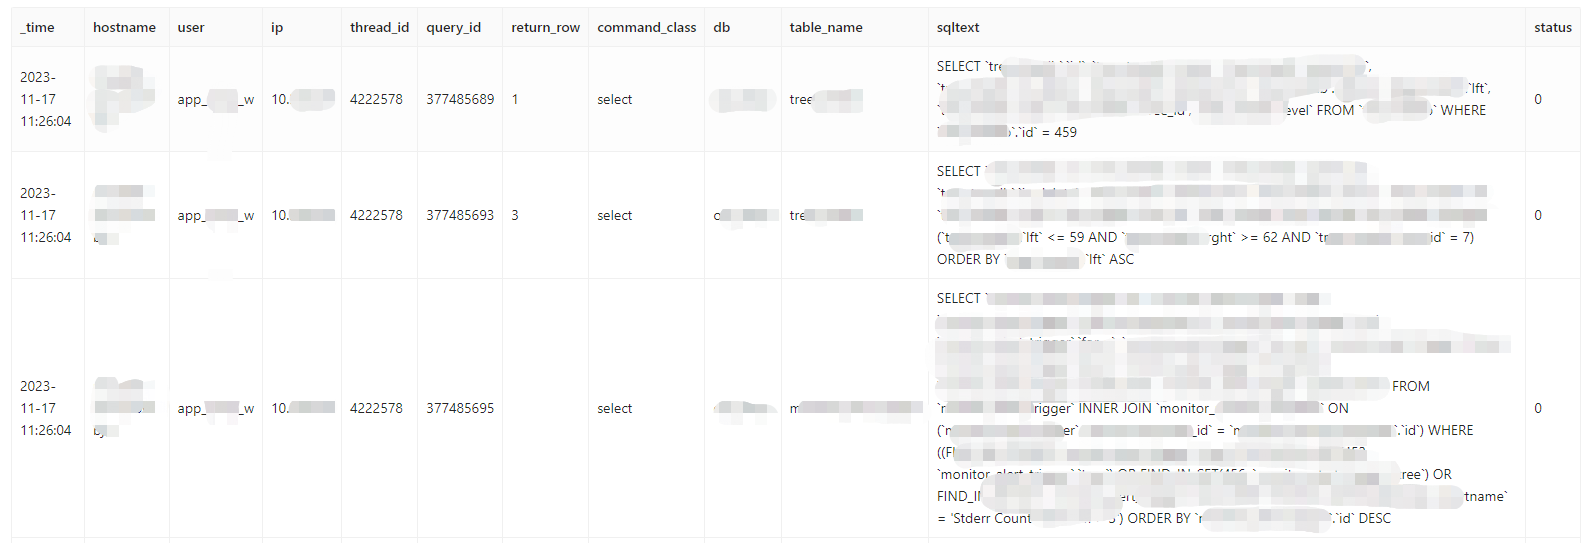
4 问题
MySQL版本时5.7.22,之前使用的审计日志插件是MariaDB Audit Plugin,它生成的日志文件(格式为txt)中,第一列日期格式类似 20231112 10:24:20,因为不是标准timestamp格式,filebeat始终匹配不了。
最终换成了Mcafee(Mcafee审计日志插件),生成日志格式为json,内容如下
{"msg-type":"activity","date":"1369155747373","thread-id":"6439","query-id":"0","user":"debian-sys-maint","priv_user":"debian-sys-maint","host":"localhost","cmd":"Connect","query":"Connect"}
{"msg-type":"activity","date":"1369155747373","thread-id":"6439","query-id":"219309","user":"debian-sys-maint","priv_user":"debian-sys-maint","host":"localhost","cmd":"Quit","query":"Quit"}
{"msg-type":"activity","date":"1369155747383","thread-id":"6440","query-id":"0","user":"debian-sys-maint","priv_user":"debian-sys-maint","host":"localhost","cmd":"Connect","query":"Connect"}
这样就可以了。
还有一个问题,Mcafee生成的日志没法自动切割,需要配合logrorate工具进行切割。本身数据库就部署了logrorate来切割慢查询和错误日志,改造一下脚本就行了。
cat /etc/logrotate.d/mysql
# The log file name and location can be set in
# /etc/my.cnf by setting the "log-error" option
# in either [mysqld] or [mysqld_safe] section as
# follows:
#
# [mysqld]
# log-error=/path/mysql/logs/error.log
#
# In case the root user has a password, then you
# have to create a /root/.my.cnf configuration file
# with the following content:
#
# [mysqladmin]
# password = <secret>
# user= root
#
# where "<secret>" is the password.
#
# ATTENTION: The /root/.my.cnf file should be readable
# _ONLY_ by root !

/path/errorlog/*.log
/path/slowlog/*.log
/path/auditlog/*.log
{
        # create 600 mysql mysql
        notifempty
        daily
        rotate 5
        missingok
        compress
    postrotate
	# just if mysqld is really running
	if test -x /usr/local/mysql/bin/mysqladmin && \
	   /usr/local/mysql/bin/mysqladmin ping &>/dev/null
	then
	   /usr/local/mysql/bin/mysqladmin flush-logs
       /usr/local/mysql/bin/mysql -uxxx -p'xxx' -e "set global audit_json_file_flush=on"
	fi
    endscript
}
「喜欢这篇文章,您的关注和赞赏是给作者最好的鼓励」
关注作者
【版权声明】本文为墨天轮用户原创内容,转载时必须标注文章的来源(墨天轮),文章链接,文章作者等基本信息,否则作者和墨天轮有权追究责任。如果您发现墨天轮中有涉嫌抄袭或者侵权的内容,欢迎发送邮件至:contact@modb.pro进行举报,并提供相关证据,一经查实,墨天轮将立刻删除相关内容。
