


大家好,今天我们聊聊POSTGRES 的并行查询。
熟悉ORACLE的朋友们都知道PARALLEL的应用场景: 1.大报表的并行查询 select 语句 2.DBA 运维工作:create table as & create index 时候的并行DDL 3. Batch job 或者ETL之类的: merge & update & insert & delete 之类的并行DML
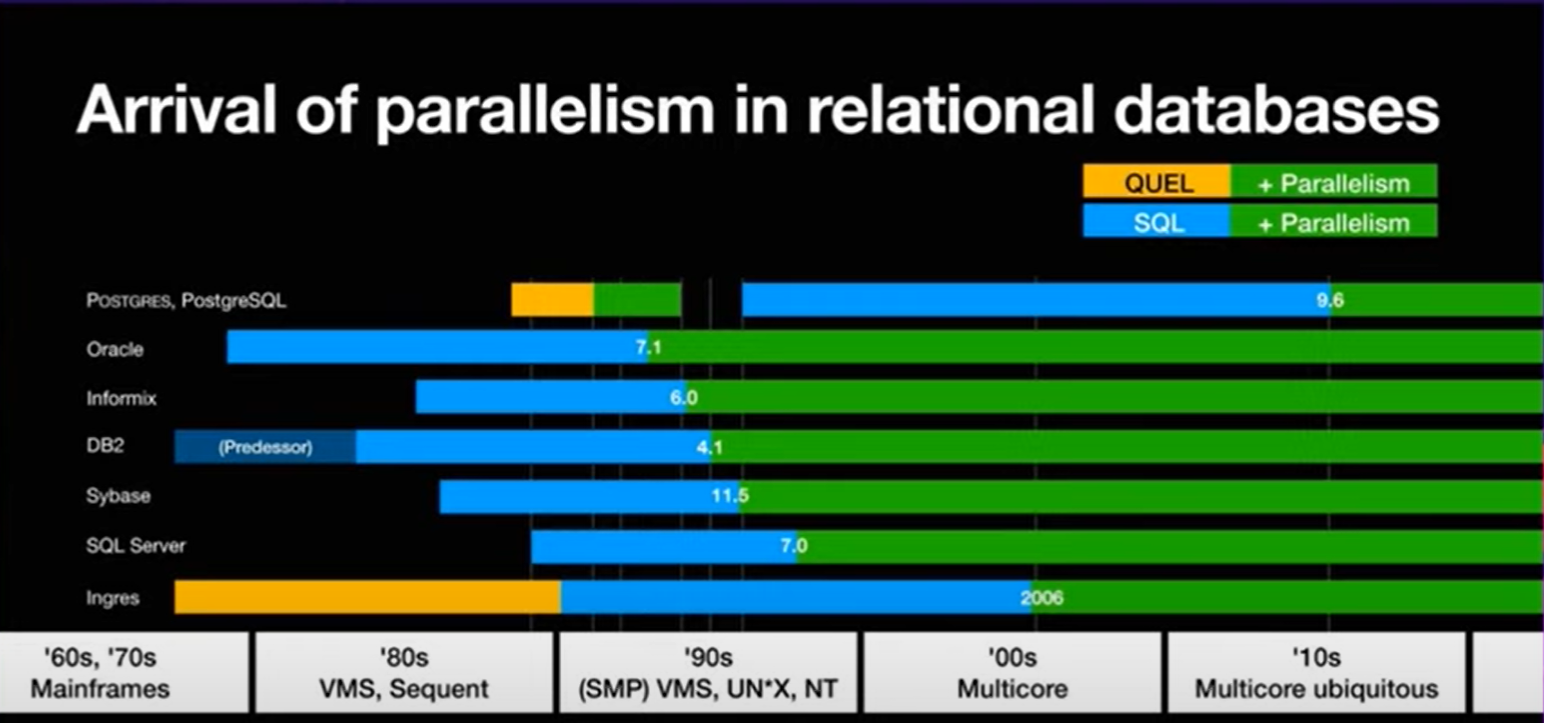
大家可以看到业界商业数据库对并行支持的历史:我们熟悉ORACLE是从7.1开始的,DB2从4.1版本…
PG 最早是在9.x的版本中推出了对parallel的支持: 主要由下面几个参数决定并行度的大小。
并行度开启控制参数:
| 参数名称 | 参数解释 |
|---|---|
| max_worker_processes | 最大后台进程总数,默认为8个,修改此参数需要重启实例 |
| max_parallel_workers | 最大并行的worker数量,默认为8个,这个数值要小于max_worker_processes |
| max_parallel_workers_per_gather | 每个gather node 发起的最大worker 数量,默认是2,设置为0表示禁止并行。这个参数是从max_worker_processes的进程池中取得进程,同时执行的parallel 进程总数受限于max_parallel_workers(小于等于)默认情况下,每个SQL占用2个worker process的话, 只能同时运行 8/2= 4个并行SQL语句。 |
| max_parallel_maintenance_workers | 创建索引(这里指的是B tree)或者 VACUUM的时候的并行 worker 的数量。这个参数同样是从max_worker_processes的进程池中去的进程,同时执行的parallel 进程总数受限于max_parallel_workers(小于等于)默认值是2 |
并行degree计算相关参数:(parallel worker 的计算)
| 参数名称 | 参数解释 |
|---|---|
| min_parallel_table_scan_size | 优化器考虑并行扫描table data的最小数据单元。默认是8MB。 也就是默认1024个page(8KB) |
| min_parallel_index_scan_size | 优化器考虑并行扫描index data的最小数据单元。默认是512KB。 也就是默认64个page(8KB) |
计算公式: 稍后会有具体的例子演示这个计算规则
并行成本:为优化器提供参考
| 参数名称 | 参数解释 |
|---|---|
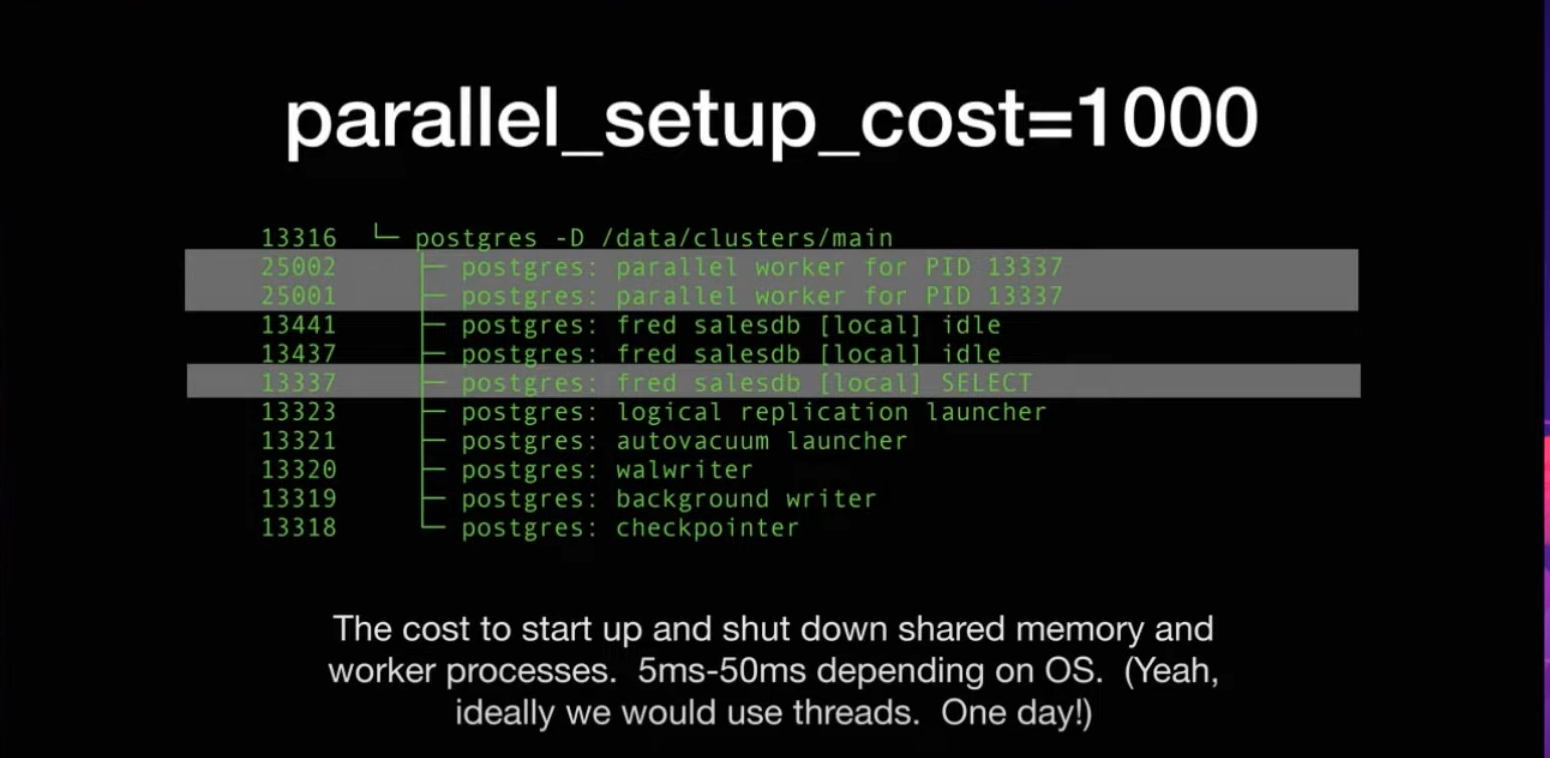
| parallel_setup_cost | 优化器启动一个worker process进程的时候,考虑到的成本。优化器认为进程是expensive的 |
| parallel_tuple_cost | 一行记录从worker节点 传递到 gather 节点,优化器考虑的成本 |
| force_parallel_mode(DEVELOPER PARAMETER) | 这个是给开发者的参数,让优化器强制走并行模式(single copy模式)而不考虑上面2个成本的参数。这个参数只是开发者调试参数的一个开关,并不是SQL优化的一个手段。) |

我们先来测试一下为大表创建索引添加并行度:
选择一个10GB+的表,行数在7-8千万:
cappcore=# select pg_size_pretty(pg_table_size('lm_device'));
pg_size_pretty
----------------
11 GB
(1 row)

cappcore=#  select count(1) from lm_device;
 count
----------
78989687
(1 row)
我们现在创建一个索引:设置设置为并行度为1. 内存为1GB
(这里需要注意,修改max_parallel_workers_per_gather 对创建索引和vacuum数据库维护类的命令并不生效)
修改max_parallel_workers_per_gather对SQL 查询语句的parallel work 生效
修改max_parallel_workers 对创建索引和vacuum数据库维护类生效
cappcore=# set max_parallel_workers=1;
SET
Time: 0.960 ms
cappcore=# SET maintenance_work_mem TO '1GB';
SET
Time: 0.218 ms
cappcore=# create index idx_dv_device_code1 on lm_device(dv_device_code);


...
我们可以通过pg_stats_activity 来确定后台parallel worker的数量:可以看到我们的设置生效只有1个backend_type = ‘parallel worker’;
postgres=# select * from pg_stat_activity where application_name='psql' and backend_type = 'parallel worker';
datid | datname  |  pid  | leader_pid | usesysid | usename | application_name | client_addr | client_hostname | client_port |
backend_start         |          xact_start           |          query_start          |         state_change          | wait_event_typ
e | wait_event | state  | backend_xid | backend_xmin | query_id |                             query                              |  ba
ckend_type
-------+----------+-------+------------+----------+---------+------------------+-------------+-----------------+-------------+--------
----------------------+-------------------------------+-------------------------------+-------------------------------+---------------
--+------------+--------+-------------+--------------+----------+----------------------------------------------------------------+----
-------------
16576 | cappcore | 37197 |      21216 |    16577 | capp_lm | psql             |             |                 |             | 2023-11
-19 18:11:43.23689+08 | 2023-11-19 18:11:43.234591+08 | 2023-11-19 18:11:43.234591+08 | 2023-11-19 18:11:43.244948+08 |
 |            | active |             |      4039436 |          | create index idx_dv_device_code1 on lm_device(dv_device_code); | par
allel worker
(1 row)
我们可以通过pg_stat_progress_create_index来观察创建索引的进度:
postgres=# SELECT
postgres-#   now()::TIME(0),
postgres-#   a.query,
postgres-#   p.phase,
postgres-#   case when p.blocks_total = 0 then
postgres-#   'index tuple buliding...'
postgres-#   when  p.blocks_total > 0 then
postgres-#   'block scanning...'
postgres-#   end as "index bulid phase",
postgres-#   case when p.blocks_total = 0 then
postgres-#   round(p.tuples_done / p.tuples_total::numeric * 100, 2)
postgres-#   when  p.blocks_total > 0 then
postgres-#   round(p.blocks_done / p.blocks_total::numeric * 100, 2)
postgres-#   end as "% completed",
postgres-#   p.blocks_total,
postgres-#   p.blocks_done,
postgres-#   p.tuples_total,
postgres-#   p.tuples_done,
postgres-#   ai.schemaname,
postgres-#   ai.relname,
postgres-#   ai.indexrelname
postgres-# FROM pg_stat_progress_create_index p
postgres-# JOIN pg_stat_activity a ON p.pid = a.pid
postgres-# LEFT JOIN pg_stat_all_indexes ai on ai.relid = p.relid AND ai.indexrelid = p.index_relid;
  now    |                             query                              |             phase              | index bulid phase | % co
mpleted | blocks_total | blocks_done | tuples_total | tuples_done | schemaname | relname | indexrelname
----------+----------------------------------------------------------------+--------------------------------+-------------------+-----
--------+--------------+-------------+--------------+-------------+------------+---------+--------------
18:17:29 | create index idx_dv_device_code1 on lm_device(dv_device_code); | building index: scanning table | block scanning... |
 26.66 |      1433316 |      382130 |            0 |           0 |            |         |
(1 row)
我们看到了最后的耗时是 459584.971 ms (07:39.585)
cappcore=# create index idx_dv_device_code1 on lm_device(dv_device_code);
CREATE INDEX
Time: 459584.971 ms (07:39.585)
我们把并行度设置为4, 再次创建索引:Time: 295703.176 ms (04:55.703)
速度上有了接近80%的提升。
(通常为了达到速度的最优,还需要手动设置增大maintenance_work_mem,为了试验的单一变量性,这里2次试验都是maintenance_work_mem=1GB,
为了创建索引性能的提高,可以根据自己的机器环境,maintenance_work_mem增大到2G-8G)
这里注意的是 maintenance_work_mem 是 一条create index 语句中所有parallel woker 进程的内存总和的上限,并不是每一个parallel worker独立分配的内存。
cappcore=# set max_parallel_workers=4;
SET
Time: 0.448 ms
cappcore=# create index idx_dv_device_code1 on lm_device(dv_device_code);
CREATE INDEX
Time: 295703.176 ms (04:55.703)
我们可以看到索引再读取block的时候是可以开启parallel worker的
postgres=# select * from pg_stat_activity where application_name='psql' and backend_type = 'parallel worker';
datid | datname  |  pid  | leader_pid | usesysid | usename | application_name | client_addr | client_hostname | client_port |
backend_start         |          xact_start           |          query_start          |         state_change          | wait_event_ty
pe | wait_event | state  | backend_xid | backend_xmin | query_id |                             query                              |  b
ackend_type
-------+----------+-------+------------+----------+---------+------------------+-------------+-----------------+-------------+--------
-----------------------+-------------------------------+-------------------------------+-------------------------------+--------------
---+------------+--------+-------------+--------------+----------+----------------------------------------------------------------+---
--------------
16576 | cappcore | 40385 |      21216 |    16577 | capp_lm | psql             |             |                 |             | 2023-11
-19 18:26:21.012934+08 | 2023-11-19 18:26:21.008792+08 | 2023-11-19 18:26:21.008792+08 | 2023-11-19 18:26:21.01875+08  |
  |            | active |             |      4039521 |          | create index idx_dv_device_code1 on lm_device(dv_device_code); | pa
rallel worker
16576 | cappcore | 40384 |      21216 |    16577 | capp_lm | psql             |             |                 |             | 2023-11
-19 18:26:21.012753+08 | 2023-11-19 18:26:21.008792+08 | 2023-11-19 18:26:21.008792+08 | 2023-11-19 18:26:21.01867+08  |
  |            | active |             |      4039521 |          | create index idx_dv_device_code1 on lm_device(dv_device_code); | pa
rallel worker
16576 | cappcore | 40383 |      21216 |    16577 | capp_lm | psql             |             |                 |             | 2023-11
-19 18:26:21.012588+08 | 2023-11-19 18:26:21.008792+08 | 2023-11-19 18:26:21.008792+08 | 2023-11-19 18:26:21.018666+08 |
  |            | active |             |      4039521 |          | create index idx_dv_device_code1 on lm_device(dv_device_code); | pa
rallel worker
16576 | cappcore | 40382 |      21216 |    16577 | capp_lm | psql             |             |                 |             | 2023-11
-19 18:26:21.01233+08  | 2023-11-19 18:26:21.008792+08 | 2023-11-19 18:26:21.008792+08 | 2023-11-19 18:26:21.018681+08 |
  |            | active |             |      4039521 |          | create index idx_dv_device_code1 on lm_device(dv_device_code); | pa
rallel worker
(4 rows)
但是索引再写入Btree的叶子节点的时候是单线程的
cappcore=# select * from pg_stat_activity where application_name='psql' ;
datid | datname  |  pid  | leader_pid | usesysid | usename  | application_name | client_addr | client_hostname | client_port |
 backend_start         |          xact_start           |          query_start          |         state_change          | wait_event_t
ype | wait_event | state  | backend_xid | backend_xmin |      query_id       |                             query
       |  backend_type
-------+----------+-------+------------+----------+----------+------------------+-------------+-----------------+-------------+-------
------------------------+-------------------------------+-------------------------------+-------------------------------+-------------
----+------------+--------+-------------+--------------+---------------------+--------------------------------------------------------
--------+----------------
16576 | cappcore | 42457 |            |    16577 | capp_lm  | psql             |             |                 |          -1 | 2023-1
1-19 18:32:44.560784+08 | 2023-11-19 18:33:13.781078+08 | 2023-11-19 18:33:13.781078+08 | 2023-11-19 18:33:13.781083+08 |
   |            | active |     4039555 |      4039555 | -527452957920118200 | create index idx_dv_device_code1 on lm_device(dv_device
_code); | client backend
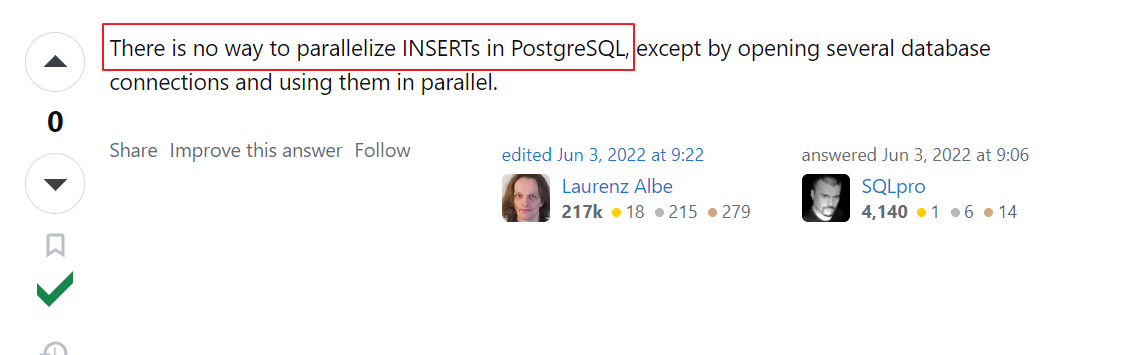
PG目前暂时不支持并行insert 写入:也从网上得到了业界大神的确认。
我们可以测试一下全表的update语句: 我们看到只能是单进程的Seq Scan on
这点和老大哥ORACLE比还是需要改进的,特别是在系统维护窗口允许时间很短的情况下,支持并行DML可以大大减小数据库操作的时间。
postgres=# set parallel_setup_cost=0;
SET
postgres=# set parallel_tuple_cost=0;
SET
postgres=# set max_parallel_workers_per_gather=2;
SET
postgres=# set max_parallel_workers=8;
SET
postgres=# show max_worker_processes;
max_worker_processes
----------------------
8
(1 row)


postgres=# explain analyze update t_parallel set name = 'jason'||name ;
                                                         QUERY PLAN
------------------------------------------------------------------------------------------------------------------------------
Update on t_parallel  (cost=0.00..63331.27 rows=0 width=0) (actual time=3453.912..3453.913 rows=0 loops=1)
  ->  Seq Scan on t_parallel  (cost=0.00..63331.27 rows=1999818 width=124) (actual time=8.498..382.794 rows=2000000 loops=1)
Planning Time: 0.137 ms
Execution Time: 3453.954 ms
(4 rows)
我们下面在来看看创建index的时候,parallel worker 的worker数量是如何计算出来的?
我们再看一个例子: 手动创建一张表,大致大小在65MB
postgres=# create table t_parallel(name varchar(50));
CREATE TABLE
postgres=# insert into t_parallel select md5(id::text) from generate_series(1,1000000) as id;
INSERT 0 1000000
postgres=# select pg_size_pretty(pg_table_size('t_parallel'));
pg_size_pretty
----------------
65 MB
(1 row)
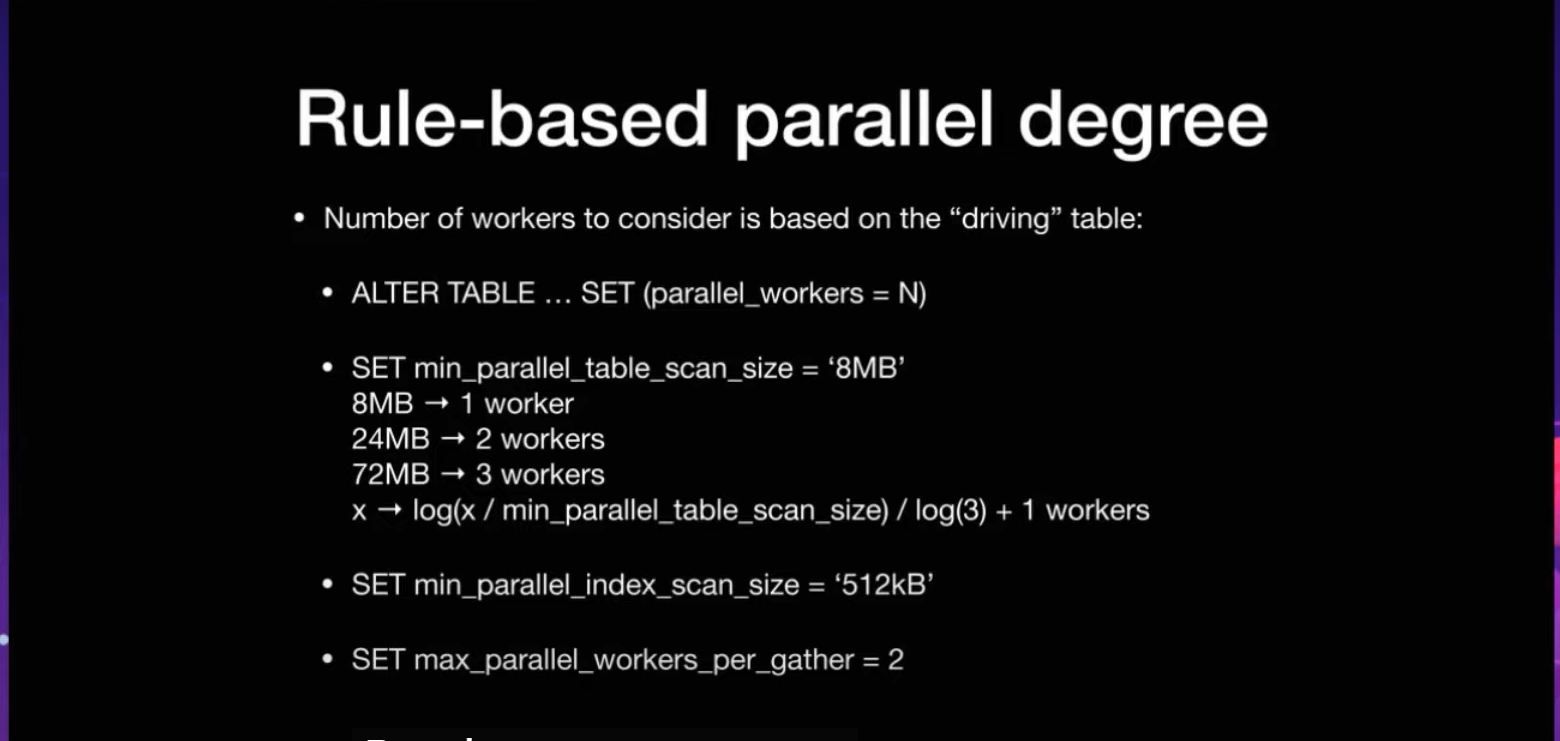
我们可以根据参数 min_parallel_table_scan_size 默认是8M 计算一下:
我们可以看到 大致的运算规律是 从8MB开始每增大3倍,就会多分配一个worker 进程
set min_parallel_table_scan_size='8MB'
8MB table => 1 worker
24MB table => 2 workers
72MB table => 3 workers
x => log(x / min_parallel_table_scan_size) / log(3) + 1 worker
表 t_parallel 大小是65 MB , 默认会分配2个work.
我们看到 Workers Planned: 2 , Workers Launched: 2 (计划分配2个worker节点,实际启动了2个worker节点)
postgres=# show max_parallel_workers;
max_parallel_workers
----------------------
8
(1 row)


postgres=# set max_parallel_workers_per_gather=2;
SET
postgres=# set parallel_setup_cost=1;
SET
postgres=# set parallel_tuple_cost=0.01;
SET
postgres=# explain analyze select count(1) from t_parallel ;
                                                                 QUERY PLAN

--------------------------------------------------------------------------------------------------------------------------------------
--------
Finalize Aggregate  (cost=13543.37..13543.38 rows=1 width=8) (actual time=45.695..48.321 rows=1 loops=1)
  ->  Gather  (cost=13543.33..13543.36 rows=2 width=8) (actual time=45.599..48.313 rows=3 loops=1)
        Workers Planned: 2
        Workers Launched: 2
        ->  Partial Aggregate  (cost=13542.33..13542.34 rows=1 width=8) (actual time=40.631..40.632 rows=1 loops=3)
              ->  Parallel Seq Scan on t_parallel  (cost=0.00..12500.67 rows=416667 width=0) (actual time=0.016..24.649 rows=333333 l
oops=3)
Planning Time: 0.054 ms
Execution Time: 48.359 ms
(8 rows)
我们继续插入记录增大表的size:130MB 符合 分配 3个worker的条件
8M -》 1 worker
24M-》 2 workers
72-》 3 workers
216M-》 4 workers
正如我们的预期出现了 Workers Planned: 3, Workers Launched: 3
postgres=# insert into t_parallel select md5(id::text) from generate_series(1,1000000) as id;
INSERT 0 1000000


postgres=# select pg_size_pretty(pg_table_size('t_parallel'));
pg_size_pretty
----------------
130 MB
(1 row)

postgres=# set max_parallel_workers_per_gather=4;
SET
postgres=# explain analyze select count(1) from t_parallel ;
                                                                 QUERY PLAN

--------------------------------------------------------------------------------------------------------------------------------------
--------
Finalize Aggregate  (cost=24732.56..24732.57 rows=1 width=8) (actual time=64.520..67.335 rows=1 loops=1)
  ->  Gather  (cost=24732.52..24732.56 rows=3 width=8) (actual time=64.429..67.328 rows=4 loops=1)
        Workers Planned: 3
        Workers Launched: 3
        ->  Partial Aggregate  (cost=24731.52..24731.53 rows=1 width=8) (actual time=60.415..60.416 rows=1 loops=4)
              ->  Parallel Seq Scan on t_parallel  (cost=0.00..23118.61 rows=645161 width=0) (actual time=0.015..36.357 rows=500000 l
oops=4)
Planning Time: 0.051 ms
Execution Time: 67.368 ms
(8 rows)
接下来,我们看一下并行成本的参数 parallel_setup_cost和parallel_tuple_cost:
默认的情况下: select * from 一张表,PG的优化器是不会开启并行的,即使表的size远远超过了8MB。
我们可以通过设置parallel_setup_cost=0和parallel_tuple_cost=0 来达到并行的目的。
postgres=# reset parallel_setup_cost;
RESET
postgres=#
RESET
postgres=# explain analyze select *  from t_parallel ;
                                                     QUERY PLAN
-----------------------------------------------------------------------------------------------------------------------
Seq Scan on t_parallel  (cost=0.00..36667.00 rows=2000000 width=33) (actual time=0.009..119.349 rows=2000000 loops=1)
Planning Time: 0.038 ms
Execution Time: 178.866 ms
(3 rows)


postgres=# set parallel_setup_cost=0;
SET
postgres=# set parallel_tuple_cost=0;
SET
postgres=# explain analyze select *  from t_parallel ;
                                                           QUERY PLAN
-----------------------------------------------------------------------------------------------------------------------------------
Gather  (cost=0.00..23118.61 rows=2000000 width=33) (actual time=0.518..166.819 rows=2000000 loops=1)
  Workers Planned: 3
  Workers Launched: 3
  ->  Parallel Seq Scan on t_parallel  (cost=0.00..23118.61 rows=645161 width=33) (actual time=0.013..36.097 rows=500000 loops=4)
Planning Time: 0.068 ms
Execution Time: 244.392 ms
(6 rows)
设置参数force_parallel_mode 强制走并行:不过只是一个假的并行
我们看见了 Workers Launched: 1,Workers Planned: 1,Single Copy: true , 这个参数只是开发者调试参数的一个开关,
并不是SQL优化的一个手段。
postgres=# reset parallel_setup_cost;
RESET
postgres=# reset parallel_tuple_cost;
RESET
postgres=# set force_parallel_mode=on;
SET
postgres=# explain analyze select *  from t_parallel ;
                                                        QUERY PLAN
-----------------------------------------------------------------------------------------------------------------------------
Gather  (cost=1000.00..237667.00 rows=2000000 width=33) (actual time=6.318..393.061 rows=2000000 loops=1)
  Workers Planned: 1
  Workers Launched: 1
  Single Copy: true
  ->  Seq Scan on t_parallel  (cost=0.00..36667.00 rows=2000000 width=33) (actual time=0.020..134.545 rows=2000000 loops=1)
Planning Time: 0.510 ms
Execution Time: 462.420 ms
(7 rows)
我们再来看一下Gather和Gather merge的区别:简单的说就是Gather merge 比Gather 多完成排序的操作, 多触发于带ORDER BY的语句
postgres=# explain analyze select *  from t_parallel order by name;
                                                              QUERY PLAN
-----------------------------------------------------------------------------------------------------------------------------------------
Gather Merge  (cost=103017.93..128824.37 rows=1935483 width=33) (actual time=1625.489..3288.426 rows=2000000 loops=1)
  Workers Planned: 3
  Workers Launched: 3
  ->  Sort  (cost=103017.89..104630.79 rows=645161 width=33) (actual time=1532.318..2044.012 rows=500000 loops=4)
        Sort Key: name
        Sort Method: external merge  Disk: 19800kB
        Worker 0:  Sort Method: external merge  Disk: 19800kB
        Worker 1:  Sort Method: external merge  Disk: 21712kB
        Worker 2:  Sort Method: external merge  Disk: 23040kB
        ->  Parallel Seq Scan on t_parallel  (cost=0.00..23118.61 rows=645161 width=33) (actual time=0.015..34.594 rows=500000 loops=4)
Planning Time: 0.259 ms
Execution Time: 3353.311 ms
(12 rows)
接下来我们看支持并行查询的种类:
对并行扫描的支持:(关于索引的并行扫描,目前只能支持btree类型的索引)
1)parallel sequential scan
2)parallel bitmap heap scan
3) parallel index scan or parallel index-only scan
parallel sequential scan并行全表扫描这个例子之前已经执行过了,执行计划对应的步骤是
Parallel Seq Scan on XXX
parallel bitmap heap scan 并行索引bitmap扫描:1.扫描索引构建bitmap的阶段是单进程,2.拆分bitmap之后,再去并行扫描page中的元祖信息
postgres=# create index idx_name on t_parallel(name);
CREATE INDEX

postgres=# set enable_indexscan = 0;
SET
postgres=# set enable_seqscan = 0;
SET
postgres=# explain analyze select *  from t_parallel where name like 'jason%';
                                                                   QUERY PLAN
--------------------------------------------------------------------------------------------------------------------------------------------------
Gather  (cost=52624.50..98400.17 rows=1999800 width=43) (actual time=150.464..322.810 rows=2000000 loops=1)
  Workers Planned: 2
  Workers Launched: 2
  ->  Parallel Bitmap Heap Scan on t_parallel  (cost=52624.50..98400.17 rows=833250 width=43) (actual time=148.208..256.153 rows=666667 loops=3)
        Filter: ((name)::text ~~ 'jason%'::text)
        Heap Blocks: exact=2319
        ->  Bitmap Index Scan on idx_name  (cost=0.00..52124.55 rows=2000000 width=0) (actual time=147.254..147.255 rows=2000000 loops=1)
Planning Time: 0.092 ms
Execution Time: 384.066 ms
(9 rows)
parallel index scan or parallel index-only scan: 并行索引扫描或者并行索引扫描(不回表)
这里表t_parallel 只有一个列name, 所以执行计划会走 Parallel Index Only Scan
postgres=# set enable_indexscan = 1;
SET
postgres=# explain analyze select *  from t_parallel where name like 'jason%';
                                                                       QUERY PLAN
----------------------------------------------------------------------------------------------------------------------------------------------------------
Gather  (cost=0.55..62541.22 rows=1999800 width=43) (actual time=0.232..212.695 rows=2000000 loops=1)
  Workers Planned: 2
  Workers Launched: 2
  ->  Parallel Index Only Scan using idx_name on t_parallel  (cost=0.55..62541.22 rows=833250 width=43) (actual time=0.044..136.113 rows=666667 loops=3)
        Filter: ((name)::text ~~ 'jason%'::text)
        Heap Fetches: 0
Planning Time: 0.080 ms
Execution Time: 273.800 ms
(8 rows)
对表连接的并行支持:
我们先创建2张表作为演示案例:
postgres=# create table inner_tab(id int primary key, name text);
CREATE TABLE
postgres=# insert into inner_tab select id , md5(id::text) from generate_series(1,1000) as id;
INSERT 0 1000
postgres=# create table outter_tab(id int, name text);
CREATE TABLE
postgres=# insert into outter_tab select id , md5(id::text) from generate_series(1,1000000) as id;
INSERT 0 1000000
nested loop join: 内表永远是non-parallel的, 每次内表都是全表进行访问(不会并行拆分),通常这里并不是全表扫描内表,而是通过索引的方式访问内表。
我们看到执行计划中外表: Parallel Seq Scan on outter_tab t1 开启了2个worker process
内表:被进行了2次的索引访问 Index Scan using inner_tab_pkey on inner_tab t2
postgres=# explain analyze select * from outter_tab as  t1 left join inner_tab as t2 on t1.id =  t2.id where  t1.id = 1;
                                                            QUERY PLAN
------------------------------------------------------------------------------------------------------------------------------------
Nested Loop Left Join  (cost=0.28..13550.64 rows=1 width=74) (actual time=0.284..32.646 rows=1 loops=1)
  Join Filter: (t1.id = t2.id)
  ->  Gather  (cost=0.00..13542.33 rows=1 width=37) (actual time=0.266..32.619 rows=1 loops=1)
        Workers Planned: 2
        Workers Launched: 2
        ->  Parallel Seq Scan on outter_tab t1  (cost=0.00..13542.33 rows=1 width=37) (actual time=17.552..27.449 rows=0 loops=3)
              Filter: (id = 1)
              Rows Removed by Filter: 333333
  ->  Index Scan using inner_tab_pkey on inner_tab t2  (cost=0.28..8.29 rows=1 width=37) (actual time=0.014..0.015 rows=1 loops=1)
        Index Cond: (id = 1)
Planning Time: 0.116 ms
Execution Time: 32.679 ms
(12 rows)
merge join: 内表永远是non-parallel的, 如果存在额外的排序工作,效率会降底,存在2次排序的现象
postgres=# explain analyze select * from outter_tab as t1 left join inner_tab as t2 on  t1.id =  t2.id and  t1.id = 100;
                                                                            QUERY PLAN
--------------------------------------------------------------------------------------------------------------------------------------------------------------------
Gather  (cost=1.39..29580.75 rows=1000000 width=74) (actual time=0.568..146.530 rows=1000000 loops=1)
  Workers Planned: 2
  Workers Launched: 2
  ->  Merge Left Join  (cost=1.39..29580.75 rows=416667 width=74) (actual time=0.373..95.348 rows=333333 loops=3)
        Merge Cond: (t1.id = t2.id)
        Join Filter: (t1.id = 100)
        Rows Removed by Join Filter: 333
        ->  Parallel Index Scan using outter_tab_pkey on outter_tab t1  (cost=0.42..28484.09 rows=416667 width=37) (actual time=0.044..59.128 rows=333333 loops=3)
        ->  Index Scan using inner_tab_pkey on inner_tab t2  (cost=0.28..47.27 rows=1000 width=37) (actual time=0.064..0.398 rows=1000 loops=3)
Planning Time: 0.641 ms
Execution Time: 181.524 ms
(11 rows)
hash join: 内表会在每个worker进程中都build一份出来,如果build 的hash table 数据量比较大,则会严重影响性能
postgres=# explain analyze select * from outter_tab as t1 left join inner_tab as t2 on  t1.id =  t2.id ;
                                                                QUERY PLAN
--------------------------------------------------------------------------------------------------------------------------------------------
Gather  (cost=31.50..13625.92 rows=1000000 width=74) (actual time=0.452..143.414 rows=1000000 loops=1)
  Workers Planned: 2
  Workers Launched: 2
  ->  Hash Left Join  (cost=31.50..13625.92 rows=416667 width=74) (actual time=0.438..88.658 rows=333333 loops=3)
        Hash Cond: (t1.id = t2.id)
        ->  Parallel Seq Scan on outter_tab t1  (cost=0.00..12500.67 rows=416667 width=37) (actual time=0.012..28.533 rows=333333 loops=3)
        ->  Hash  (cost=19.00..19.00 rows=1000 width=37) (actual time=0.248..0.249 rows=1000 loops=3)
              Buckets: 1024  Batches: 1  Memory Usage: 76kB
              ->  Seq Scan on inner_tab t2  (cost=0.00..19.00 rows=1000 width=37) (actual time=0.016..0.118 rows=1000 loops=3)
Planning Time: 0.189 ms
Execution Time: 185.877 ms
(11 rows)
parallel hash join:是基于上面hash join with hash的优化。采用了共享的hash table. (Support from PG11)
(GUC参数开关: enable_parallel_hash 默认 on)
https://git.postgresql.org/gitweb/?p=postgresql.git;a=commitdiff;h=1804284042e659e7d16904e7bbb0ad546394b6a3
- avoids wasting memory on duplicated hash tables
- avoids wasting disk space on duplicated batch files
- divides the work of building the hash table over the CPUs
我们可以看到执行计划中的Parallel Hash Join:
postgres=# create table inner_t1(id int , name text);
CREATE TABLE
postgres=#
postgres=# insert into inner_t1 select id , md5(id::text) from generate_series(1,1000000) as id;
INSERT 0 1000000
postgres=# create table inner_t2(id int , name text);
CREATE TABLE
postgres=#
postgres=# insert into inner_t2 select id , md5(id::text) from generate_series(1,1000000) as id;
INSERT 0 1000000
postgres=# explain analyze select * from inner_t1 as t1  join inner_t2 as t2 on  t1.id =  t2.id ;
                                                                  QUERY PLAN
------------------------------------------------------------------------------------------------------------------------------------------------
Gather  (cost=20965.00..46532.28 rows=1000000 width=74) (actual time=189.907..420.716 rows=1000000 loops=1)
  Workers Planned: 2
  Workers Launched: 2
  ->  Parallel Hash Join  (cost=20965.00..46532.28 rows=416667 width=74) (actual time=177.431..333.030 rows=333333 loops=3)
        Hash Cond: (t1.id = t2.id)
        ->  Parallel Seq Scan on inner_t1 t1  (cost=0.00..12500.67 rows=416667 width=37) (actual time=0.011..24.756 rows=333333 loops=3)
        ->  Parallel Hash  (cost=12500.67..12500.67 rows=416667 width=37) (actual time=83.273..83.273 rows=333333 loops=3)
              Buckets: 262144  Batches: 8  Memory Usage: 10912kB
              ->  Parallel Seq Scan on inner_t2 t2  (cost=0.00..12500.67 rows=416667 width=37) (actual time=0.014..25.644 rows=333333 loops=3)
Planning Time: 0.171 ms
Execution Time: 452.565 ms
(11 rows)
Parallel Aggregation:(并行聚合):
并行聚合分为2个阶段:1.Partial Aggregate: 阶段并行执行的work process 进行聚合的操作,
2.Finalize Aggregate: 并行聚合的结果汇总到gather或者gather merge节点进行二次聚合操作
postgres=# explain analyze select sum(t1.id+t2.id) from inner_t1 as t1  join inner_t2 as t2 on  t1.id =  t2.id ;
                                                                       QUERY PLAN

--------------------------------------------------------------------------------------------------------------------------------------
---------------------
Finalize Aggregate  (cost=36591.83..36591.84 rows=1 width=8) (actual time=303.783..310.034 rows=1 loops=1)
  ->  Gather  (cost=36591.62..36591.83 rows=2 width=8) (actual time=300.944..310.024 rows=3 loops=1)
        Workers Planned: 2
        Workers Launched: 2
        ->  Partial Aggregate  (cost=35591.62..35591.63 rows=1 width=8) (actual time=298.122..298.125 rows=1 loops=3)
              ->  Parallel Hash Join  (cost=17709.00..33508.28 rows=416667 width=8) (actual time=118.472..281.561 rows=333333 loops=3
)
                    Hash Cond: (t1.id = t2.id)
                    ->  Parallel Seq Scan on inner_t1 t1  (cost=0.00..12500.67 rows=416667 width=4) (actual time=0.011..22.869 rows=3
33333 loops=3)
                    ->  Parallel Hash  (cost=12500.67..12500.67 rows=416667 width=4) (actual time=116.125..116.126 rows=333333 loops=
3)
                          Buckets: 1048576  Batches: 1  Memory Usage: 47360kB
                          ->  Parallel Seq Scan on inner_t2 t2  (cost=0.00..12500.67 rows=416667 width=4) (actual time=0.019..35.117
rows=333333 loops=3)
Planning Time: 0.112 ms
Execution Time: 310.088 ms
(13 rows)
Parallel Append: (并行追加) : 这个算子多发生在Union all 或者分区表扫描的操作。
Union all
postgres=# explain analyze select count(1) from inner_t1
postgres-#                 union all
postgres-#                select count(1) from inner_t2 ;
                                                            QUERY PLAN
-------------------------------------------------------------------------------------------------------------------------------------
Gather  (cost=21834.00..21834.22 rows=2 width=8) (actual time=145.337..145.422 rows=2 loops=1)
  Workers Planned: 2
  Workers Launched: 2
  ->  Parallel Append  (cost=20834.00..20834.02 rows=1 width=8) (actual time=89.043..89.045 rows=1 loops=3)
        ->  Aggregate  (cost=20834.00..20834.01 rows=1 width=8) (actual time=122.159..122.160 rows=1 loops=1)
              ->  Seq Scan on inner_t2  (cost=0.00..18334.00 rows=1000000 width=0) (actual time=0.026..73.624 rows=1000000 loops=1)
        ->  Aggregate  (cost=20834.00..20834.01 rows=1 width=8) (actual time=144.966..144.967 rows=1 loops=1)
              ->  Seq Scan on inner_t1  (cost=0.00..18334.00 rows=1000000 width=0) (actual time=0.031..84.452 rows=1000000 loops=1)
Planning Time: 0.370 ms
Execution Time: 145.544 ms
(10 rows)
Partition scan:
 ->  Hash  (cost=1266598.22..1266598.22 rows=34602 width=50)
           ->  Gather  (cost=1000.00..1266598.22 rows=34602 width=50)
                 Workers Planned: 5
                 ->  Parallel Append  (cost=0.00..1262138.02 rows=6919 width=50)
                       ->  Parallel Seq Scan on t_dd_request_p2023_10 d_6  (cost=0.00..244108.29 rows=948 width=50)
                             Filter: (asset_pledge_match_result = ANY ('{2,3,4}'::integer[]))
                       ->  Parallel Seq Scan on t_dd_request_p2023_07 d_3  (cost=0.00..243318.86 rows=865 width=50)
                             Filter: (asset_pledge_match_result = ANY ('{2,3,4}'::integer[]))
                       ->  Parallel Seq Scan on t_dd_request_p2023_09 d_5  (cost=0.00..239149.48 rows=1199 width=50)
                             Filter: (asset_pledge_match_result = ANY ('{2,3,4}'::integer[]))
                       ->  Parallel Seq Scan on t_dd_request_p2023_06 d_2  (cost=0.00..216987.21 rows=1264 width=50)
                             Filter: (asset_pledge_match_result = ANY ('{2,3,4}'::integer[]))
最后我们看看有那些查询语句在原则上不支持并行模式:
1.Function Marked as PARALLEL SAFE: 标记并行安全的函数
2.Cursor in loop on pgplsql : 循环游标中的查询不支持并行
3. Clients setting max_rows parameter: 客户端设置max_rows参数,图形界面工具默认设置20,50
4.JDBC parameter preferQueryMode: JDBC 驱动设置参数 preferQueryMode,使用simple query protocol, 不可以触发并行查询
5.SERIALIZABLE transaction isolation level: 串行化的事务隔离级别
--创建一个parallel safe的函数(parallel safe:需要保证并行安全,所以不支持平行)

postgres=# create or replace function add_1000(int)
postgres-# returns void
postgres-# as
postgres-# $$
postgres$# begin
postgres$# update inner_t1 set id=id+100 where id = $1;
postgres$# end;
postgres$# $$
postgres-# language plpgsql parallel safe;
CREATE FUNCTION
--打开强制并行的参数
postgres=# set force_parallel_mode = on;
SET
--查询报错: cannot execute UPDATE during a parallel operation
postgres=# select add_1000(id) from inner_t1 where id = 1;
ERROR:  cannot execute UPDATE during a parallel operation
CONTEXT:  SQL statement "update inner_t1 set id=id+100 where id = $1"
PL/pgSQL function add_1000(integer) line 3 at SQL statement
--修改函数为parallel unsafe

postgres=# alter function add_1000 parallel unsafe;
ALTER FUNCTION
--查询执行成功
postgres=# select add_1000(id) from inner_t1 where id = 1;
add_1000
----------
(1 row)
最后我们来总结一下:
PG的并行和ORACLE的并行的区别还是很大的,主要体现在下面几点:
1.PG目前版本只能支持平行查询,暂时不支持并行的写入操作(parallel update,insert,delete)
2.PG的并行degree 的数量只能通过参数max_parallel_workers_per_gather和max_parallel_workers指定上限值,并不可以像ORACLE那样通过hint直接指定degree的个数parallel(t,4)
PG 的degree的分配是根据参数min_parallel_table_scan_size和min_parallel_index_scan_size通过公式计算出来的x => log(x / min_parallel_table_scan_size) / log(3) + 1 worker
3.PG系统默认是开启并行的max_parallel_workers_per_gather(default 2),由优化器根据成本参数parallel_setup_cost和parallel_tuple_cost来计算COST 决定是否开启并行模式
ORACLE是用户自己使用hint,或者修改 session 级别的参数来开启并且制定精确的parallel degree的个数,或者创建索引的时候直接指定 create index xxx on table parallel 4;
DBA需要根据自己的系统的类型特点来决定是否开启并行以及开启并行的degree上限:
如果是纯OLTP的短查询,高并发,强烈建议关闭并行。
(高并发的SQL,一旦走错执行计划,开启并行的话,会占用大量work_mem,和CPU,造成数据库主机CPU100%以及数据库实例OOM)
如果是OLAP 分析系统,纯跑批分析性的,可以考虑开启并行提高查询效率。
如果是OLAP/OLTP混动数据库, 那么可以全局关闭并行,在session级别对低并发,复杂的SQL手动设置开启并行。
Have a fun 🙂 !
