


12月3号9点时分,业务发现在8点的时间段出现了大量的业务排队等待,等待时间接近30分钟,且该时段的业务为联机业务肥批量业务,需要协助排查问题原因
生成了7点半到8点半时间段的awr和ash报告
#(ORACLE)
SQL > @?/rdbms/admin/ashrpt.sql
SQL > @?/rdbms/admin/awrrpt.sql


可以看到在该时间段一共执行156次update的sql,平均用时竟6s之久,联机业务平均等待时间6s严重影响业务,等待的事件是行锁
、
#(ORACLE)
SQL >
select sql_text from gv$sql where sql_id='dnqgx4yp2y3vk';

我先查看了该sql语句的执行计划,有正常的走索引,那就开始寻找行锁的源头
#(ORACLE)
SQL> set line 200 pages 1000
SQL> col program for a30
SQL> col exec_time for a30
SQL> select sql_id,sql_exec_start,sql_exec_id,program,sql_plan_hash_value,max(sample_time)-sql_exec_start  exec_time
from gv$active_session_history
where
event='enq: TX - row lock contention'
and sql_id='dnqgx4yp2y3vk'
group by sql_id,sql_exec_start,sql_exec_id,program,sql_plan_hash_value
order by exec_time;

set line 200 pages 1000
col sample_time for a27
col sql_id for a15
col event for a30
col sql_opname for a20
col event for a20
col BLOCKING_SSID for a15
col SSID for a15
col program for a25
col BLOCKING_SSID for a15
select sample_time,sql_id,sql_opname,event,p2,BLOCKING_INST_ID||','||blocking_session||','||blocking_session_serial# BLOCKING_SSID
from gv$active_session_history
where
    sample_time>to_date('20231203 7:50:00','yyyymmdd hh24:mi:ss')
and sample_time<to_date('20231203 8:00:00','yyyymmdd hh24:mi:ss')
and sql_id='dnqgx4yp2y3vk'
and sql_exec_id=33681353
order by sample_time;

SQL> col event for a40
SQL> select sample_time,INST_ID||','||session_id||','||session_serial# SSID,sql_opname,sql_id,sql_exec_id,xid,program,BLOCKING_INST_ID||','||blocking_session||','||blocking_session_serial# BLOCKING_SSID
from gv$active_session_history
where
sample_time>=to_date('20231203 7:50:00','yyyymmdd hh24:mi:ss')
and sample_time<=to_date('20231203 8:00:00','yyyymmdd hh24:mi:ss')
and inst_id=2
and session_id=1098
and session_serial#=29916
order by sample_time;

SQL> select sql_id,sql_text from dba_hist_sqltext where sql_id='6b4dxu1z17zxf';

SQL_ID		SQL_TEXT
--------------- --------------------------------------------------------------------------------
6b4dxu1z17zxf	update e_txn_collection set chk_status='00' where sys_type=:1 and host_check='00

SQL> select sql_id,sql_text from dba_hist_sqltext where sql_id='fv3zrdmnp2gbr';

SQL_ID		SQL_TEXT
--------------- --------------------------------------------------------------------------------
fv3zrdmnp2gbr	update e_txn_payment set chk_status='00' where sys_type=:1 and host_check='00' a

SQL> select sql_id,sql_text from dba_hist_sqltext where sql_id='akctwaddxcy02';

SQL_ID		SQL_TEXT
--------------- --------------------------------------------------------------------------------
akctwaddxcy02	update e_txn_payment set chk_status='00', epcc_chk='00' where sys_type=:1 and ho

SQL> select sql_id,sql_text from dba_hist_sqltext where sql_id='314n78k0mkq6c';

SQL_ID		SQL_TEXT
--------------- --------------------------------------------------------------------------------
314n78k0mkq6c	update e_txn_refund set chk_status='00' where sys_type=:1 and host_check='00' an

SQL> select sql_id,sql_text from dba_hist_sqltext where sql_id='576mpbn5djs6r';

no rows selected

SQL> select sql_id,sql_text from dba_hist_sqltext where sql_id='2297rajp0txa9';

SQL_ID		SQL_TEXT
--------------- --------------------------------------------------------------------------------
2297rajp0txa9	update e_check_datatransfer set chk_status='B1' where sys_type=:1 and host_check

SQL> select sql_id,sql_text from dba_hist_sqltext where sql_id='8y2q1tcq0k6k5';

SQL_ID		SQL_TEXT
--------------- --------------------------------------------------------------------------------
8y2q1tcq0k6k5	update e_txn_payment set chk_status='B1' where sys_type=:1 and host_check='00' a

SQL> select sql_id,sql_text from dba_hist_sqltext where sql_id='8y2q1tcq0k6k5';

SQL_ID		SQL_TEXT
--------------- ------------------------------------------------------------------------------------------------------------------------
8y2q1tcq0k6k5	update e_txn_payment set chk_status='B1' where sys_type=:1 and host_check='00' a
查看了一下最后的会话里面都执行的都是update的sql
再通过刚刚最后哪个会话的xid查看事务下sql的执行时间
select sql_id,sql_exec_start,xid,sql_exec_id,program,sql_plan_hash_value,max(sample_time)-sql_exec_start  exec_time
from gv$active_session_history
where xid='170910005D0B0000'
group by sql_id,sql_exec_start,sql_exec_id,program,sql_plan_hash_value,xid
order by exec_time;
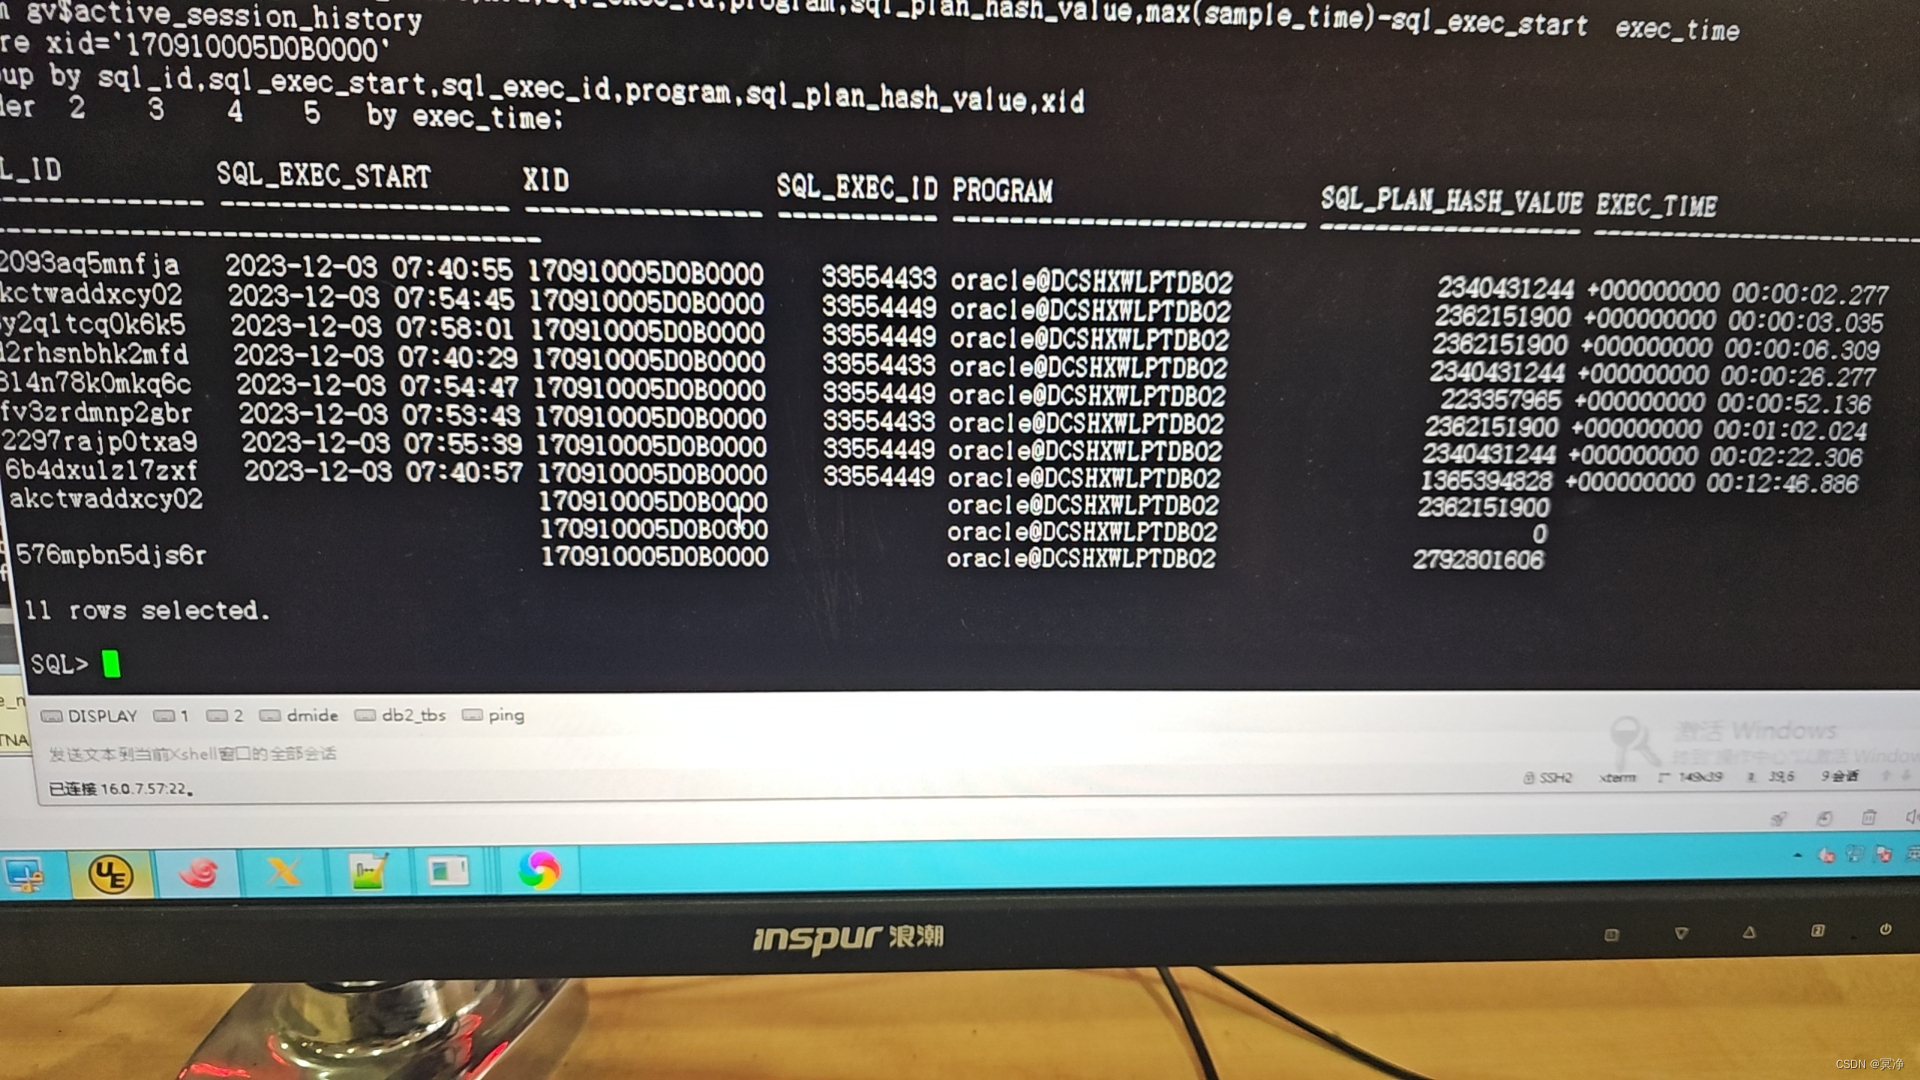
用时最长的是6b4dxu1z17zxf这个sql
select * from table(dbms_xplan.display_awr('6b4dxu1z17zxf'));
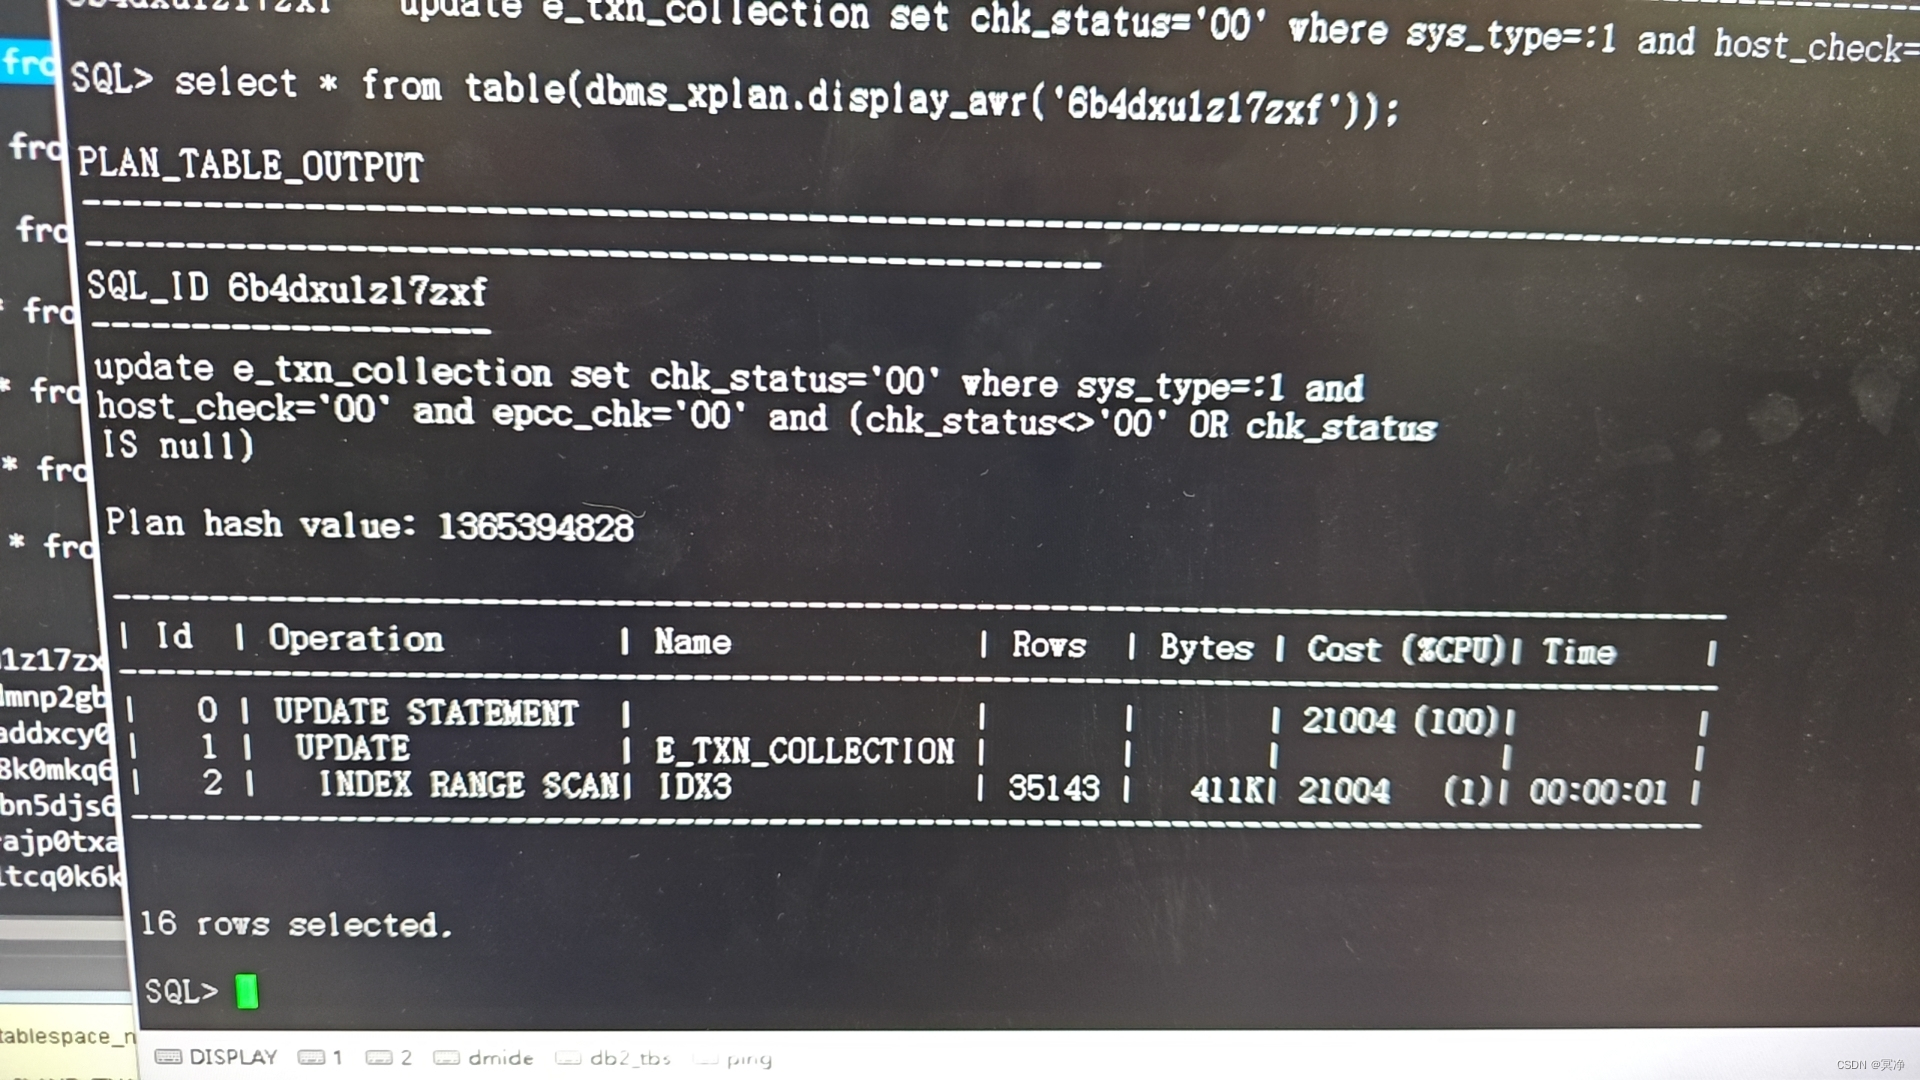
查看历史执行时间可以看到该sql是个批量计划
set lines 200 pages 30
col shijian for a12
col inst_id for 99
col execu_d for 999999999999
col bg_d for 9999999999
col dr_d for 9999999999
col et_d for 99999999
col ct_d for 99999999
col io_time for 999999
col clus_time for 999999
col ap_time for 999999
col cc_time for 999999
col et_onetime for 999999.99
select
    to_char(b.END_INTERVAL_TIME,'yyyymmdd hh24') shijian,
	a.instance_number inst_id,
	a.plan_hash_value,
    sum(a.EXECUTIONS_DELTA) execu_d,
    sum(a.BUFFER_GETS_DELTA ) bg_d,
    sum(a.DISK_READS_DELTA ) dr_d,
    sum(a.ELAPSED_TIME_DELTA/1000000) et_d,
    sum(a.CPU_TIME_DELTA/1000000)  ct_d,
    sum(IOWAIT_DELTA/1000000) io_time,
    sum(CLWAIT_DELTA/1000000) clus_time,
    sum(APWAIT_DELTA/1000000) ap_time,
    sum(ccwait_delta/1000000) cc_time,
    decode(sum(a.EXECUTIONS_DELTA),0,sum(a.ELAPSED_TIME_DELTA/1000000),
	sum(a.ELAPSED_TIME_DELTA/1000000)/sum(a.EXECUTIONS_DELTA)) et_onetime,	decode(sum(a.EXECUTIONS_DELTA),0,sum(a.rows_processed_DELTA),sum(a.rows_processed_DELTA)/sum(a.EXECUTIONS_DELTA)) rw_onetime
from
    dba_hist_sqlstat a,dba_hist_snapshot b
where
    a.SNAP_ID =b.SNAP_ID
and a.INSTANCE_NUMBER=b.INSTANCE_NUMBER
and a.sql_id='6b4dxu1z17zxf'
group by
    to_char(b.END_INTERVAL_TIME,'yyyymmdd hh24'),a.plan_hash_value,a.instance_number
 order by 1;
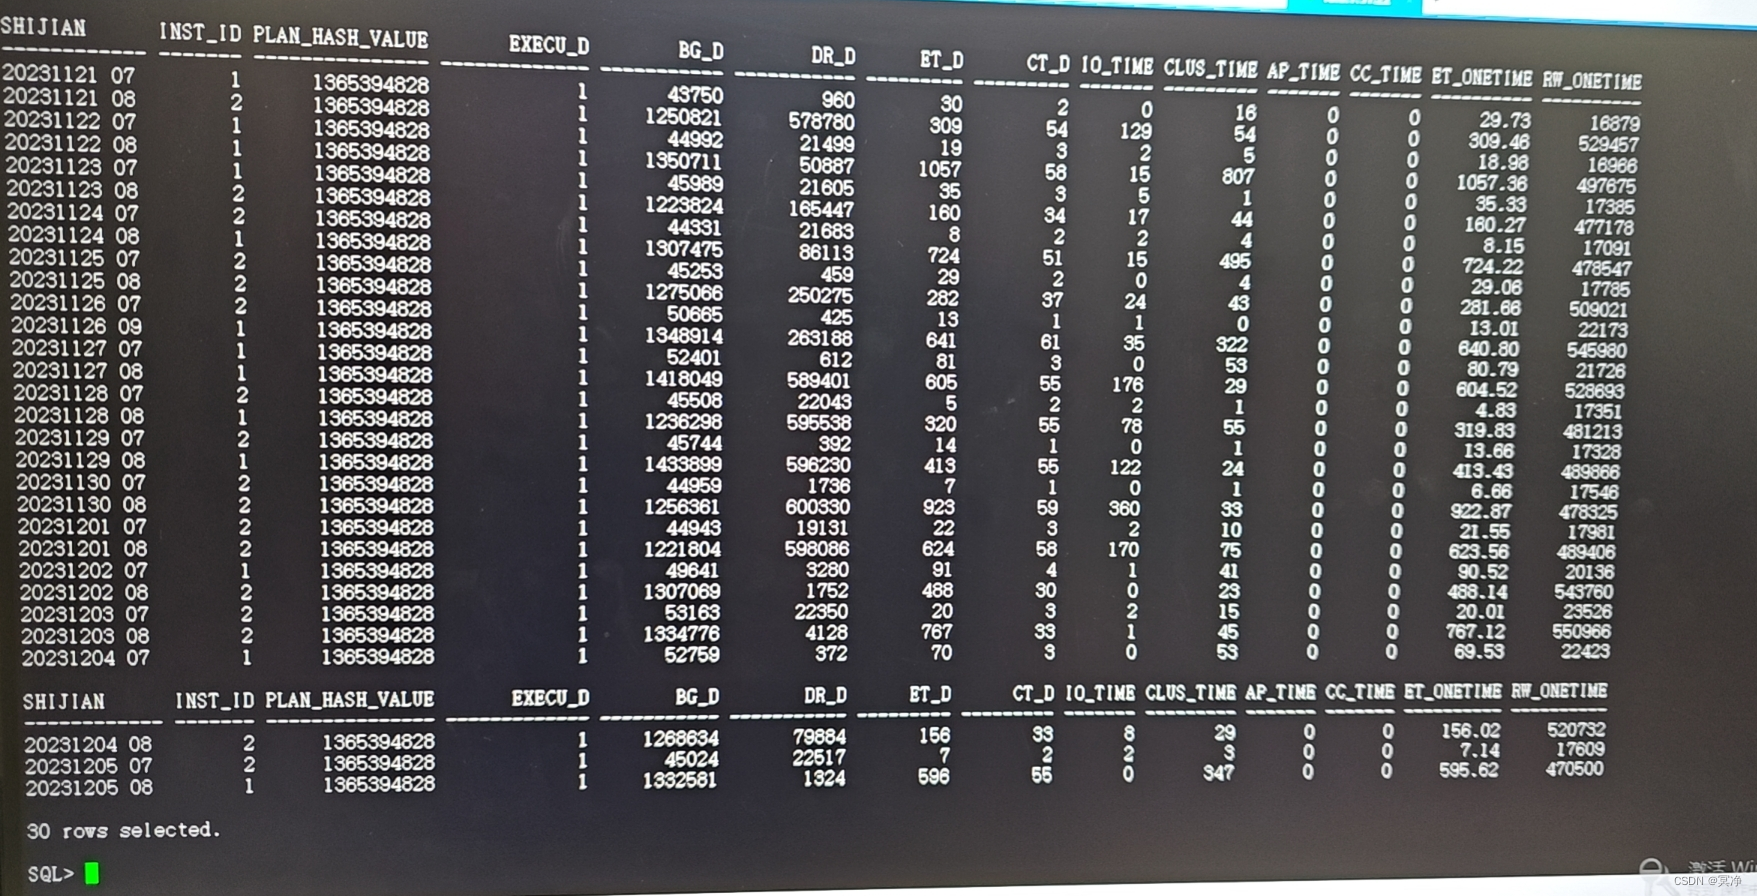
每次的跑批时间在7,8点并且每次用时也都在10分钟以上
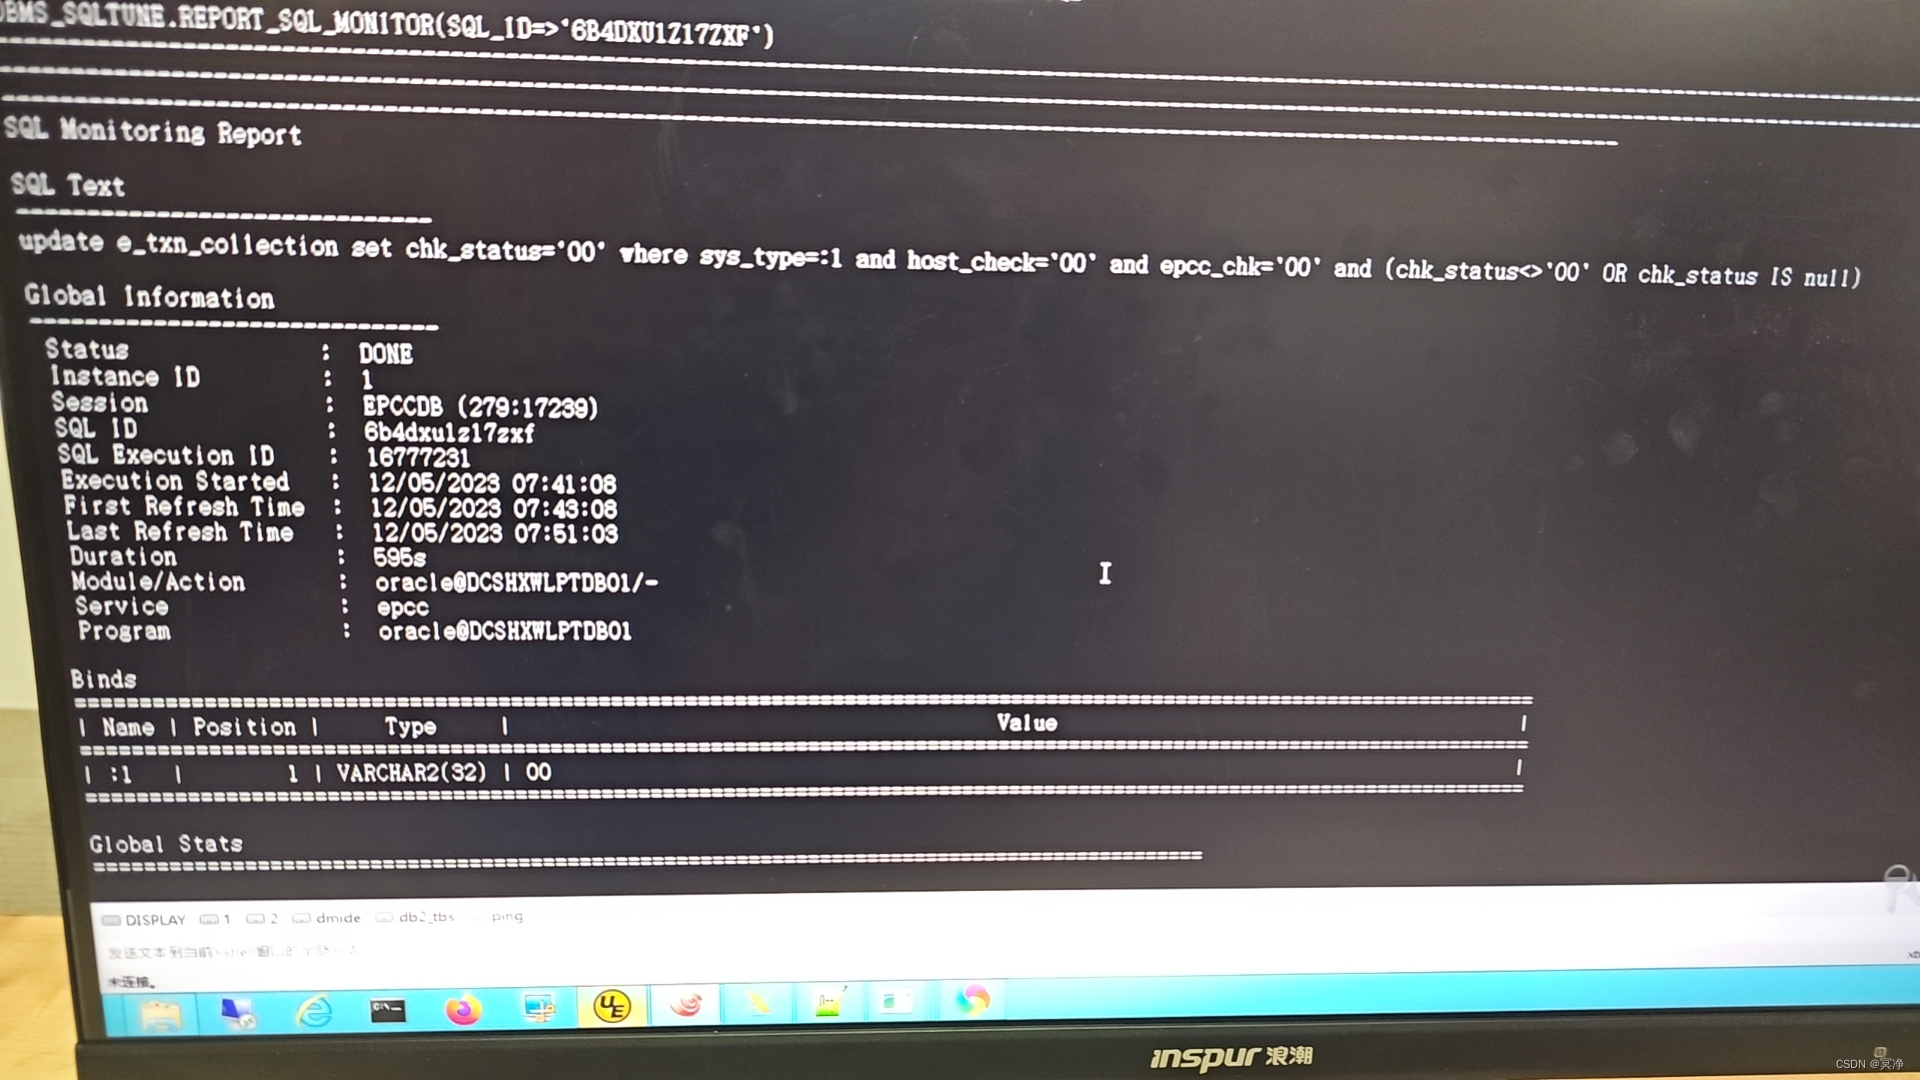
收集sqlmonitor
set linesize 500 pagesize 50000 long 999999 longchunksize 999999
select dbms_sqltune.report_sql_monitor(sql_id => '6b4dxu1z17zxf') from dual;
再查看联机业务的历史执行时间
set lines 200 pages 30
col shijian for a12
col inst_id for 99
col execu_d for 999999999999
col bg_d for 9999999999
col dr_d for 9999999999
col et_d for 99999999
col ct_d for 99999999
col io_time for 999999
col clus_time for 999999
col ap_time for 999999
col cc_time for 999999
col et_onetime for 999999.99
select
    to_char(b.END_INTERVAL_TIME,'yyyymmdd hh24') shijian,
	a.instance_number inst_id,
	a.plan_hash_value,
    sum(a.EXECUTIONS_DELTA) execu_d,
    sum(a.BUFFER_GETS_DELTA ) bg_d,
    sum(a.DISK_READS_DELTA ) dr_d,
    sum(a.ELAPSED_TIME_DELTA/1000000) et_d,
    sum(a.CPU_TIME_DELTA/1000000)  ct_d,
    sum(IOWAIT_DELTA/1000000) io_time,
    sum(CLWAIT_DELTA/1000000) clus_time,
    sum(APWAIT_DELTA/1000000) ap_time,
    sum(ccwait_delta/1000000) cc_time,
    decode(sum(a.EXECUTIONS_DELTA),0,sum(a.ELAPSED_TIME_DELTA/1000000),
	sum(a.ELAPSED_TIME_DELTA/1000000)/sum(a.EXECUTIONS_DELTA)) et_onetime,	decode(sum(a.EXECUTIONS_DELTA),0,sum(a.rows_processed_DELTA),sum(a.rows_processed_DELTA)/sum(a.EXECUTIONS_DELTA)) rw_onetime
from
    dba_hist_sqlstat a,dba_hist_snapshot b
where
    a.SNAP_ID =b.SNAP_ID
and a.INSTANCE_NUMBER=b.INSTANCE_NUMBER
and a.sql_id='dnqgx4yp2y3vk'
group by
    to_char(b.END_INTERVAL_TIME,'yyyymmdd hh24'),a.plan_hash_value,a.instance_number
 order by 1;
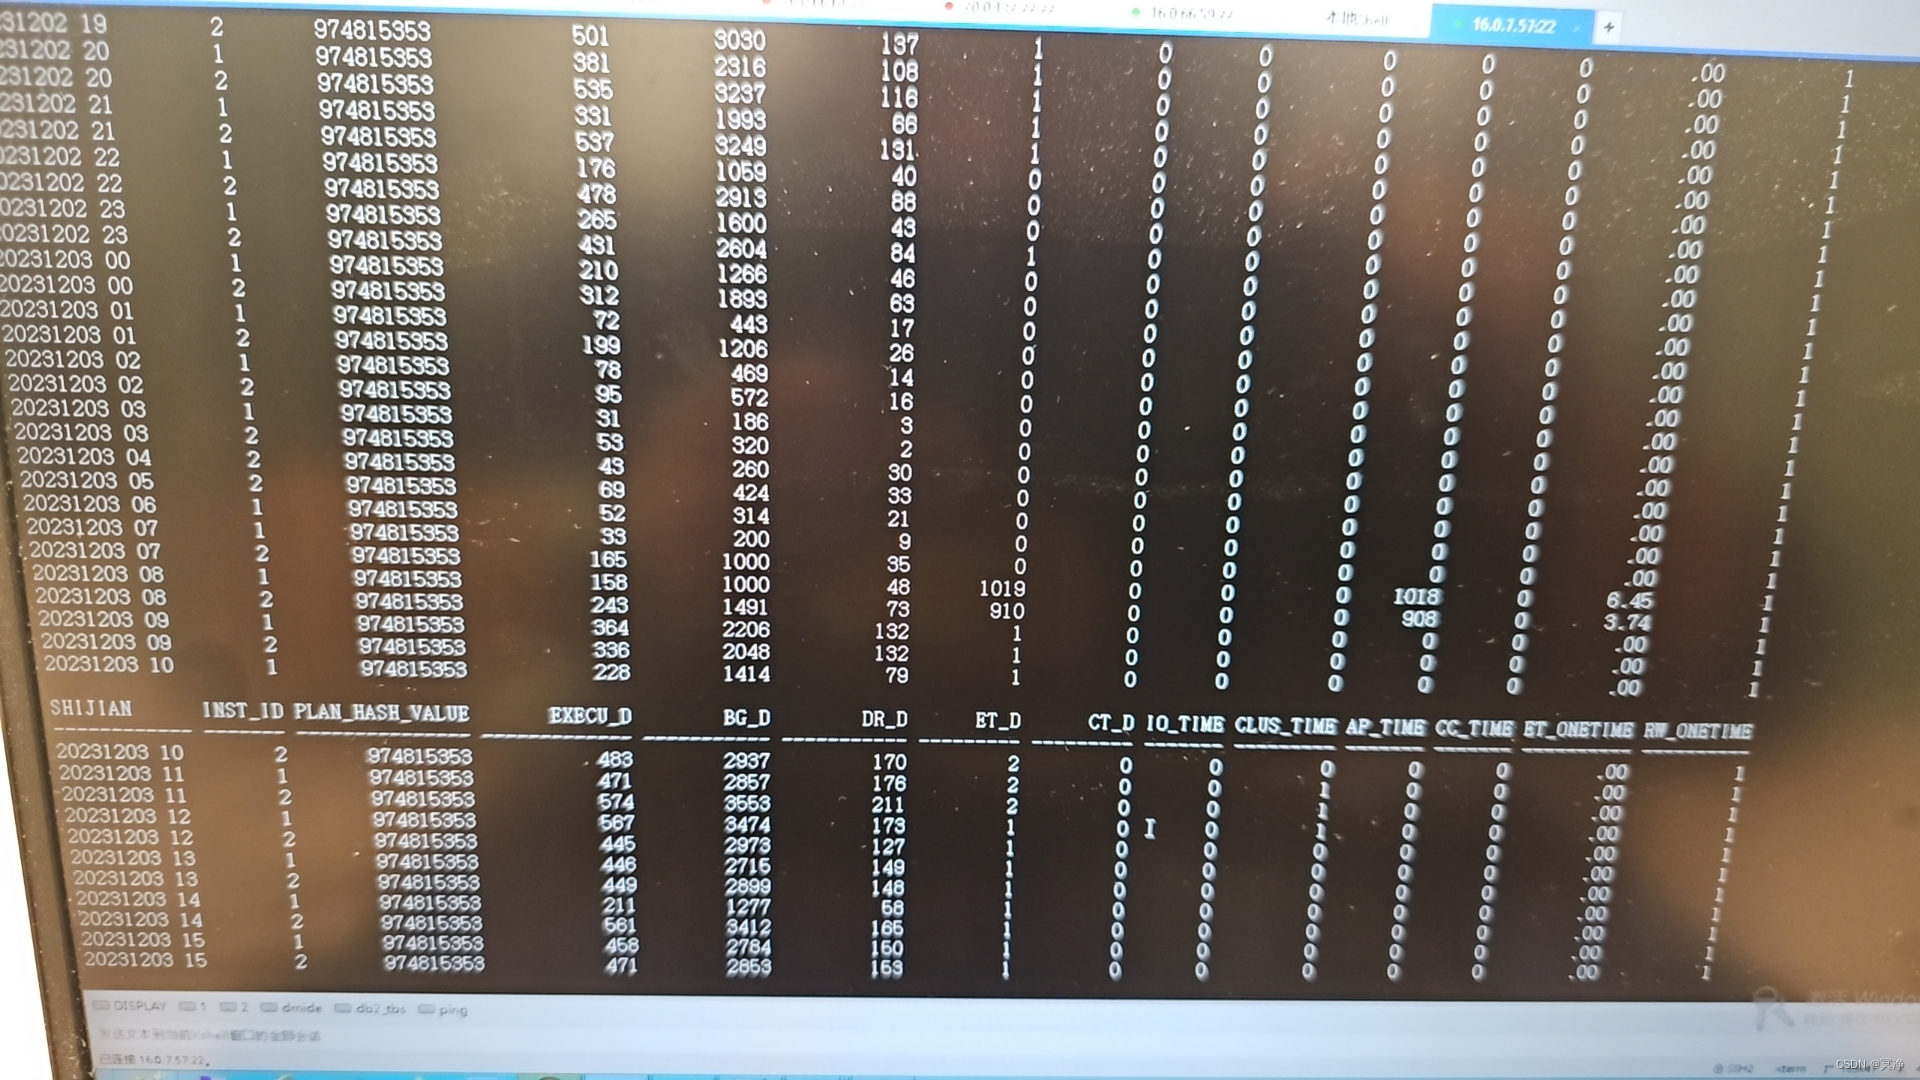
看的出来跑批执行时间在7点40分左右,每次执行10分钟以上,8点会有大量的联机任务进来,所以为了防止跑批的行锁影响到联机的sql任务,最好将批量任务再提前一些到7点这个时间段,防止影响联机业务
最后修改时间:2023-12-12 09:09:48
「喜欢这篇文章,您的关注和赞赏是给作者最好的鼓励」
关注作者
【版权声明】本文为墨天轮用户原创内容,转载时必须标注文章的来源(墨天轮),文章链接,文章作者等基本信息,否则作者和墨天轮有权追究责任。如果您发现墨天轮中有涉嫌抄袭或者侵权的内容,欢迎发送邮件至:contact@modb.pro进行举报,并提供相关证据,一经查实,墨天轮将立刻删除相关内容。
