


node_exporter
下载
https://github.com/prometheus/node_exporter/releases
启动
nohup /opt/node_exporter/node_exporter --no-collector.softnet > /opt/node_exporter/node_exporter.log 2>&1 &
opengass_exporter
opengauss_exporter使用详情请参考 https://www.modb.pro/db/47407
下载
https://gitee.com/enmotech/opengauss_exporter
配置数据库参数
echo "password_encryption_type=1" >> postgresql.conf
echo "host all opengauss_exporter x.x.x.x/32 md5" >> pg_hba.conf
配置数据库用户
CREATE USER opengauss_exporter WITH PASSWORD 'opengauss_exporter123' MONADMIN;
grant usage on schema dbe_perf to opengauss_exporter;
grant select on pg_stat_replication to opengauss_exporter;
配置环境变量
export DATA_SOURCE_NAME="host=x.x.x.x user=xxx password=xxx port=xxx dbname=xxx sslmode=disable"

or

export DATA_SOURCE_NAME="postgresql://username:password@hostname:port/dbname?sslmode=disable"

or
监控多实例
export DATA_SOURCE_NAME="postgresql://username:password@hostname:port/dbname?sslmode=disable,postgresql://username2:password2@hostname2:port2/dbname2?sslmode=disable"
启动
nohup /opt/opengauss_exporter/opengauss_exporter --config="/opt/opengauss_exporter/default_queries.yaml" --log.level=debug --auto-discover-databases --exclude-databases="template0,template1" --web.listen-address=":9187" --parallel=5 >> /opt/opengauss_exporter/opengauss_exporter.log 2>&1 &
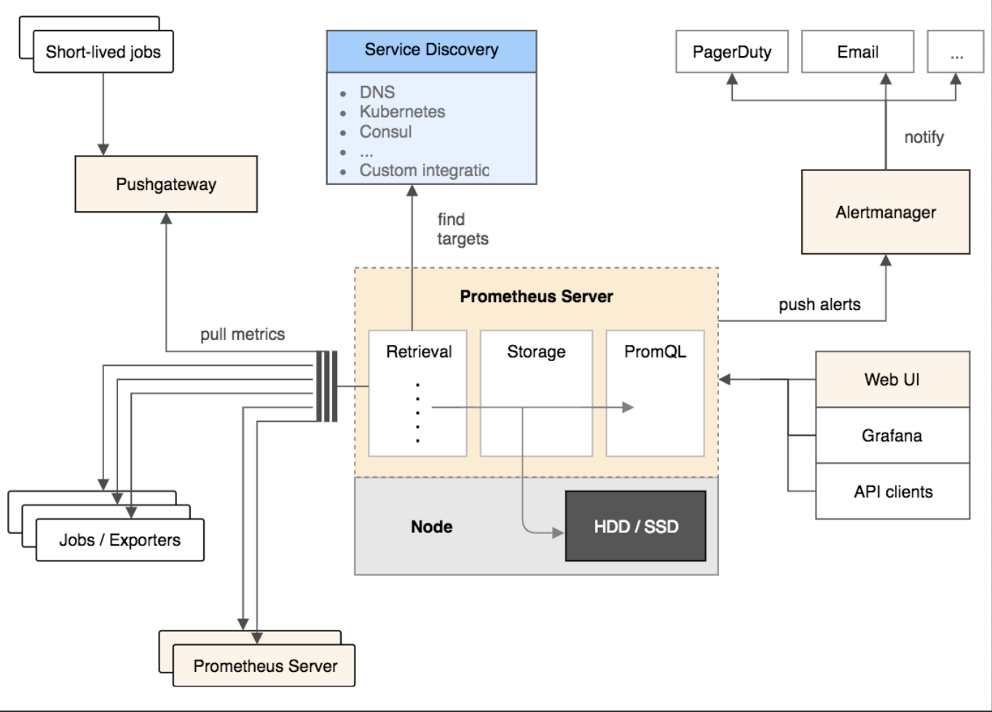
Prometheus
下载地址
https://prometheus.io/download/
解压
--以2.31.1版本为例
tar -zxvf prometheus-2.31.1.linux-amd64.tar.gz
编辑配置文件
vim prometheus.yml
# my global config
global:
  scrape_interval:     15s # Set the scrape interval to every 15 seconds. Default is every 1 minute.
  evaluation_interval: 15s # Evaluate rules every 15 seconds. The default is every 1 minute.
  # scrape_timeout is set to the global default (10s).


# Alertmanager configuration
alerting:
  alertmanagers:
  - static_configs:
    - targets:
      # - alertmanager:9093


# Load rules once and periodically evaluate them according to the global 'evaluation_interval'.
rule_files:
  # - "first_rules.yml"
  # - "second_rules.yml"


# A scrape configuration containing exactly one endpoint to scrape:
# Here it's Prometheus itself.
scrape_configs:
  # The job name is added as a label `job=<job_name>` to any timeseries scraped from this config.
  - job_name: 'prometheus'


    # metrics_path defaults to '/metrics'
    # scheme defaults to 'http’.

    static_configs:
    - targets: ['xxx.xxx.xxx.131:9090']


  - job_name: 'Node'
    static_configs:
    - targets: ['xxx.xxx.xxx.131:9100']
      labels:
                instance: 'xxx.xxx.xxx.131'
    - targets: ['xxx.xxx.xxx.130:9100']
      labels:
                instance: 'xxx.xxx.xxx.130'
    - targets: ['xxx.xxx.xxx.62:9100']
      labels:
                instance: 'xxx.xxx.xxx.62'


  - job_name: 'MogDB'
    static_configs:
    - targets: ['xxx.xxx.xxx.131:9187']
      labels:
                instance: 'MogDB_131'
    - targets: ['xxx.xxx.xxx.130:9187']
      labels:
                instance: 'MogDB_130'
    - targets: ['xxx.xxx.xxx.62:9187']
      labels:
                instance: 'MogDB_62'
启动prometheus
nohup /opt/prometheus/prometheus --config.file=/opt/prometheus/prometheus.yml --web.enable-lifecycle > /opt/prometheus/prometheus.log 2>&1 &
grafana
下载地址
https://grafana.com/grafana/download

直接rpm下载
wget https://dl.grafana.com/oss/release/grafana-enterprise-8.2.4-1.x86_64.rpm
修改数据存储
---此步骤可以跳过,这里已PostgreSQL为例

---创建数据库及数据库用户
create user grafanaer login encrypted password 'grafanaer';
create database grafana owner grafanaer;

—修改postgresql的pg_hba.cnf文件
vim /data/pg_data/pg_hba.conf

host    all             all             xxx.xxx.xxx.131/32         trust

---修改配置文件
vim /etc/grafana/grafana.ini

type = postgres
host = xxx.xxx.xxx.131:5432
name = grafana
user = grafanaer
password = grafanaer
启动grafana
systemctl daemon-reload
systemctl enable grafana-server.service
systemctl start grafana-server
systemctl status grafana-server
验证
--以网站的方式打开
http://xxx.xxx.xxx:3000

账号:admin
默认密码:admin

注:需要在阿里云ecs的安全组中流入方向打开自定义3000端口
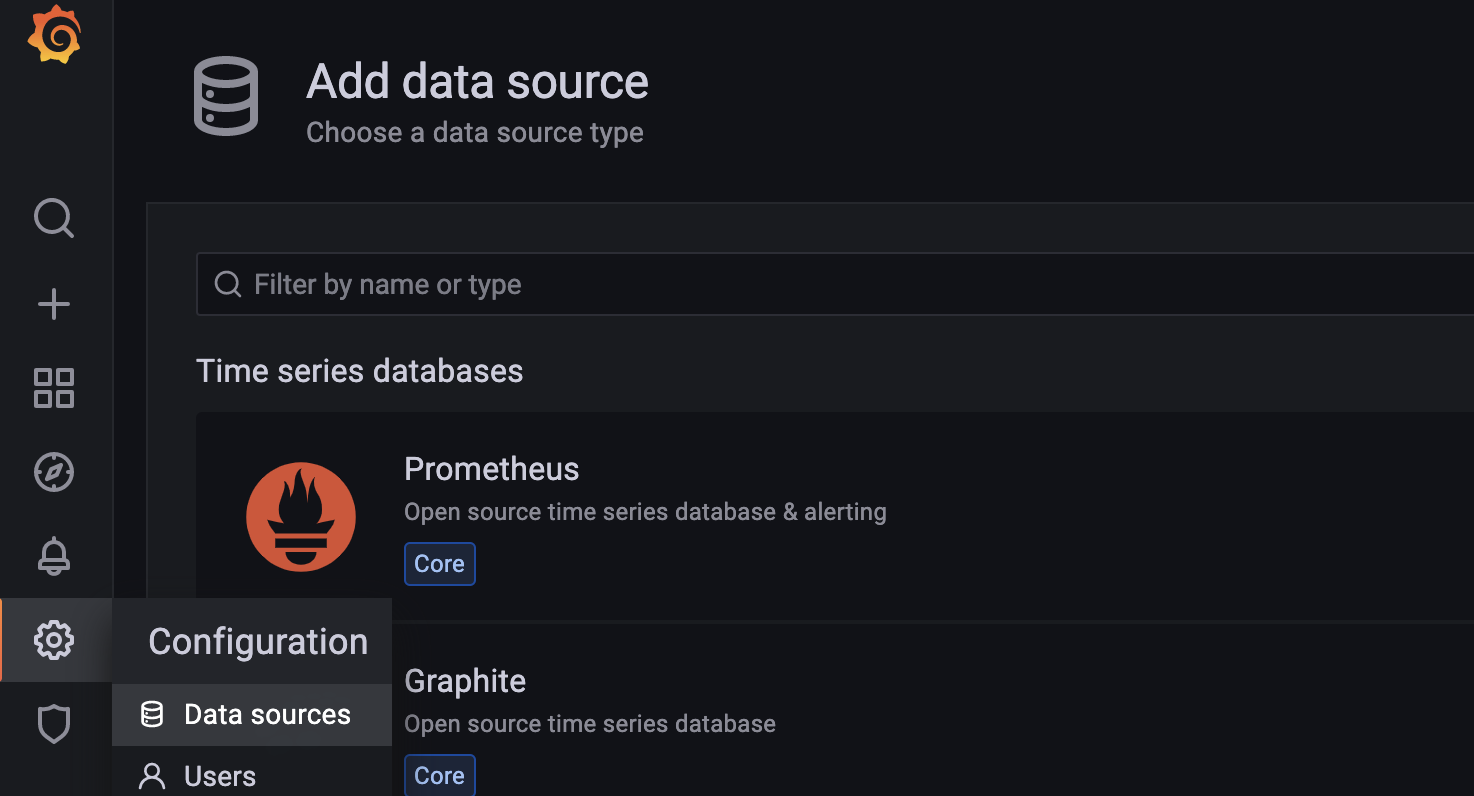
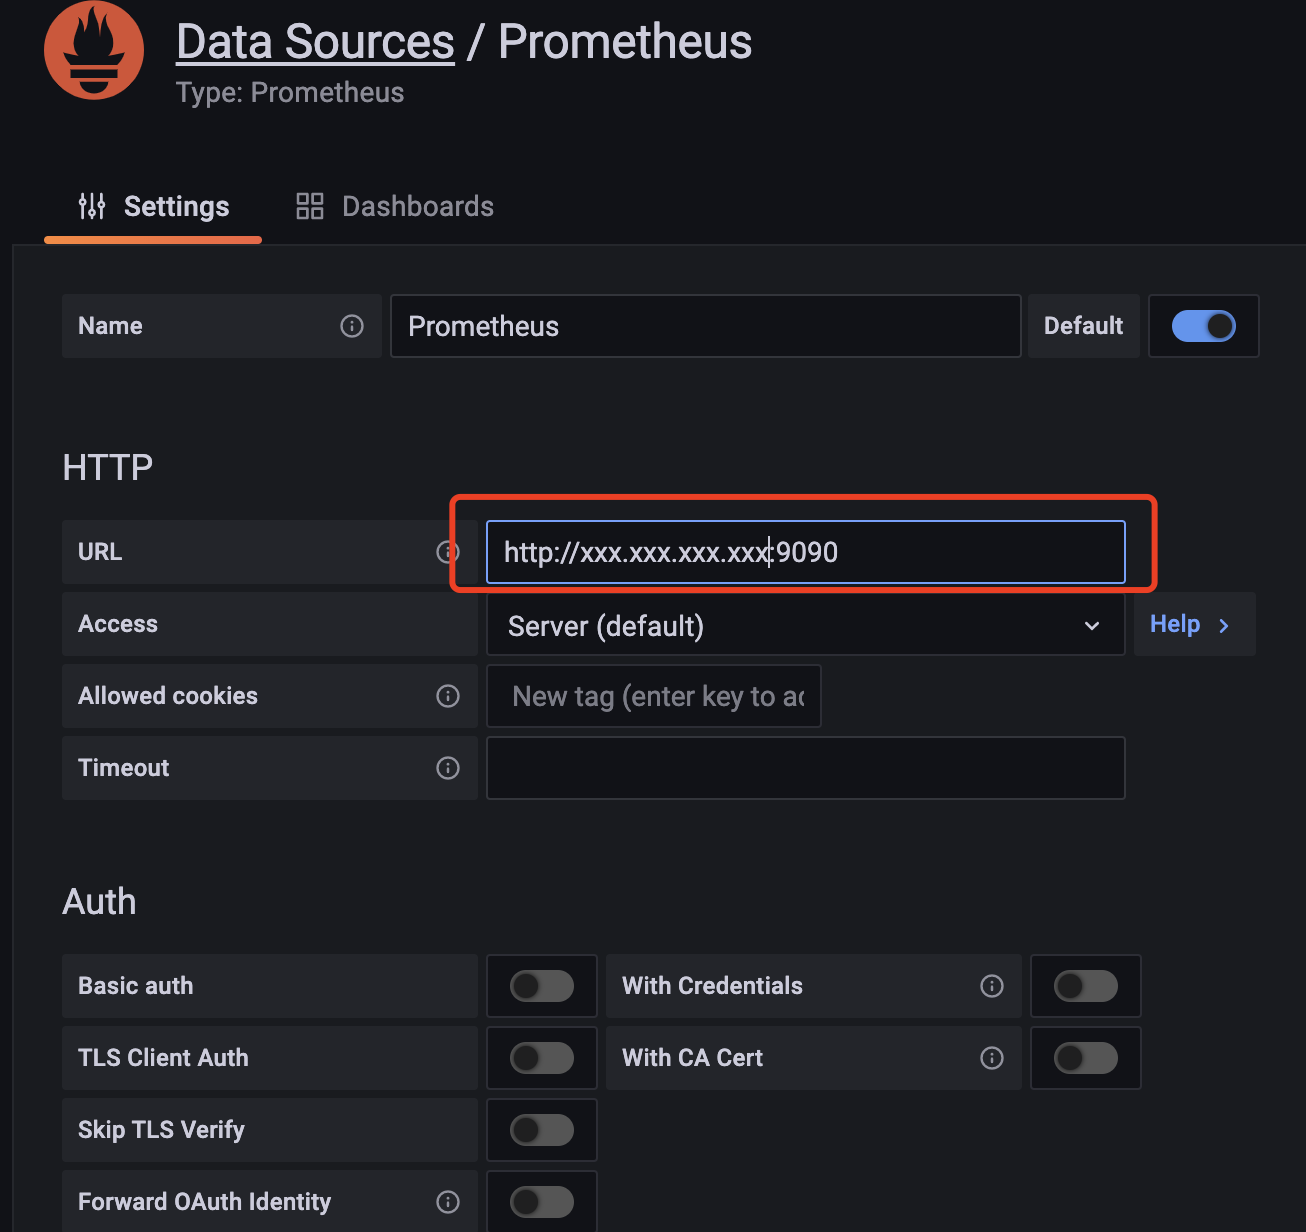
配置数据源
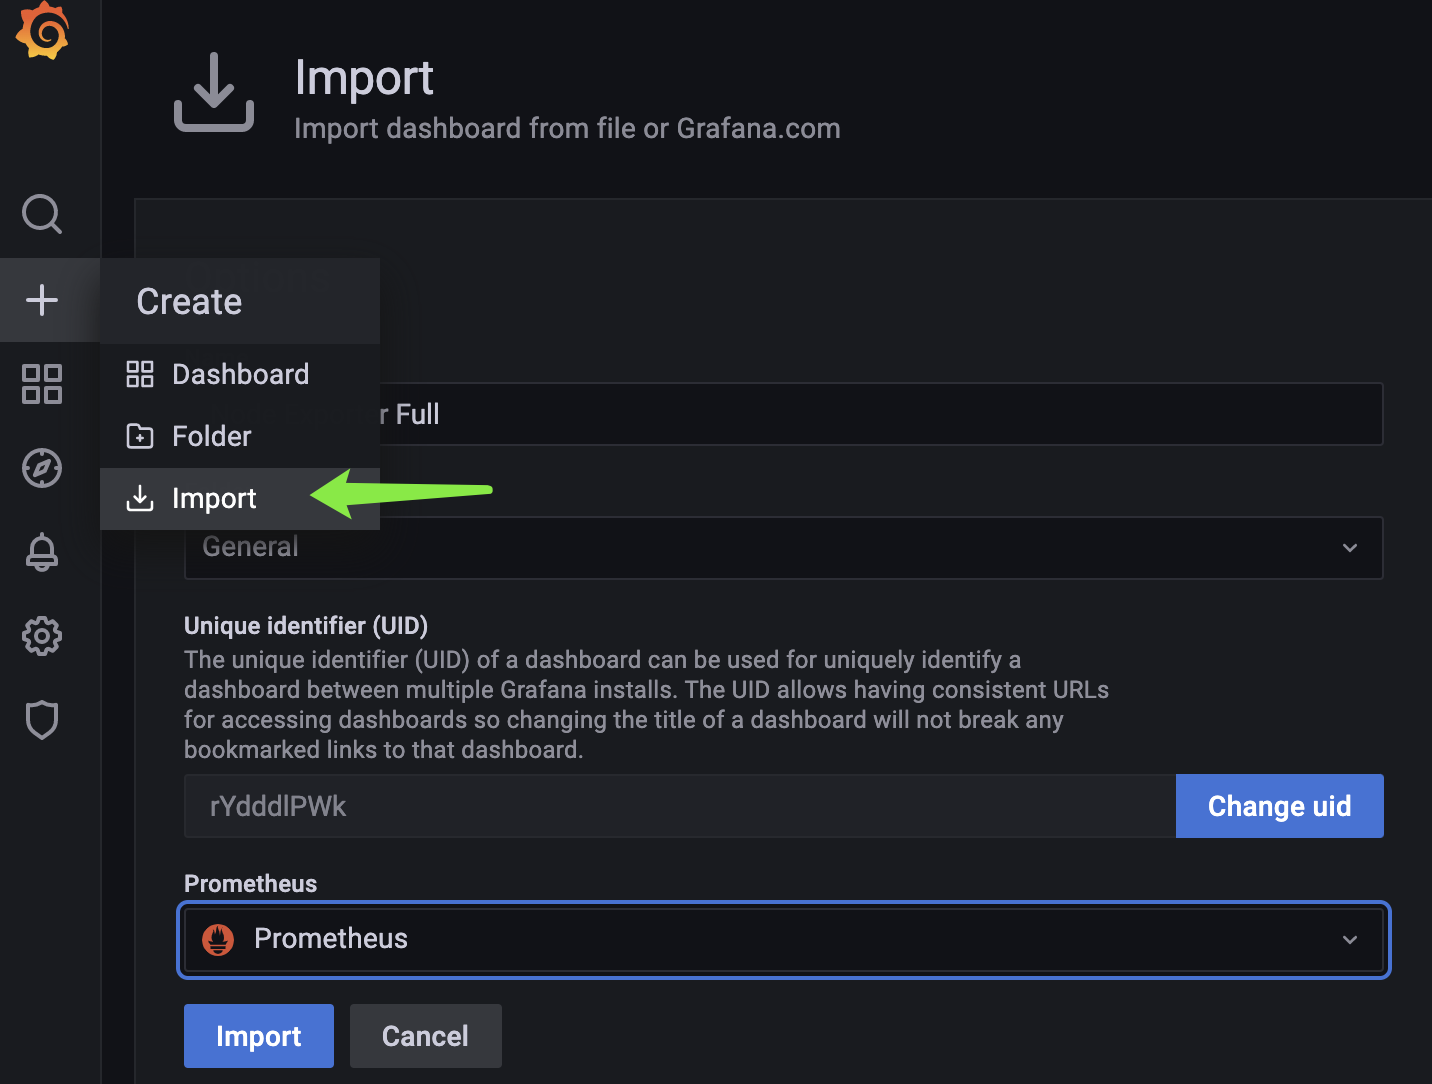
导入dashboard
最后修改时间:2021-12-14 16:24:22
「喜欢这篇文章,您的关注和赞赏是给作者最好的鼓励」
关注作者
【版权声明】本文为墨天轮用户原创内容,转载时必须标注文章的来源(墨天轮),文章链接,文章作者等基本信息,否则作者和墨天轮有权追究责任。如果您发现墨天轮中有涉嫌抄袭或者侵权的内容,欢迎发送邮件至:contact@modb.pro进行举报,并提供相关证据,一经查实,墨天轮将立刻删除相关内容。
