点击上方👆蓝字关注!
示例应用
创建demo命名空间$ kubectl create ns test-01# 采用自动注入方式$ kubectl label namespace demo istio-injection=enabled
然后安装 microservices-demo 这个应用:
# Clone the repo with all microservices to be deployed$ git clone https://github.com/GoogleCloudPlatform/microservices-demo$ cd microservices-demo# Install the services# 镜像默认是gcr的,需要自行替换可访问的镜像地址$ kubectl apply -n demo -f ./release/kubernetes-manifests.yaml......# Setup istio gateway and virtual services for routing$ kubectl apply -n demo -f ./release/istio-manifests.yamlgateway.networking.istio.io/frontend-gateway createdvirtualservice.networking.istio.io/frontend-ingress createdvirtualservice.networking.istio.io/frontend createdserviceentry.networking.istio.io/whitelist-egress-googleapis createdserviceentry.networking.istio.io/whitelist-egress-google-metadata created
安装完成后,可以使用 kubectl -n demo get pods
来查看是否正常。
$ kubectl get pods -n test01NAME READY STATUS RESTARTS AGEadservice-66949bd448-4thj4 2/2 Running 0 29mcartservice-9d88457-27qnk 2/2 Running 2 29mcheckoutservice-5cb565d6cd-fsqdv 2/2 Running 0 29mcurrencyservice-69746f5bfb-6m7dj 2/2 Running 0 29memailservice-f4b7dddd4-vw4gn 2/2 Running 0 29mfrontend-644d768794-glmfj 2/2 Running 0 29mloadgenerator-7895d4cdb6-jbb68 2/2 Running 7 29mpaymentservice-7bcf59648-d2zks 2/2 Running 0 29mproductcatalogservice-797f6494f8-fgl2b 2/2 Running 0 29mrecommendationservice-7c5c6b8d56-5q99s 2/2 Running 0 29mredis-cart-74594bd569-mt9np 2/2 Running 0 29mshippingservice-658875bd74-gmpgn 2/2 Running 0 29m
接下来我们可以通过 Istio gateway 端点来访问演示应用程序。

这个微服务演示应用是一个由多个不同语言编写的服务组成的在线商店,该应用程序可以用来添加商品到购物车、更改交易货币和结账,所有这些操作都由不同的服务来完成。
安装 Loki 和 FluentBit
示例应用程序安装完成后,我们就可以开始安装 Loki 了,这里我们使用 Helm 来快速安装,首先添加 Chart 仓库:
# Add the loki helm chart$ helm repo add loki https://grafana.github.io/loki/charts$ helm repo update
Chart 仓库配置完成后就可以直接进行安装了:
# Create the namespace to install loki$ kubectl create ns loki# Apply the loki helm chart$ helm upgrade --install loki --namespace=loki loki/loki --set fluent-bit.enabled=true,promtail.enabled=false,grafana.enabled=true,prometheus.enabled=true,prometheus.alertmanager.persistentVolume.enabled=true,prometheus.server.persistentVolume.enabled=trueRelease "loki" does not exist. Installing it now.NAME: lokiLAST DEPLOYED: Thu Nov 19 11:48:00 2020NAMESPACE: lokiSTATUS: deployedREVISION: 1TEST SUITE: NoneNOTES:Verify the application is working by running these commands:kubectl --namespace loki port-forward service/loki 3100curl http://127.0.0.1:3100/api/prom/label
安装的时候要注意设置 fluent-bit.enabled=true
,这样就可以使用 FluentBit 作为日志转发器了,接下来,安装 FluentBit:
$ helm upgrade --install fluent-bit --namespace=loki loki/fluent-bit --set loki.serviceName=loki.loki.svc.cluster.localRelease "fluent-bit" does not exist. Installing it now.NAME: fluent-bitLAST DEPLOYED: Thu Nov 19 11:51:12 2020NAMESPACE: lokiSTATUS: deployedREVISION: 1TEST SUITE: NoneNOTES:Verify the application is working by running these commands:kubectl --namespace loki port-forward daemonset/fluent-bit-fluent-bit-loki 2020curl http://127.0.0.1:2020/api/v1/metrics/prometheus
安装完成后我们可以使用用 kubectl -n loki get pods
命令查看 loki 命名空间中正在运行的 pod。
$ kubectl get pods -n lokiNAME READY STATUS RESTARTS AGEfluent-bit-fluent-bit-loki-2jrd8 1/1 Running 5 4m20sfluent-bit-fluent-bit-loki-knbjj 1/1 Running 0 20mfluent-bit-fluent-bit-loki-wsbwl 1/1 Running 0 69sgrafana-5d45cc9674-wb8fn 1/1 Running 0 12mloki-0 1/1 Running 0 23m
安装 Grafana
$ helm repo add grafana https://grafana.github.io/helm-charts$ helm repo update
这里我们将 Grafana 也安装在 loki 这个命名空间中:
$ helm upgrade --install grafana --namespace=loki grafana/grafana
安装完成后查看 Pod 的状态:
$ kubectl get pods -n lokiNAME READY STATUS RESTARTS AGEfluent-bit-fluent-bit-loki-4g7nh 1/1 Running 0 6m20sfluent-bit-fluent-bit-loki-dt8bj 1/1 Running 0 6mfluent-bit-fluent-bit-loki-wsbwl 1/1 Running 0 12mgrafana-5d45cc9674-wb8fn 1/1 Running 0 24mloki-0 1/1 Running 0 34m
配置 Loki
$ kubectl -n loki port-forward svc/grafana 8080:80# Navigate to http://localhost:8080 in the browser
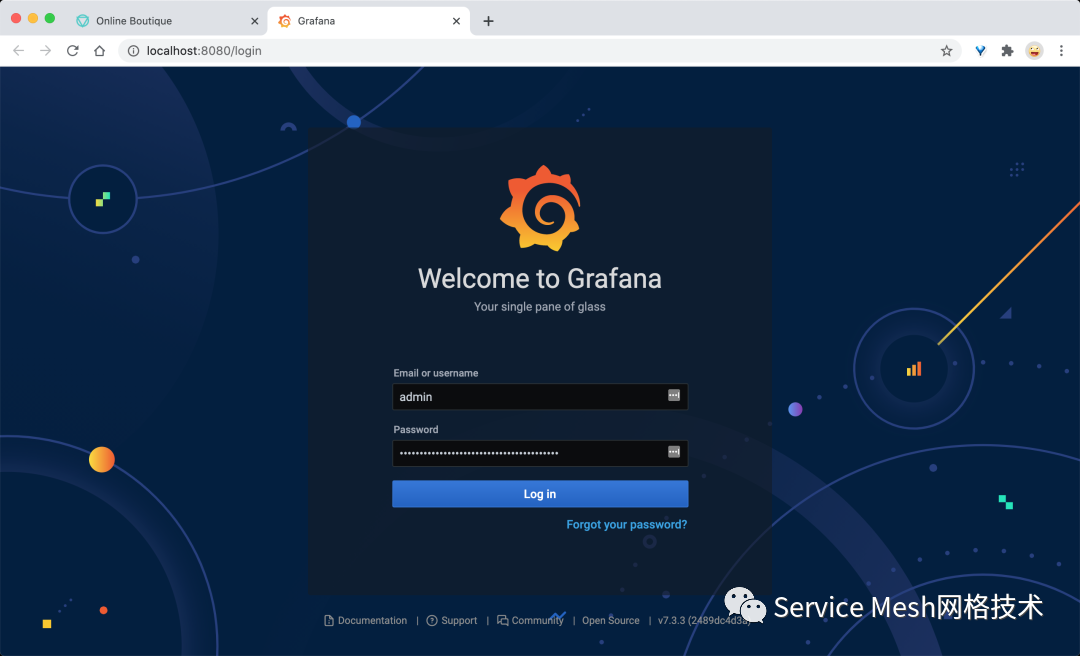
在在浏览器中打开网址 http://localhost:8080 即可访问,初次登录需要输入用户名和密码,用户名为 admin,对应的密码可以用下面的命令获取:
$ kubectl get secret --namespace loki grafana -o jsonpath="{.data.admin-password}" | base64 --decode ; echo# The password for the admin user
登录完成后,我们就可以添加 Loki 作为数据源了,从左侧面板,选择配置 -> 数据源:
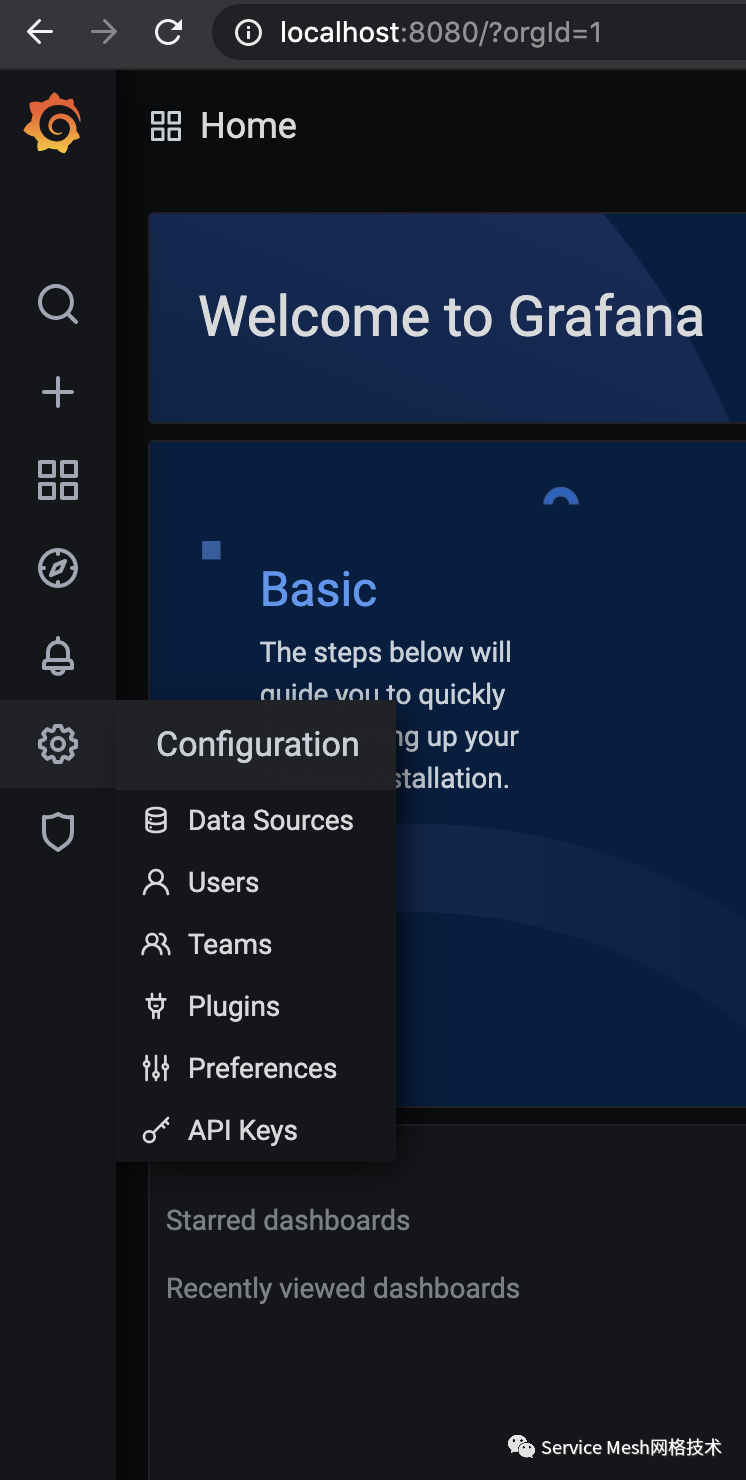
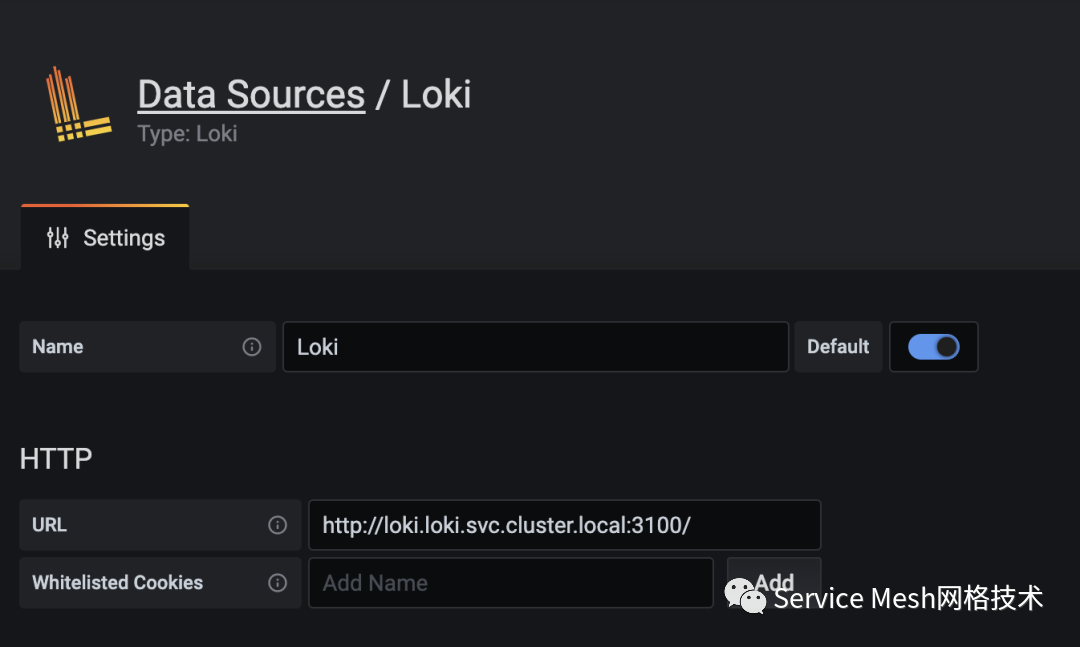
在数据源视图中,点击添加数据源,然后选择 Loki。
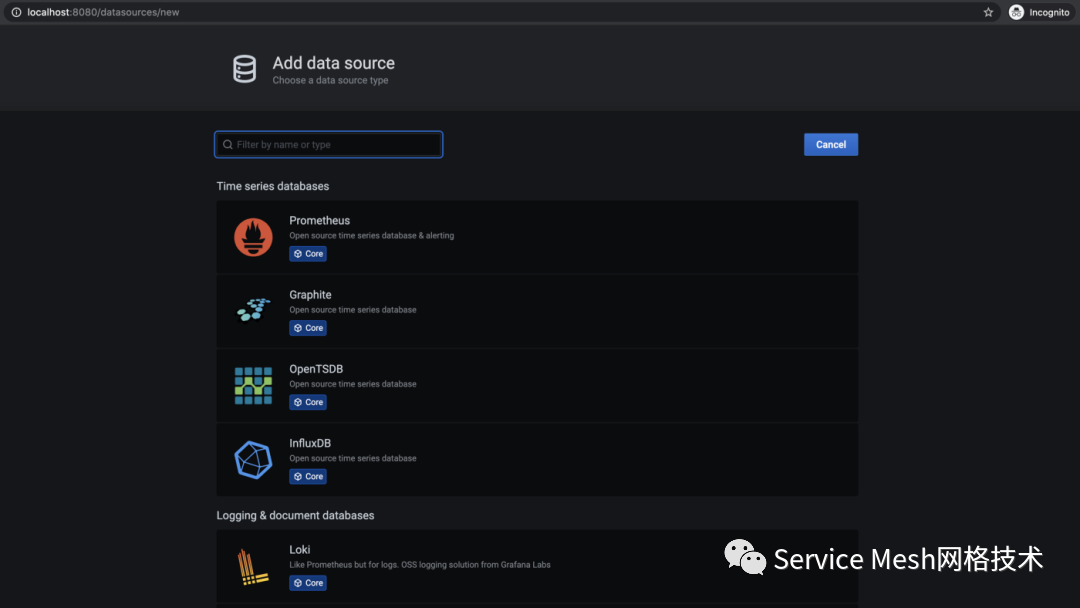
给数据源起一个名字,然后设置一个 Grafana 实例可以访问的 Loki URL。我们这里由于 Loki 和 Grafana 都在相同的命名空间中运行,不需要使用任何验证方案,因此不需要其他配置,单击 "保存和测试"。您应该会看到一条确认消息 Data source connected and labels found.
。
日志查询
{namespace="demo"},然后点击 "运行查询",正常我们就可以看到日志返回了。
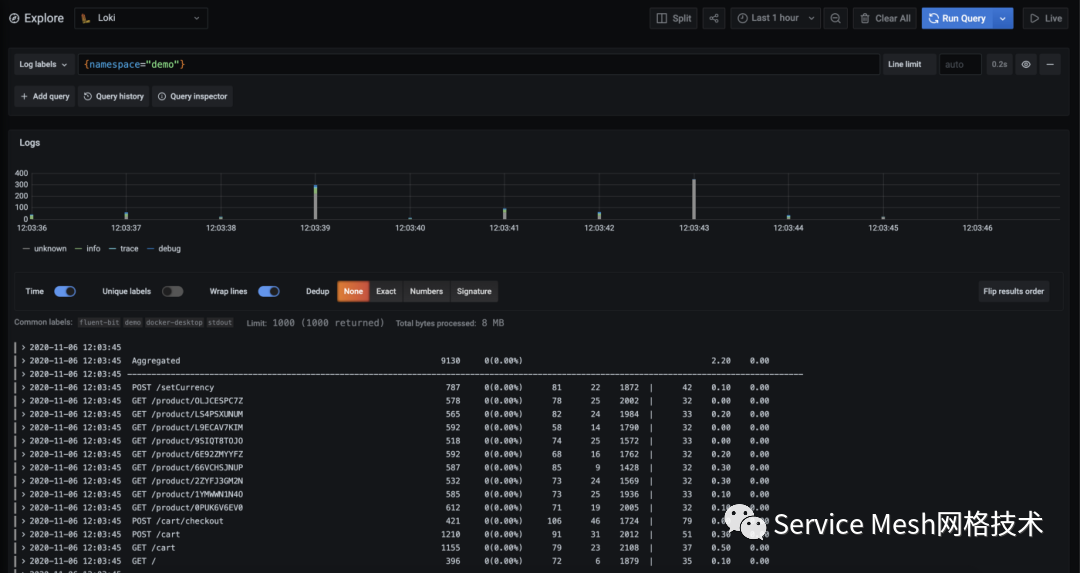 此外我们还可以添加更多的过滤器和标签,来缩小我们想要查询的日志范围。
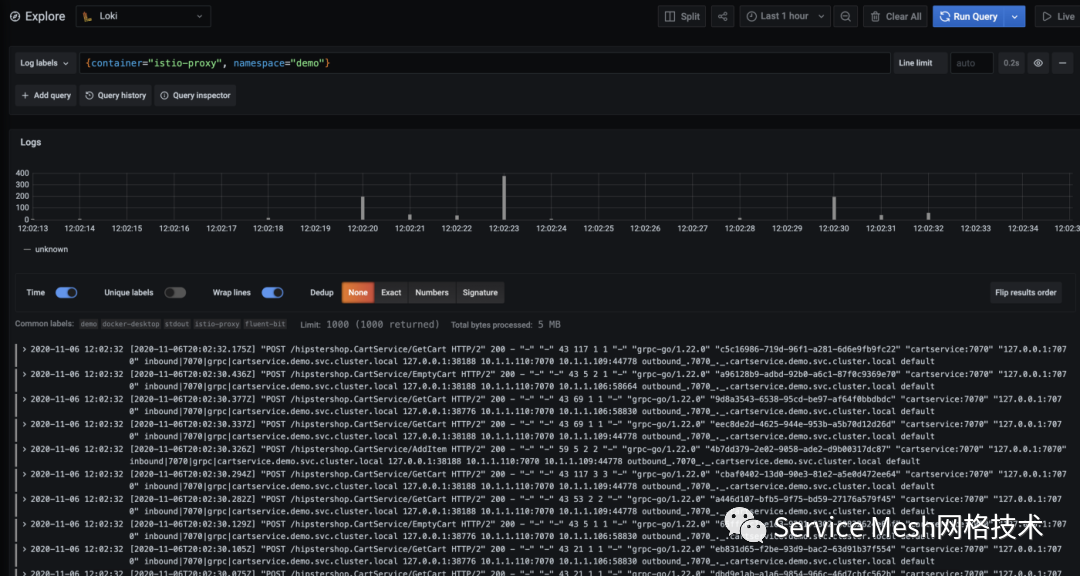
要查看来自 demo 命名空间的 istio-sidecars 的日志,可以使用语句 {container="istio-proxy", namespace="demo"}
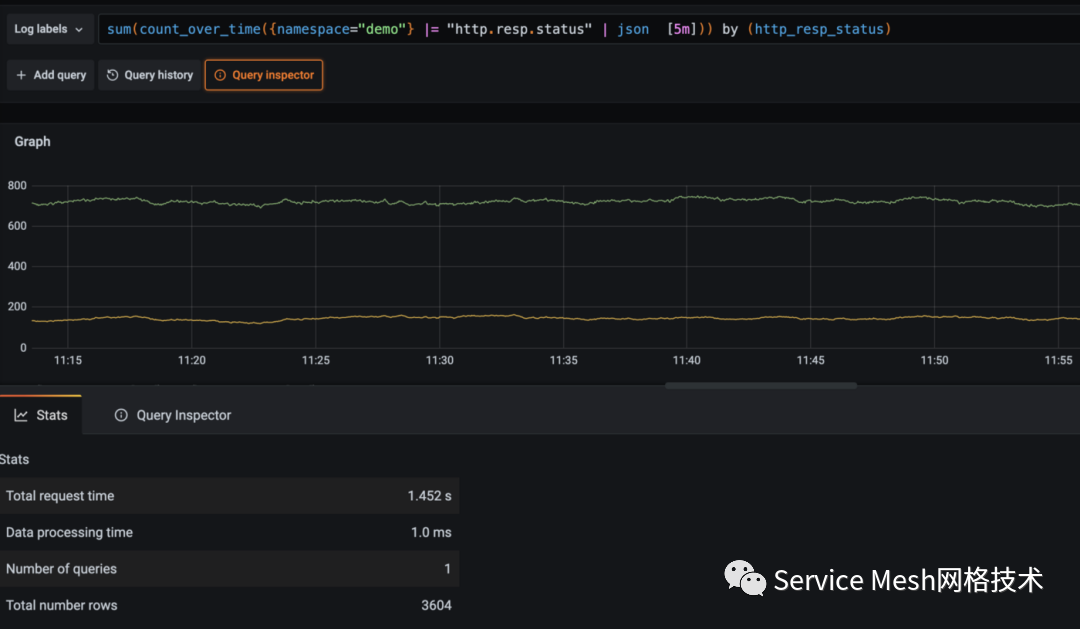
进行查询,我们也可以查找那些非正常的状态码的 http 请求 {namespace="demo"} |= "http.resp.status"!= "200"。
sum(count_over_time({namespace="demo"} |= "http.resp.status" | json [5m])) by (http_resp_status)。