


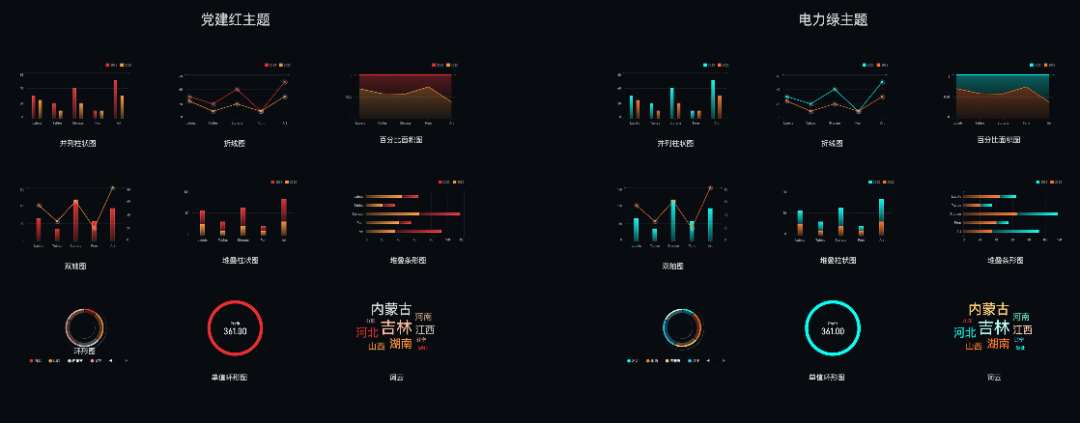
颜色主题注册和切换
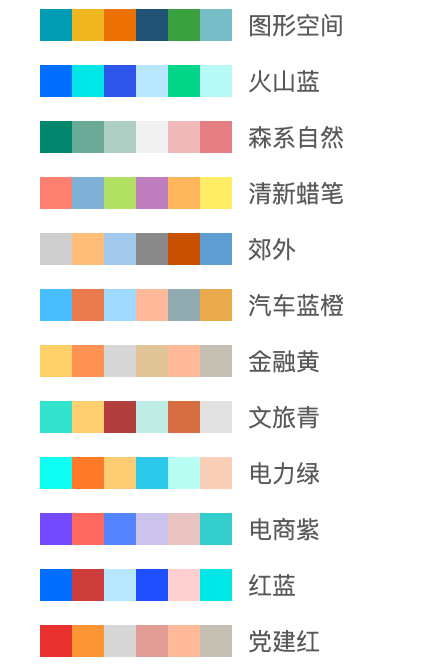
const response = await fetch('https://lf9-dp-fe-cms-tos.byteorg.com/obj/bit-cloud/theme.json');const colorTheme = await response.json();// 注册主题const theme = {};for (const colorKey in colorTheme) {const colorName = colorTheme[colorKey].name;theme[colorName] = {colorScheme: {default: colorTheme[colorKey].colors}};VChart.ThemeManager.registerTheme(colorKey, theme[colorName]);}// 主题切换VChart.ThemeManager.setCurrentTheme('volcanoBlue');
在线示例:
https://www.visactor.io/vchart/guide/tutorial_docs/Theme/Customize_Theme
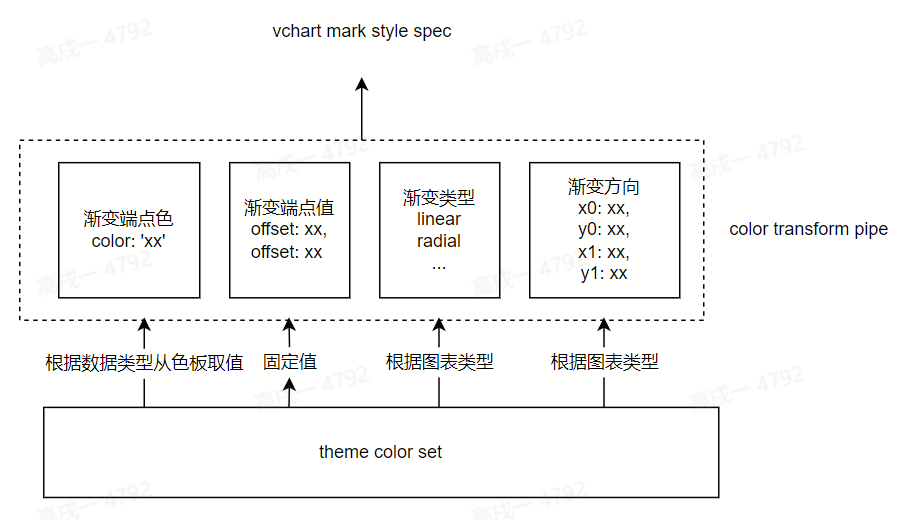
const gradientCallback = (datum, ctx, type) => {return {gradient: "linear",x0: 0,y0: 0,x1: 0,y1: 1,stops: [{offset: 0,fillOpacity: 0,color: hexToRgba(ctx.seriesColor(datum.type), 1),},{offset: 1,fillOpacity: 1,color: hexToRgba(ctx.seriesColor(datum.type), 0),}]};};// 以同样的方式在主题中注册和切换const theme = {series: {bar: {bar: {style: {fill: (datum, ctx) => gradientCallback(datum, ctx, "fill"),stroke: (datum, ctx) => gradientCallback(datum, ctx, "stroke"),lineWidth: 2}}}}}VChart.ThemeManager.registerTheme(theme, 'gradient');VChart.ThemeManager.setCurrentTheme('gradient');


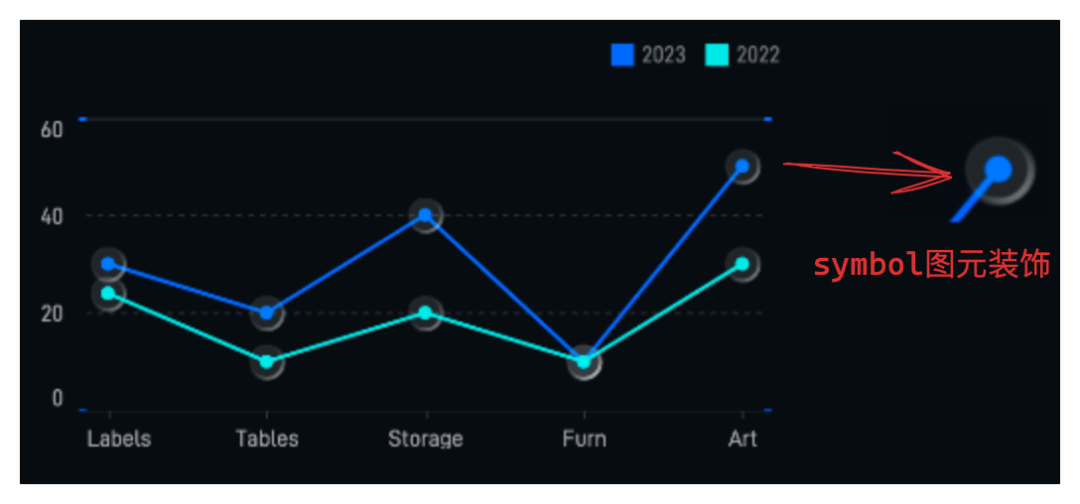
extensionMark: [{name: "markSymbol",type: "symbol",dataId: "data", 绑定的数据idvisible: true,style: {x: (datum, ctx, elements, dataView) => {return ctx.valueToX([datum["beinirRbfVnf"]]); 自定义x映射},y: (datum, ctx, elements, dataView) => {return ctx.valueToY([datum["10002"]]); 自定义y映射},size: 13,fillOpacity: 0.1,fill: "#FFF",strokeOpacity: 0.5,lineWidth: 1,stroke: {gradient: "conical",startAngle: 0,endAngle: 6.283185307179586,stops: [{offset: 0,color: "rgba(255, 255, 255, 0)"},{offset: 1,color: "rgba(255, 255, 255, 1)"}]}}}]

axes: [{// ...tick: {size: 6,visible: true,style: (...args: any[]) => { args[1]为tick index, args[3]为tick全量数据tickCount = args[3].length - 1;return {lineWidth: args[1] === 0 || args[1] === tickCount ? 2 : 0,stroke: "rgb(0,110,255)"};}}}]


强调数据重点和变换,通过设计合适的过渡和动作,可以使关键数据或信息在动画中突出显示。重点和关键变化的动画应该被放在视觉的焦点位置,使其更易于观察和理解。
吸引观众的注意,通过炫酷的动态效果可以迅速抓人眼球,但同时又需要控制速度和流畅度,以免影响观感。

animationUpdate: {type: 'moveIn',duration: 500}
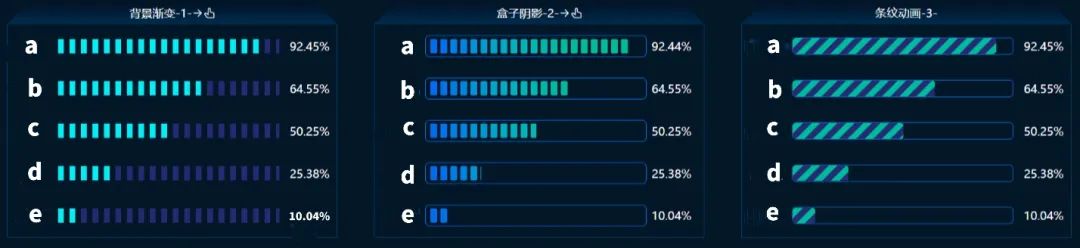
animationNormal: {bar: [{loop: true,startTime: 100,oneByOne: 100,timeSlices: [{delay: 1000,effects: {channel: {fillOpacity: { to: 0.5 }},easing: "linear"},duration: 500},{effects: {channel: {fillOpacity: { to: 1 }},easing: "linear"},duration: 500}]}]}
animationNormal: {bar: {loop: 100,duration: 1500,easing: 'quadIn',custom: VRender.StreamLight,customParameters: {attribute: {fillColor: '#bcdeff',opacity: 0.3,blur: 20,shadowColor: '#bcdeff',width: 160}}}}

const data = [{ category: '吉林', value: 50 },{ category: '内蒙古', value: 40 },{ category: '河北', value: 30 },{ category: '湖南', value: 30 },{ category: '江西', value: 24 },]
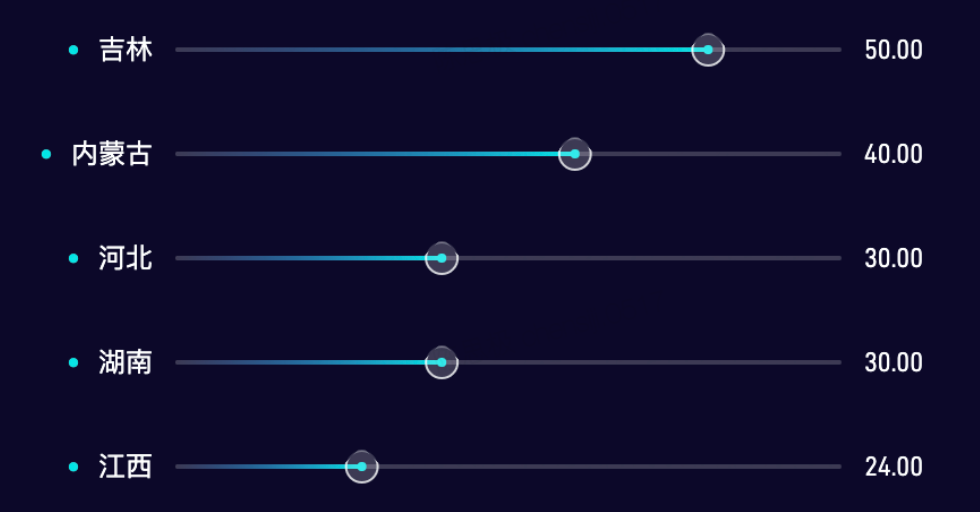
marks: [// 矩形{type: 'rect',from: { data: chartSpec.data[0].id },dependency: ['viewBox', 'xScale', 'yScale'],encode: {update: (datum, element, params) => {return {x: params.xScale.scale(dataMin), // 根据xScale做数据映射计算y: params.yScale.scale(datum['category']), // 根据yScale做数据映射计算width: params.xScale.scale(datum['value']), // 根据xScale做数据映射计算height: barWidth,// ...省略其他属性}},},},// 装饰点{type: 'symbol',from: { data: chartSpec.data[0].id },dependency: ['viewBox', 'yScale', 'xScale'],encode: {update: (datum, element, params) => {return {x: params.xScale.scale(replaceNilDatum(datum, 'value', dataMin)),y: params.yScale.scale(datum['category']),// ...省略其他属性}},},},// 标题{type: 'text',from: { data: chartSpec.data[0].id },dependency: ['viewBox', 'yScale', 'xScale'],encode: {update: (datum, element, params) => {return {text: leftTextFormatMethod(datum['category']),x: params.xScale.scale(dataMin),y: params.yScale.scale(datum['category']),// ...省略其他属性}},},},// 标签{type: 'text',from: { data: chartSpec.data[0].id },dependency: ['viewBox', 'yScale'],encode: {update: (datum, element, params) => {return {text: rightTextFormatMethod(datum['value']),x: params.viewBox.x2,y: params.yScale.scale(datum['category']),// ...省略其他属性}},},},],

// 以矩形图元为例// 入场动画enter: [{delay: 0,duration: durationTime,channel: {dy: {from: (datum, element, params) => {return params.viewBox.y2},to: 0,},},},],// 更新动画enter: [{delay: 0,duration: durationTime,channel: {width: {from: 0,to: (datum, element, params) => {return params.xScale.scale(datum['value'])}}}],// 退场动画exit: [{delay: 0,duration: durationTime,channel: {dy: {from: 0,to: (datum, element, params) => {return params.viewBox.y2},},},},],
addEventListener即可实现。
this.chartInstance.addEventListener('pointerdown', this.clickEventHandler)

产品介绍


最后修改时间:2024-01-11 10:21:38
文章转载自字节跳动数据平台,如果涉嫌侵权,请发送邮件至:contact@modb.pro进行举报,并提供相关证据,一经查实,墨天轮将立刻删除相关内容。
