大家好,分享一下上周在工作过程中, 我们要遇到的一起PG 实例 crash的案例。
上周DBA同事告诉我一条普通的日常巡检SQL,会导致PG进程的一个BUG:
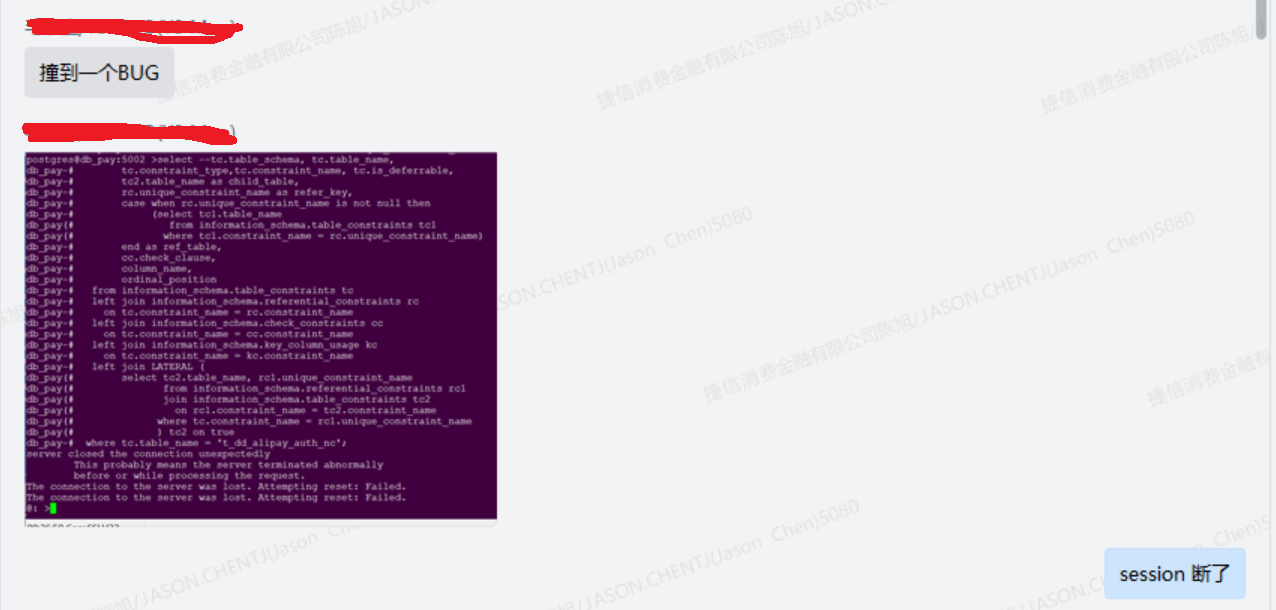
我这边本来以为是session 的进程 crash, 但是随后接到了生产环境的PG 日志监控报警邮件:
2024-01-24 10:13:45.236 CST [93775] DETAIL:  Failed process was running: select --tc.table_schema, tc.table_name,
              tc.constraint_type,tc.constraint_name, tc.is_deferrable,
              tc2.table_name as child_table,
              rc.unique_constraint_name as refer_key,
              case when rc.unique_constraint_name is not null then
                   (select tc1.table_name
                      from information_schema.table_constraints tc1
                     where tc1.constraint_name = rc.unique_constraint_name)
              end as ref_table,
              cc.check_clause,
              column_name,
              ordinal_position
         from information_schema.table_constraints tc
         left join information_schema.referential_constraints rc
           on tc.constraint_name = rc.constraint_name
         left join information_schema.check_constraints cc
           on tc.constraint_name = cc.constraint_name
         left join information_schema.key_column_usage kc
           on tc.constraint_name = kc.constraint_name
         left join (
              select tc2.table_name, rc1.unique_constraint_name
                     from information_schema.referential_constraints rc1
                     join informa
2024-01-24 10:13:45.236 CST [93775] LOG:  terminating any other active server processes
2024-01-24 10:13:45.338 CST [149275] [unknown]@[unknown]-[local]/[unknown]LOG:  connection received: host=[local]
2024-01-24 10:13:45.338 CST [149275] postgres@db_pay-[local]/[unknown]FATAL:  the database system is in recovery mode
我才意识到了事情的严重性:
terminating any other active server processes --所有的进程有被terminate掉了
the database system is in recovery mode --主库变成了 recovery mode 的状态了
紧接着应用端大量程序的连接出现了中断:
2024-01-24 10:13:45.351 CST [149277] [unknown]@[unknown]-10.67.14.10/[unknown]LOG:  connection received: host=10.67.14.10 port=37322
2024-01-24 10:13:45.354 CST [149278] [unknown]@[unknown]-10.26.213.40/[unknown]LOG:  connection received: host=10.26.213.40 port=38790
2024-01-24 10:13:45.354 CST [149278] app_doris_jetcollect@db_pay-10.26.213.40/[unknown]FATAL:  the database system is in recovery mode
2024-01-24 10:13:45.356 CST [149279] [unknown]@[unknown]-10.25.14.147/[unknown]LOG:  connection received: host=10.25.14.147 port=52322
2024-01-24 10:13:45.357 CST [149279] repmgr@[unknown]-10.25.14.147/[unknown]FATAL:  the database system is in recovery mode
2024-01-24 10:13:45.361 CST [149280] [unknown]@[unknown]-127.0.0.1/[unknown]LOG:  connection received: host=127.0.0.1 port=48756
2024-01-24 10:13:45.361 CST [149280] postgres@postgres-127.0.0.1/[unknown]FATAL:  the database system is in recovery mode
2024-01-24 10:13:45.365 CST [149281] [unknown]@[unknown]-127.0.0.1/[unknown]LOG:  connection received: host=127.0.0.1 port=48770
2024-01-24 10:13:45.365 CST [149281] postgres@postgres-127.0.0.1/[unknown]FATAL:  the database system is in recovery mode
2024-01-24 10:13:45.372 CST [149277] repmgr@[unknown]-10.67.14.10/[unknown]FATAL:  the database system is in recovery mode
随后日志里发现PG进行所有进程的 reinitializing:
2024-01-24 10:13:45.426 CST [93775] LOG:  all server processes terminated; reinitializing
2024-01-24 10:13:46.720 CST [149287] LOG:  database system was interrupted; last known up at 2024-01-24 10:05:34 CST
待所有backgroud process 启动后,马上进入了carsh 之后的自我恢复过程:
2024-01-24 10:13:49.038 CST [149287] LOG:  database system was not properly shut down; automatic recovery in progress
2024-01-24 10:13:49.045 CST [149287] LOG:  redo starts at 21B/EDFA27D0
2024-01-24 10:13:49.058 CST [149287] LOG:  invalid record length at 21B/EE0818D0: wanted 24, got 0
2024-01-24 10:13:49.058 CST [149287] LOG:  redo done at 21B/EE0818A8 system usage: CPU: user: 0.00 s, system: 0.00 s, elapsed: 0.01 s
2024-01-24 10:13:49.064 CST [149288] LOG:  checkpoint starting: end-of-recovery immediate wait
很幸运数据库自我恢复完成,会进行一个checkpint操作, 此时数据库是 is ready to accept connections 的状态了
2024-01-24 10:13:49.370 CST [149288] LOG:  checkpoint complete: wrote 233 buffers (0.0%); 0 WAL file(s) added, 1 removed, 0 recycled; write=0.277 s, sync=0.016 s, total=0.307 s; sync files=154, longest=0.001 s, average=0.001 s; distance=892 kB, estimate=892 kB
2024-01-24 10:13:49.380 CST [149376] LOG:  pg_partman master background worker master process initialized with role postgres
2024-01-24 10:13:49.381 CST [93775] LOG:  database system is ready to accept connections
从触发bug开始引起pg crash (2024-01-24 10:13:45.236)到 pg crach后的自我恢复完成(2024-01-24 10:13:49.381),大致的造成了4~5秒数据库不可用的时间。
4~5秒数据库不可用的时间: 对于高平发的系统来说,可能是几万,10几万的数据会失败掉。。。
同时我们也发现OS 的日志也出现了错误: segfault at 1e5dffb ip 00007f907824e776 sp 00007ffea7f71408 error 4 in libc-2.17.so[7f90780f8000+1c4000]
初步判断可能是内存泄漏的问题。。。
Jan 24 10:13:45 whdcpsql002 kernel: postgres[140220]: segfault at 1e5dffb ip 00007f907824e776 sp 00007ffea7f71408 error 4 in libc-2.17.so[7f90780f8000+1c4000]
Jan 24 10:13:45 whdcpsql002 kernel: Code: ca 48 31 c9 48 81 ea 80 00 00 00 48 81 ea 80 00 00 00 0f 18 8e 00 fe ff ff 0f 18 8e 00 fd ff ff f3 0f 6f 4e f0 f3 0f 6f 56 e0 <f3> 0f 6f 5e d0 f3 0f 6f 66 c0 f3 0f 6f 6e b0 f3 0f 6f 76 a0 f3 0f
Jan 24 10:13:45 whdcpsql002 abrt-hook-ccpp: Process 140220 (postgres) of user 1004 killed by SIGSEGV - dumping core
Jan 24 10:13:45 whdcpsql002 abrt-server: Executable '/opt/pgsql-15/bin/postgres' doesn't belong to any package and ProcessUnpackaged is set to 'no'
Jan 24 10:13:45 whdcpsql002 abrt-server: 'post-create' on '/var/spool/abrt/ccpp-2024-01-24-10:13:45-140220' exited with 1
Jan 24 10:13:45 whdcpsql002 abrt-server: Deleting problem directory '/var/spool/abrt/ccpp-2024-01-24-10:13:45-140220'
SQL本身很简单,就是一个查询表之前的主外键关系的语句,复现过程如下:
The reproduce step as below :


1.Connect to an empty database.(I created new database named tmp_db)


postgres@postgres:5007 >create database tmp_db template template0;
CREATE DATABASE
postgres@postgres:5007 >\c tmp_db postgres
You are now connected to database "tmp_db" as user "postgres".


2.Create 2 tables : A is parent table , B is child table


create table A (id int primary key, name varchar(20));
create table B (id int primary key, name varchar(20), pid int);
ALTER TABLE B ADD CONSTRAINT fk_a_id FOREIGN KEY (pid) REFERENCES A(id) ;


3.Run below SQL:


select tc.table_schema, tc.table_name,
      tc.constraint_type,tc.constraint_name, tc.is_deferrable,
      tc2.table_name as child_table,
      rc.unique_constraint_name as refer_key,
      case when rc.unique_constraint_name is not null then
           (select tc1.table_name
              from information_schema.table_constraints tc1
             where tc1.constraint_name = rc.unique_constraint_name)
      end as ref_table,
      cc.check_clause,
      kc.column_name,
      kc.ordinal_position
 from information_schema.table_constraints tc
 left join information_schema.referential_constraints rc
   on tc.constraint_name = rc.constraint_name
 left join information_schema.check_constraints cc
   on tc.constraint_name = cc.constraint_name
 left join information_schema.key_column_usage kc
   on tc.constraint_name = kc.constraint_name
 left join LATERAL (
      select tc2.table_name, rc1.unique_constraint_name
             from information_schema.referential_constraints rc1
             join information_schema.table_constraints tc2
               on rc1.constraint_name = tc2.constraint_name
            where tc.constraint_name = rc1.unique_constraint_name
            ) tc2 on true
where tc.table_name = 'a';


Got ERROR:
server closed the connection unexpectedly
   This probably means the server terminated abnormally
   before or while processing the request.
The connection to the server was lost. Attempting reset: Failed.
The connection to the server was lost. Attempting reset: Failed.
由于是生产环境出现的问题, 我们为PG社区提交一个BUG, 打开官网的首页: https://www.postgresql.org/
找到页面最下面的submit bug

我们采取第三方github的登录方式:

第一次登陆的话 会让你注册一个账户:
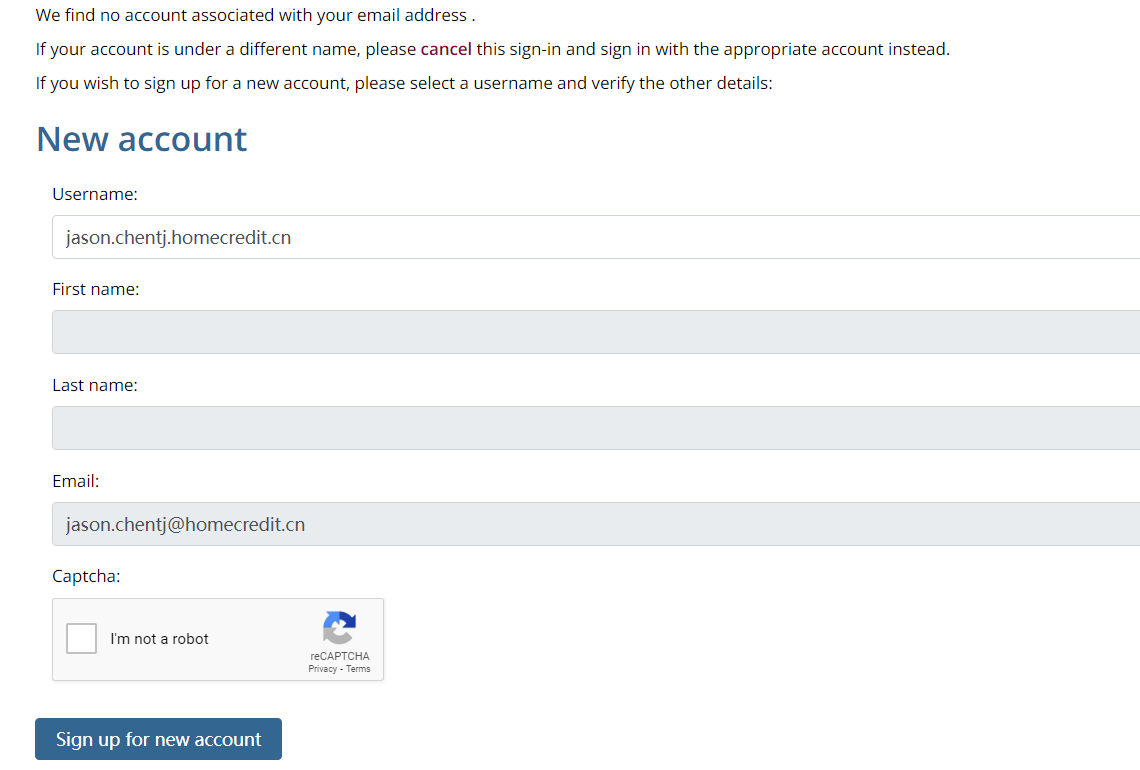
我们在正文填写BUG的内容 就可以了:
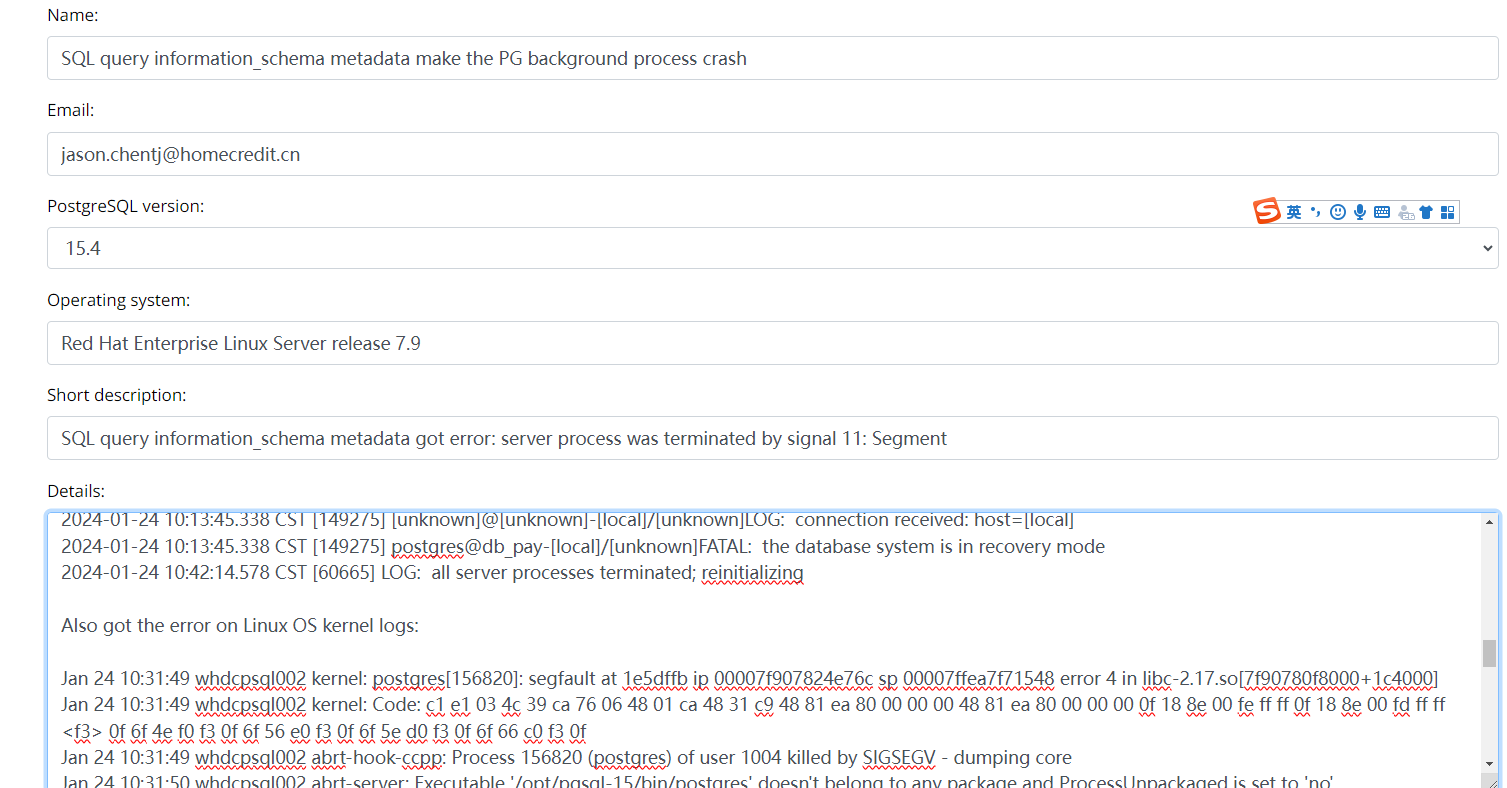
提交成功后,你会得到一个 bug id .

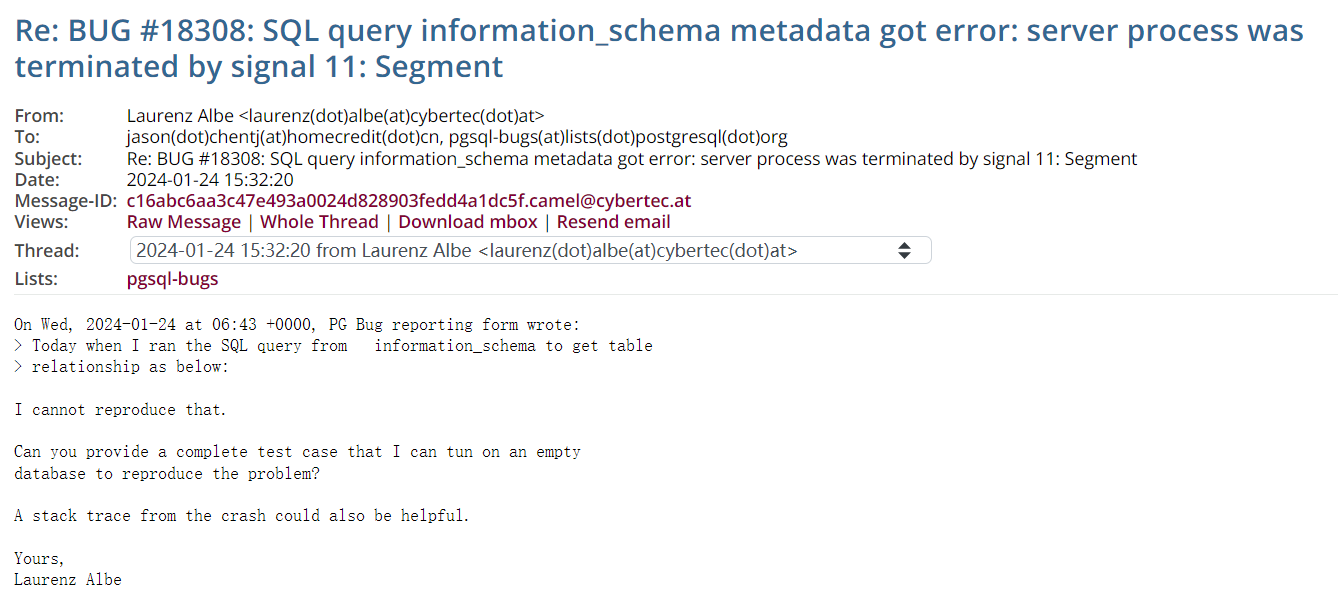
PG社区的回复效率昊是很快的,马上的收到了cybertech CEO 亲自回复:
https://www.postgresql.org/message-id/c16abc6aa3c47e493a0024d828903fedd4a1dc5f.camel%40cybertec.at
需要我这边提供复现的具体步骤和进程的stack trace 信息。
接下来又在测试环境中用GDB命令工具,打印一下进程的信息:
Let's try again to collect the stack trace


postgres@postgres:5007 >\c tmp_db
You are now connected to database "tmp_db" as user "postgres".
postgres@tmp_db:5007 >select pg_backend_pid();
pg_backend_pid
----------------
           2611
(1 row)
sudo gdb -p 2611
PROD [postgres@whdcpsql006 ~]#sudo gdb -p 2611
GNU gdb (GDB) Red Hat Enterprise Linux 7.6.1-120.0.3.el7
Copyright (C) 2013 Free Software Foundation, Inc.
License GPLv3+: GNU GPL version 3 or later <http://gnu.org/licenses/gpl.html>
This is free software: you are free to change and redistribute it.
There is NO WARRANTY, to the extent permitted by law.  Type "show copying"
and "show warranty" for details.
This GDB was configured as "x86_64-redhat-linux-gnu".
For bug reporting instructions, please see:
<http://www.gnu.org/software/gdb/bugs/>.
Attaching to process 2611
Reading symbols from /opt/pgsql-15/bin/postgres...(no debugging symbols found)...done.
Reading symbols from /lib64/libzstd.so.1...Reading symbols from /lib64/libzstd.so.1...(no debugging symbols found)...done.
(no debugging symbols found)...done.
Loaded symbols for /lib64/libzstd.so.1
Reading symbols from /lib64/liblz4.so.1...Reading symbols from /lib64/liblz4.so.1...(no debugging symbols found)...done.
(no debugging symbols found)...done.
Loaded symbols for /lib64/liblz4.so.1
Reading symbols from /lib64/libxml2.so.2...Reading symbols from /lib64/libxml2.so.2...(no debugging symbols found)...done.
(no debugging symbols found)...done.
Loaded symbols for /lib64/libxml2.so.2
Reading symbols from /lib64/libssl.so.10...Reading symbols from /lib64/libssl.so.10...(no debugging symbols found)...done.
(no debugging symbols found)...done.
Loaded symbols for /lib64/libssl.so.10
Reading symbols from /lib64/libcrypto.so.10...Reading symbols from /lib64/libcrypto.so.10...(no debugging symbols found)...done.
(no debugging symbols found)...done.
Loaded symbols for /lib64/libcrypto.so.10
Reading symbols from /lib64/libz.so.1...Reading symbols from /lib64/libz.so.1...(no debugging symbols found)...done.
(no debugging symbols found)...done.
Loaded symbols for /lib64/libz.so.1
Reading symbols from /lib64/libpthread.so.0...(no debugging symbols found)...done.
[Thread debugging using libthread_db enabled]
Using host libthread_db library "/lib64/libthread_db.so.1".
Loaded symbols for /lib64/libpthread.so.0
Reading symbols from /lib64/librt.so.1...(no debugging symbols found)...done.
Loaded symbols for /lib64/librt.so.1
Reading symbols from /lib64/libdl.so.2...(no debugging symbols found)...done.
Loaded symbols for /lib64/libdl.so.2
Reading symbols from /lib64/libm.so.6...(no debugging symbols found)...done.
Loaded symbols for /lib64/libm.so.6
Reading symbols from /lib64/libc.so.6...(no debugging symbols found)...done.
Loaded symbols for /lib64/libc.so.6
Reading symbols from /lib64/liblzma.so.5...Reading symbols from /lib64/liblzma.so.5...(no debugging symbols found)...done.
(no debugging symbols found)...done.
Loaded symbols for /lib64/liblzma.so.5
Reading symbols from /lib64/libgssapi_krb5.so.2...Reading symbols from /lib64/libgssapi_krb5.so.2...(no debugging symbols found)...done.
(no debugging symbols found)...done.
Loaded symbols for /lib64/libgssapi_krb5.so.2
Reading symbols from /lib64/libkrb5.so.3...Reading symbols from /lib64/libkrb5.so.3...(no debugging symbols found)...done.
(no debugging symbols found)...done.
Loaded symbols for /lib64/libkrb5.so.3
Reading symbols from /lib64/libcom_err.so.2...Reading symbols from /lib64/libcom_err.so.2...(no debugging symbols found)...done.
(no debugging symbols found)...done.
Loaded symbols for /lib64/libcom_err.so.2
Reading symbols from /lib64/libk5crypto.so.3...Reading symbols from /lib64/libk5crypto.so.3...(no debugging symbols found)...done.
(no debugging symbols found)...done.
Loaded symbols for /lib64/libk5crypto.so.3
Reading symbols from /lib64/ld-linux-x86-64.so.2...(no debugging symbols found)...done.
Loaded symbols for /lib64/ld-linux-x86-64.so.2
Reading symbols from /lib64/libkrb5support.so.0...Reading symbols from /lib64/libkrb5support.so.0...(no debugging symbols found)...done.
(no debugging symbols found)...done.
Loaded symbols for /lib64/libkrb5support.so.0
Reading symbols from /lib64/libkeyutils.so.1...Reading symbols from /lib64/libkeyutils.so.1...(no debugging symbols found)...done.
(no debugging symbols found)...done.
Loaded symbols for /lib64/libkeyutils.so.1
Reading symbols from /lib64/libresolv.so.2...(no debugging symbols found)...done.
Loaded symbols for /lib64/libresolv.so.2
Reading symbols from /lib64/libselinux.so.1...Reading symbols from /lib64/libselinux.so.1...(no debugging symbols found)...done.
(no debugging symbols found)...done.
Loaded symbols for /lib64/libselinux.so.1
Reading symbols from /lib64/libpcre.so.1...Reading symbols from /lib64/libpcre.so.1...(no debugging symbols found)...done.
(no debugging symbols found)...done.
Loaded symbols for /lib64/libpcre.so.1
Reading symbols from /opt/pgsql-15/lib/pg_stat_statements.so...(no debugging symbols found)...done.
Loaded symbols for /opt/pgsql-15/lib/pg_stat_statements.so
Reading symbols from /opt/pgsql-15/lib/pg_cron.so...(no debugging symbols found)...done.
Loaded symbols for /opt/pgsql-15/lib/pg_cron.so
Reading symbols from /opt/pgsql-15/lib/libpq.so.5...(no debugging symbols found)...done.
Loaded symbols for /opt/pgsql-15/lib/libpq.so.5
Reading symbols from /opt/pgsql-15/lib/pg_partman_bgw.so...(no debugging symbols found)...done.
Loaded symbols for /opt/pgsql-15/lib/pg_partman_bgw.so
Reading symbols from /opt/pgsql-15/lib/pgaudit.so...(no debugging symbols found)...done.
Loaded symbols for /opt/pgsql-15/lib/pgaudit.so
Reading symbols from /opt/pgsql-15/lib/repmgr.so...done.
Loaded symbols for /opt/pgsql-15/lib/repmgr.so
Reading symbols from /opt/pgsql-15/lib/auto_explain.so...(no debugging symbols found)...done.
Loaded symbols for /opt/pgsql-15/lib/auto_explain.so
Reading symbols from /opt/pgsql-15/lib/pg_show_plans.so...(no debugging symbols found)...done.
Loaded symbols for /opt/pgsql-15/lib/pg_show_plans.so
0x00007fb094c300e3 in __epoll_wait_nocancel () from /lib64/libc.so.6
Missing separate debuginfos, use: debuginfo-install glibc-2.17-326.0.9.el7_9.x86_64 keyutils-libs-1.5.8-3.el7.x86_64 krb5-libs-1.15.1-55.0.1.el7_9.x86_64 libcom_err-1.45.4-3.0.5.el7.x86_64 libselinux-2.5-15.el7.x86_64 libxml2-2.9.1-6.0.3.el7_9.6.x86_64 libzstd-1.5.5-1.el7.x86_64 lz4-1.8.3-1.el7.x86_64 openssl-libs-1.0.2k-26.el7_9.x86_64 pcre-8.32-17.el7.x86_64 xz-libs-5.2.2-2.el7_9.x86_64 zlib-1.2.7-21.el7_9.x86_64
(gdb) set pagination off
(gdb) set logging file debuglog.txt
(gdb) set logging on
Copying output to debuglog.txt.
(gdb) cont
Continuing.
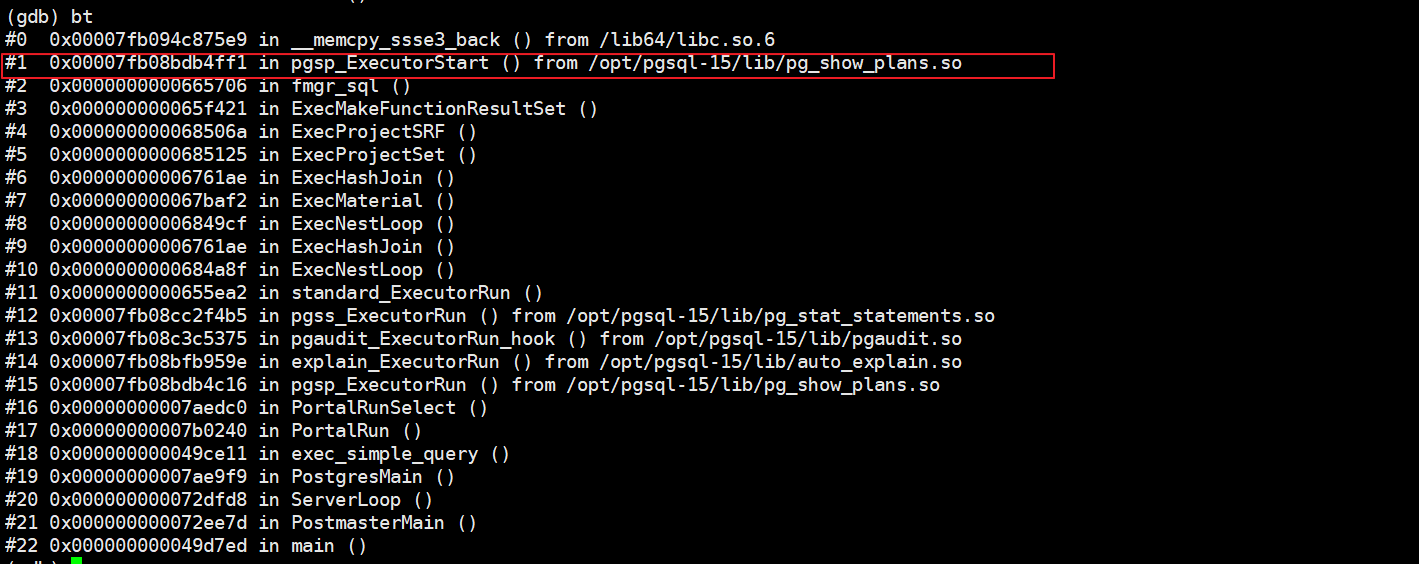
打印一下堆栈信息: 瞬间感觉到是不是插件 pg_show_plans的问题?
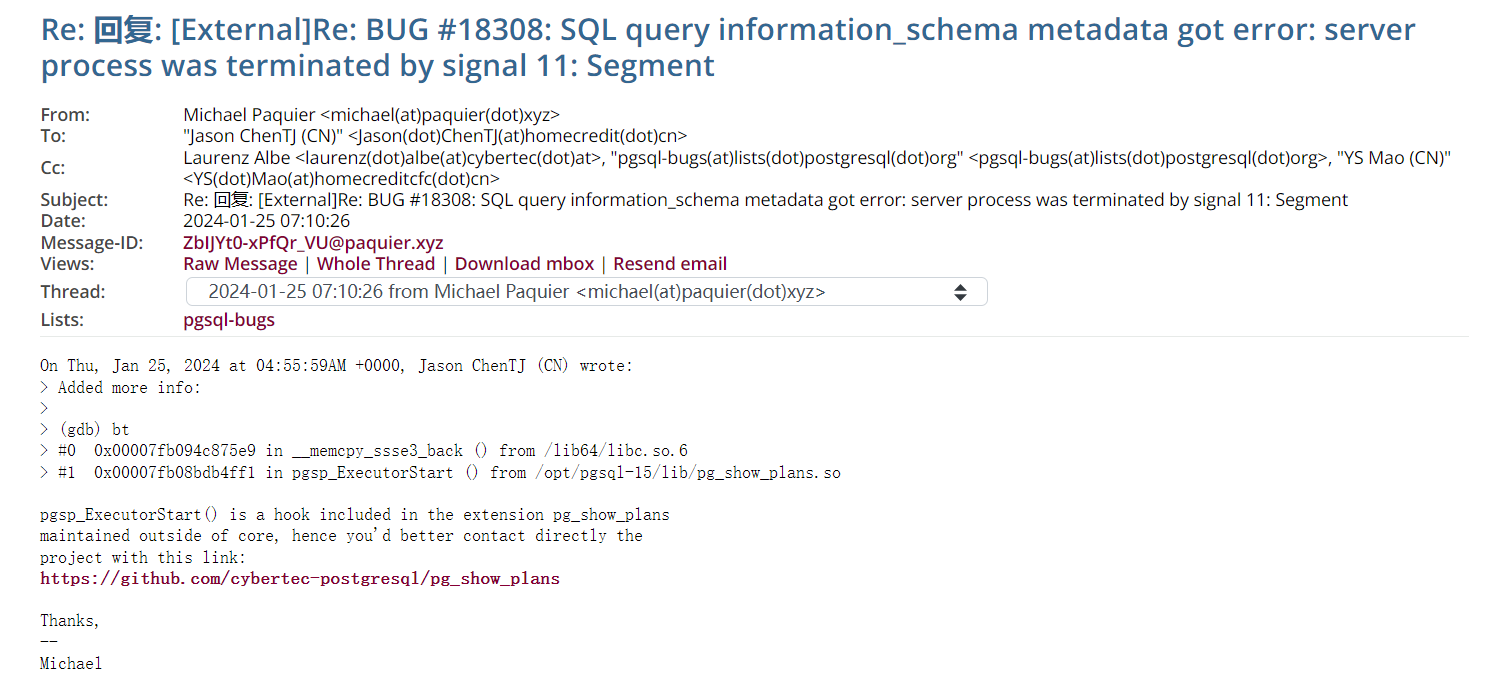
我把收集到的信息回复到了邮件中,很快得到了另外一位PG大神 Micheal 的确认回复:
https://www.postgresql.org/message-id/ZbIJYt0-xPfQr_VU%40paquier.xyz
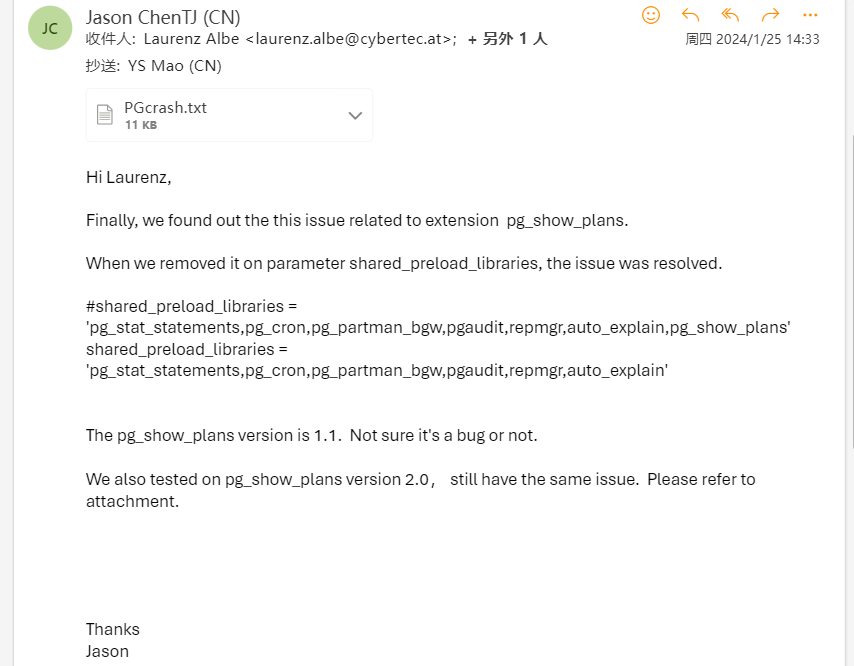
我们接着尝试把extension 从启动参数中移除,这个问题确实就消失了。
很巧的是 这个插件正是 cybertech 的自家产品,我们给CEO 大神 Laurenz 发了邮件:
最后,CEO 亲自在github 上开了个 issue:
https://github.com/cybertec-postgresql/pg_show_plans/issues/33
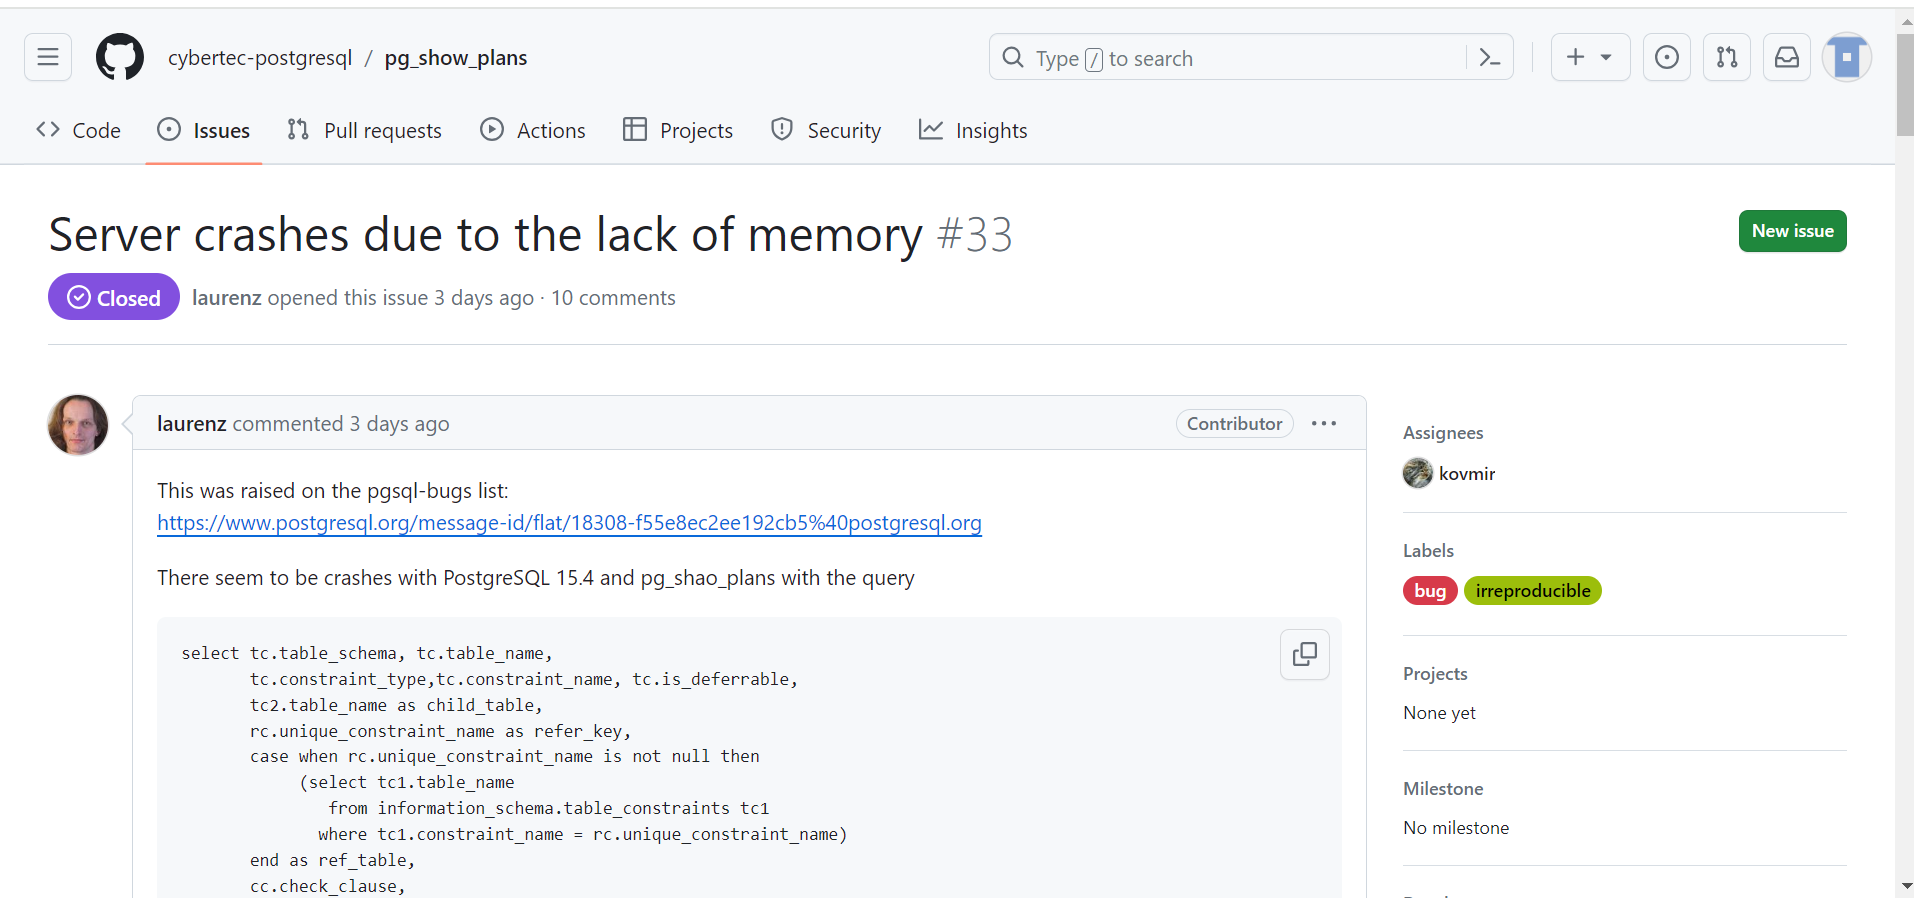
工程师很快就定位到了代码的问题并且及时进行了修复:应该是一个内存溢出的问题。
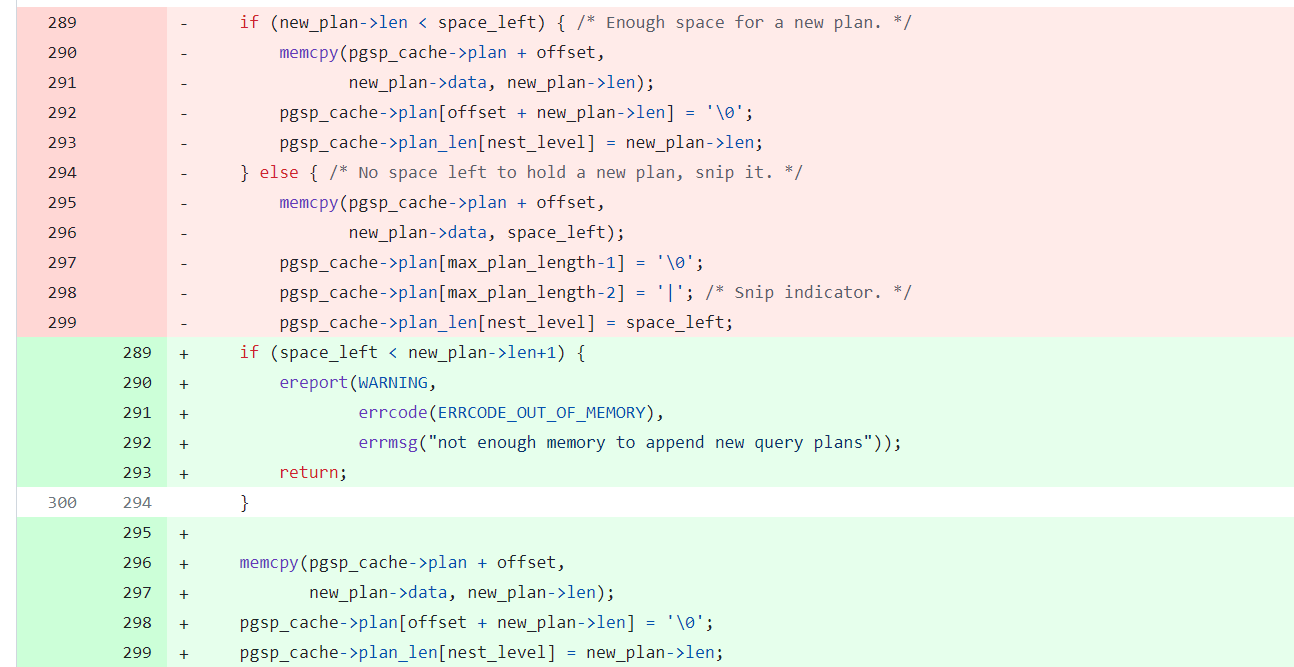
新版本v2.1.0 里已经修复了这个问题:

最后不知道国内的云数据库RDS厂商是否也存在这个问题,也要进行插件升级呢
Have a fun 🙂 !


