


一、linux主机操作
1、Linux主机安装 Im_sensors
[root@localhost ~]# yum install -y lm-sensors-y[root@localhost ~]# sensors-detect
一直yes,然后重启zabbix-agent服务
2、Im_sensors查看显示结果
[[root@Zabbix ~]# sensorsi5k_amb-isa-0000Adapter: ISA adapterCh. 0 DIMM 0: +55.5°C (low = +100.5°C, high = +124.0°C)Ch. 1 DIMM 0: +57.5°C (low = +100.5°C, high = +124.0°C)coretemp-isa-0000Adapter: ISA adapterCore 0: +45.0°C (high = +82.0°C, crit = +100.0°C)Core 1: +41.0°C (high = +82.0°C, crit = +100.0°C)Core 2: +44.0°C (high = +82.0°C, crit = +100.0°C)Core 3: +45.0°C (high = +82.0°C, crit = +100.0°C)coretemp-isa-0001Adapter: ISA adapterCore 0: +46.0°C (high = +82.0°C, crit = +100.0°C)Core 1: +46.0°C (high = +82.0°C, crit = +100.0°C)Core 2: +48.0°C (high = +82.0°C, crit = +100.0°C)Core 3: +48.0°C (high = +82.0°C, crit = +100.0°C)w83627hf-isa-0a00Adapter: ISA adapterin0: +1.15 V (min = +0.00 V, max = +4.08 V)in1: +1.15 V (min = +0.00 V, max = +4.08 V)in2: +3.39 V (min = +2.82 V, max = +3.79 V)in3: +3.02 V (min = +3.57 V, max = +4.08 V) ALARMin4: +1.50 V (min = +4.00 V, max = +2.03 V) ALARMin5: +1.82 V (min = +3.82 V, max = +3.82 V) ALARMin6: +3.38 V (min = +4.06 V, max = +4.05 V) ALARMin7: +3.34 V (min = +3.81 V, max = +4.02 V) ALARMin8: +3.33 V (min = +3.82 V, max = +3.06 V) ALARMfan1: 0 RPM (min = 1328 RPM, div = 8) ALARMfan2: 7031 RPM (min = 0 RPM, div = 8)fan3: 0 RPM (min = 883 RPM, div = 8) ALARMtemp1: +34.0°C (high = -1.0°C, hyst = -68.0°C) ALARM sensor = thermistortemp2: -3.0°C (high = +80.0°C, hyst = +75.0°C) sensor = CPU diodetemp3: -3.0°C (high = +80.0°C, hyst = +75.0°C) sensor = CPU diodecpu0_vid: +1.419 Vbeep_enable: enabled
3、提取sensors显示数字:100.0(取Physical这行ID为0的第35-39的数值,多核就改变$0的值。-c后面的数字也根据主机显示结果改动)
[root@localhost ~]# sensors|grep "Physical id $0"|cut -c 35-39100.0
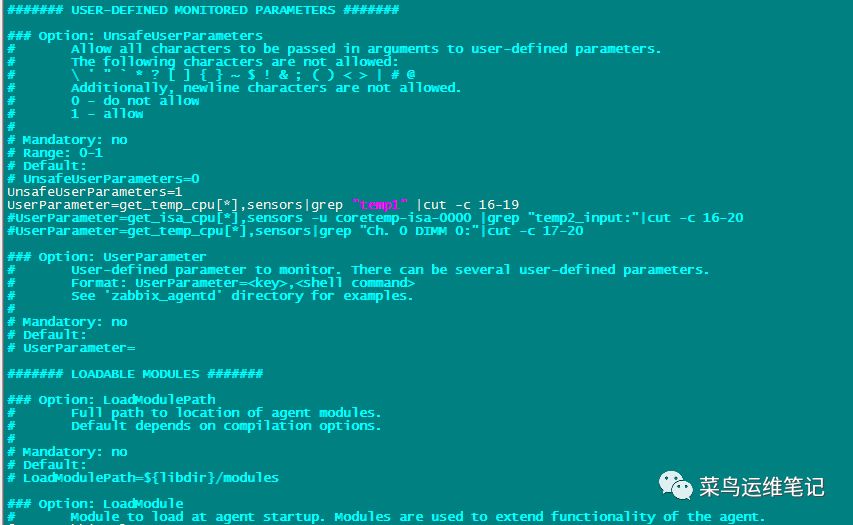
4、修改客户端配置文件zabbix-agent.conf
修改并添加以下内容
[root@localhost ~]# vim /etc/zabbix/zabbix_agentd.confUnsafeUserParameters=1UserParameter=get_temp_cpu[*],sensors|grep "temp1" |cut -c 16-1
修改后的文件
保存退出,重启zabbix-agent服务
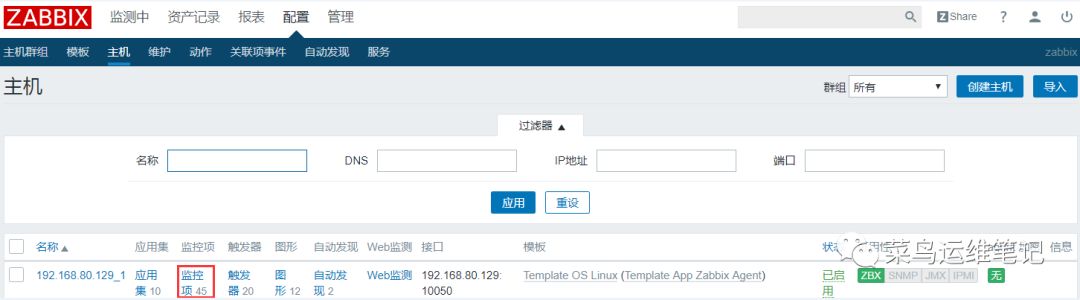
二、zabbix服务器端操作
1、点击对应主机监控项
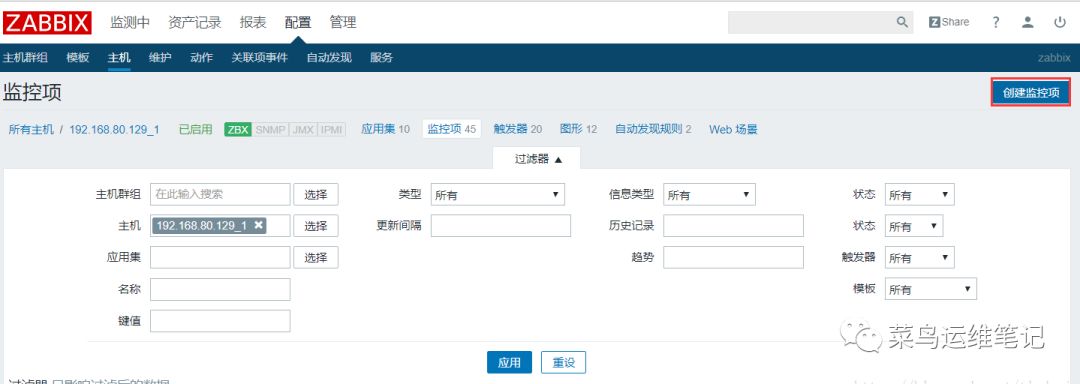
2、创建监控项
3、填写监控项信息
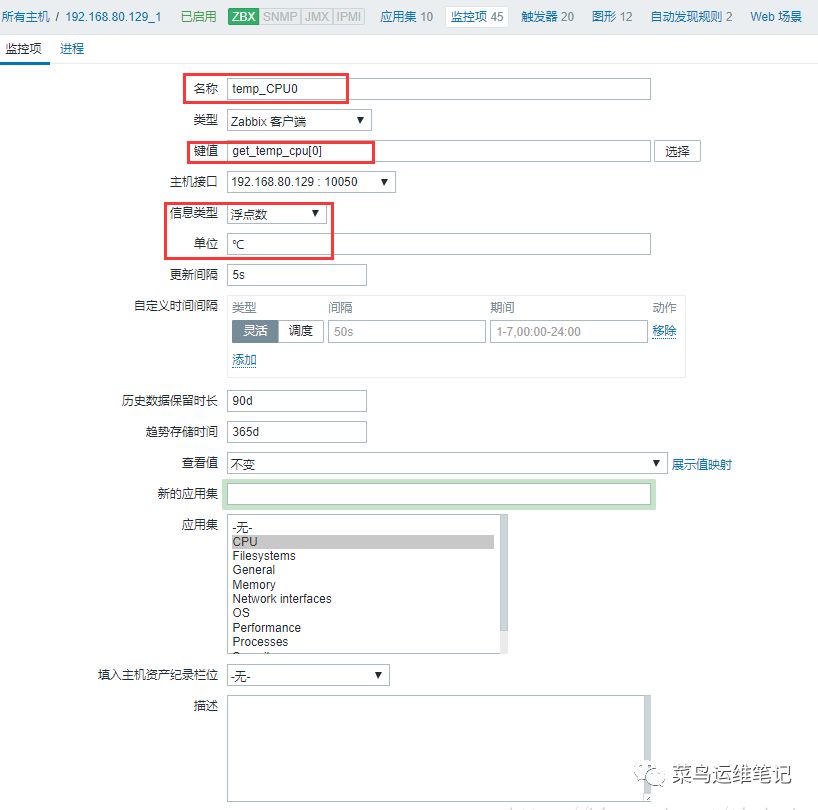
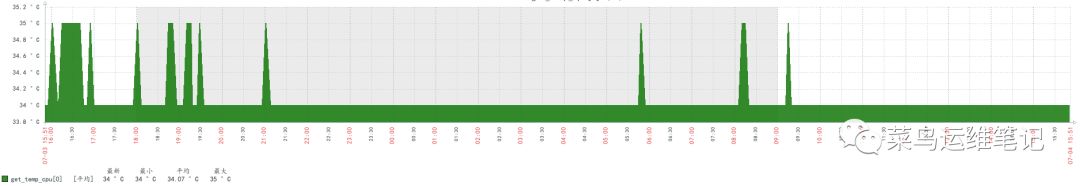
4、有了监控项就可以添加监控图形了
文章转载自菜鸟运维笔记,如果涉嫌侵权,请发送邮件至:contact@modb.pro进行举报,并提供相关证据,一经查实,墨天轮将立刻删除相关内容。
