PostgreSQL的where索引列用limit时order by走主键索引场景分析
看腻了就来听听视频演示吧:https://www.bilibili.com/video/BV1qi421Z7E2/
在PG类数据库发现一个有趣的案例,SQL格式
select id from 表 where xxx and xxx order by id desc limit 1
1、现象介绍
生产case同下文MySQL介绍场景十分类型,limit 1 要几分钟 limit 2+ 或减少where后的and条件查询时间均在毫秒内,测试环境造的数据分布仅模拟复现大致场景。
Mysql-where索引列+orderby主键+limit索引情况分析:
https://zhuanlan.zhihu.com/p/356463167
MySQL官方文档介绍:
https://dev.mysql.com/doc/refman/8.0/en/limit-optimization.html
2、场景复现
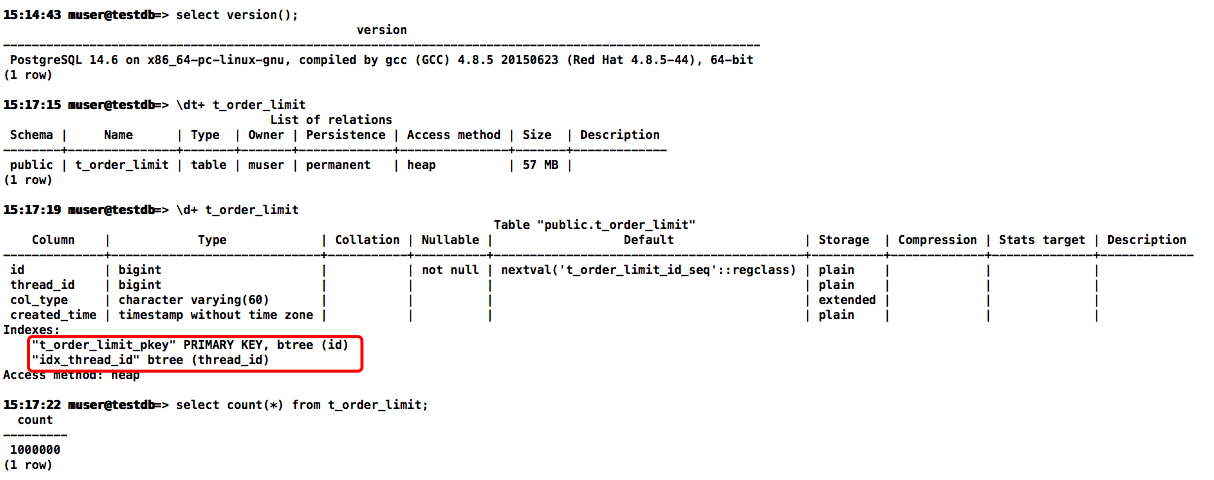
在测试环境模拟大致复现了下场景(PostgreSQL版本:14.6)
-- 创建测试表和数据
drop table IF EXISTS t_order_limit;
create table t_order_limit(id bigserial PRIMARY KEY,thread_id bigint,col_type varchar(60),created_time timestamp);
insert into t_order_limit(thread_id,col_type,created_time) select id+ceil(random()*100),'Oracle',clock_timestamp() from generate_series(1,1000) as id;
insert into t_order_limit(thread_id,col_type,created_time) select 10086,'PG',clock_timestamp();
insert into t_order_limit(thread_id,col_type,created_time) select 10086,null,clock_timestamp() from generate_series(1002,30000) as id;
insert into t_order_limit(thread_id,col_type,created_time) select id+ceil(random()*100),'MySQL',clock_timestamp() from generate_series(30001,1000000) as id;
create index idx_thread_id on t_order_limit(thread_id);
vacuum analyze t_order_limit;
生产环境的数据分布 limit 2+ 执行计划就变了,不走主键索引
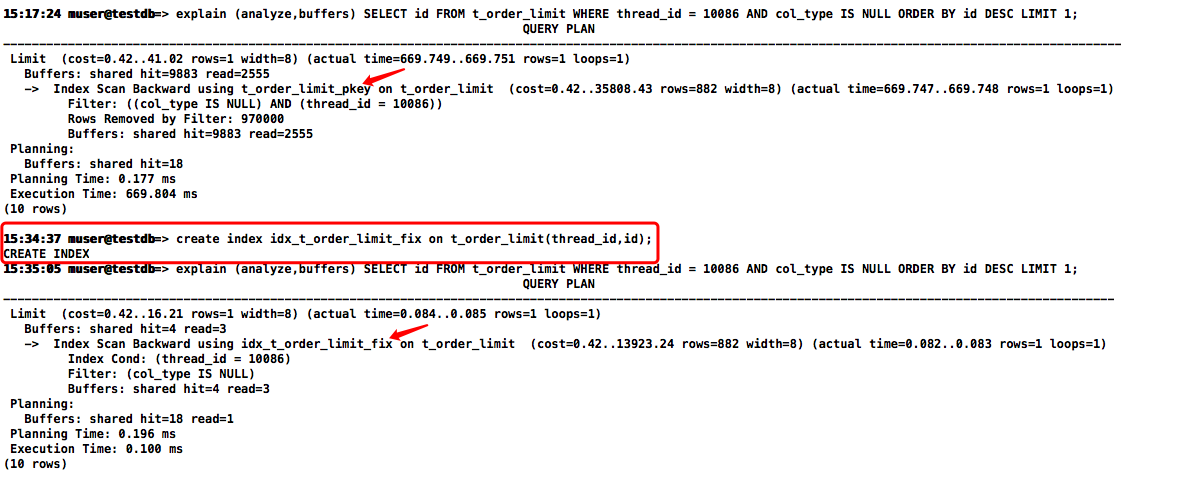
explain (analyze,buffers) SELECT id FROM t_order_limit WHERE thread_id = 10086 AND col_type IS NULL ORDER BY id DESC LIMIT 1;

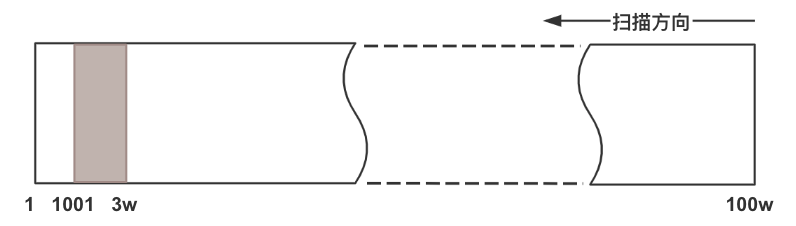
3、现象分析
主要是数据分布位置问题,测试数据 thread_id = 10086 对应的 id 范围是 1001 ~ 30000,又要求排序和 LIMIT 1,所以优化器认为倒序扫描pkey最优。而因为物理位置的原因,其实需要扫描几乎整个索引,这个是无法提前预知的。
优化器只能假设 thread_id = 10086 的结果集在 id 的 pkey上均匀(随机)分布,在不知道它们二者之间的关系时,这是最合理的假设,而实际情况并非如此。所以创建组合索引其实就是建立了它们之间的关系,首先能根据 thread_id 的相等条件在新索引上迅速定位数据,然后 id 在相同的 thread_id 上是有序的,这样不管正序还是倒序扫描就都能迅速返回数据。
4、处理方式
4.1、创建复合索引
将thread_id字段的单列索引调整成复合索引
-- 创建复合索引,删除冗余的单列索引
create index idx_t_order_limit_fix on t_order_limit(thread_id,id);
drop index idx_thread_id;
4.2、SQL改写
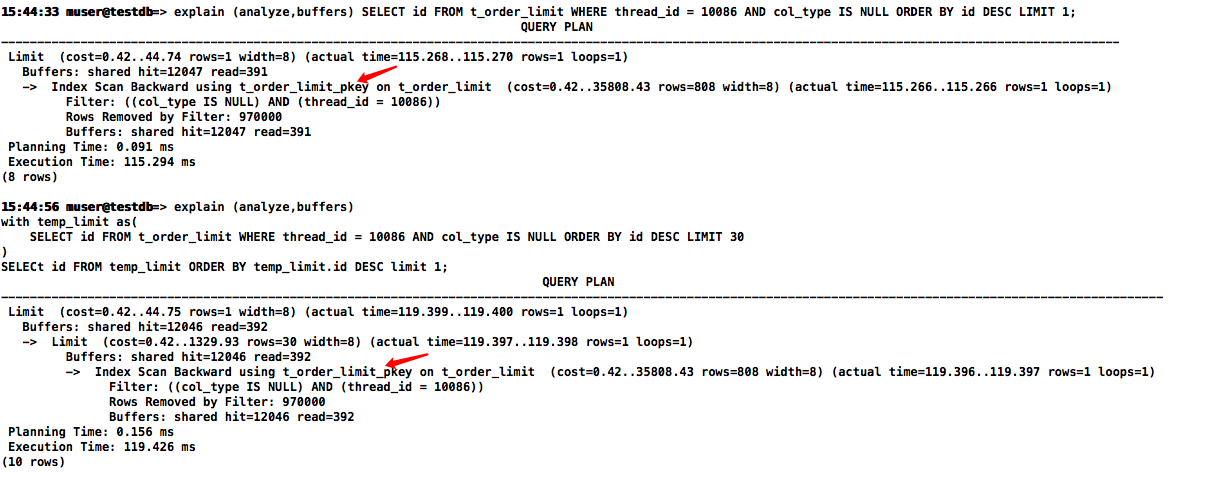
CTE改写,该方式在PostgreSQL14.6没啥效果 . . .
with temp_limit as(
    SELECT id FROM t_order_limit WHERE thread_id = 10086 AND col_type IS NULL ORDER BY id DESC LIMIT 30
)
SELECt id FROM temp_limit ORDER BY temp_limit.id DESC limit 1;
4.3、hint改写
部分数据库支持使用hint方式可以干预执行计划,强制走索引扫描(当然,PG不支持该方式)
5、生产执行计划
改改基本信息,贴下生产的执行计划
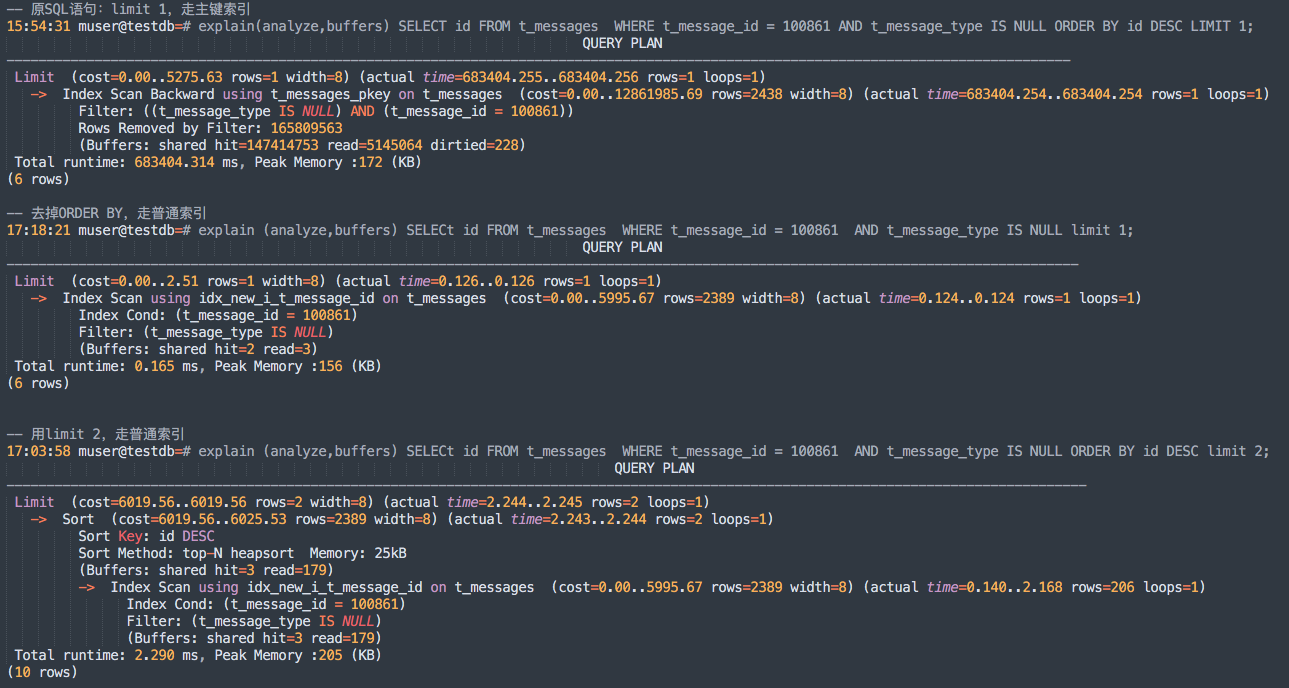
-- 原SQL语句:limit 1,走主键索引
15:54:31 muser@testdb=# explain(analyze,buffers) SELECT id FROM t_messages WHERE t_message_id = 100861 AND t_message_type IS NULL ORDER BY id DESC LIMIT 1;
QUERY PLAN
-------------------------------------------------------------------------------------------------------------------------------------
Limit (cost=0.00..5275.63 rows=1 width=8) (actual time=683404.255..683404.256 rows=1 loops=1)
-> Index Scan Backward using t_messages_pkey on t_messages (cost=0.00..12861985.69 rows=2438 width=8) (actual time=683404.254..683404.254 rows=1 loops=1)
Filter: ((t_message_type IS NULL) AND (t_message_id = 100861))
Rows Removed by Filter: 165809563
(Buffers: shared hit=147414753 read=5145064 dirtied=228)
Total runtime: 683404.314 ms, Peak Memory :172 (KB)
(6 rows)
-- 去掉ORDER BY,走普通索引
17:18:21 muser@testdb=# explain (analyze,buffers) SELECt id FROM t_messages WHERE t_message_id = 100861 AND t_message_type IS NULL limit 1;
QUERY PLAN
--------------------------------------------------------------------------------------------------------------------------------------
Limit (cost=0.00..2.51 rows=1 width=8) (actual time=0.126..0.126 rows=1 loops=1)
-> Index Scan using idx_new_i_t_message_id on t_messages (cost=0.00..5995.67 rows=2389 width=8) (actual time=0.124..0.124 rows=1 loops=1)
Index Cond: (t_message_id = 100861)
Filter: (t_message_type IS NULL)
(Buffers: shared hit=2 read=3)
Total runtime: 0.165 ms, Peak Memory :156 (KB)
(6 rows)
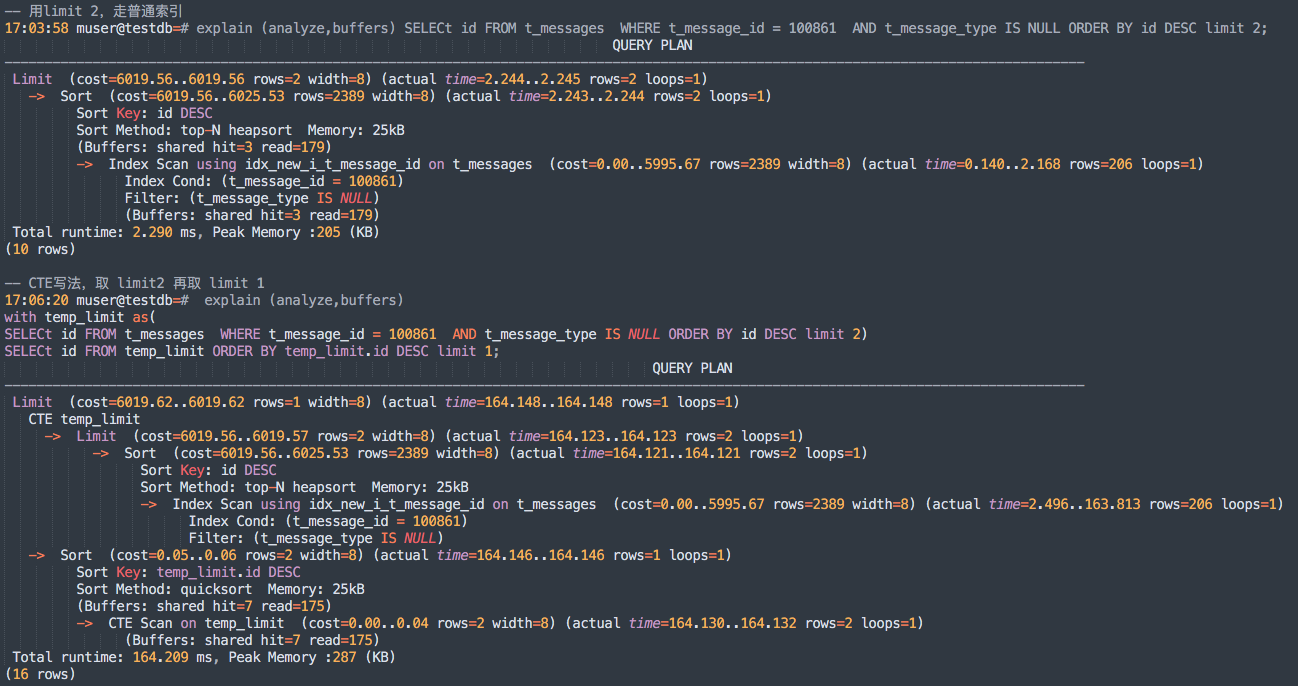
-- 用limit 2,走普通索引
17:03:58 muser@testdb=# explain (analyze,buffers) SELECt id FROM t_messages WHERE t_message_id = 100861 AND t_message_type IS NULL ORDER BY id DESC limit 2;
QUERY PLAN
---------------------------------------------------------------------------------------------------------------------------------------
Limit (cost=6019.56..6019.56 rows=2 width=8) (actual time=2.244..2.245 rows=2 loops=1)
-> Sort (cost=6019.56..6025.53 rows=2389 width=8) (actual time=2.243..2.244 rows=2 loops=1)
Sort Key: id DESC
Sort Method: top-N heapsort Memory: 25kB
(Buffers: shared hit=3 read=179)
-> Index Scan using idx_new_i_t_message_id on t_messages (cost=0.00..5995.67 rows=2389 width=8) (actual time=0.140..2.168 rows=206 loops=1)
Index Cond: (t_message_id = 100861)
Filter: (t_message_type IS NULL)
(Buffers: shared hit=3 read=179)
Total runtime: 2.290 ms, Peak Memory :205 (KB)
(10 rows)
-- CTE写法,取 limit2 再取 limit 1
17:06:20 muser@testdb=# explain (analyze,buffers)
with temp_limit as(
SELECt id FROM t_messages WHERE t_message_id = 100861 AND t_message_type IS NULL ORDER BY id DESC limit 2)
SELECt id FROM temp_limit ORDER BY temp_limit.id DESC limit 1;
QUERY PLAN
---------------------------------------------------------------------------------------------------------------------------------------
Limit (cost=6019.62..6019.62 rows=1 width=8) (actual time=164.148..164.148 rows=1 loops=1)
CTE temp_limit
-> Limit (cost=6019.56..6019.57 rows=2 width=8) (actual time=164.123..164.123 rows=2 loops=1)
-> Sort (cost=6019.56..6025.53 rows=2389 width=8) (actual time=164.121..164.121 rows=2 loops=1)
Sort Key: id DESC
Sort Method: top-N heapsort Memory: 25kB
-> Index Scan using idx_new_i_t_message_id on t_messages (cost=0.00..5995.67 rows=2389 width=8) (actual time=2.496..163.813 rows=206 loops=1)
Index Cond: (t_message_id = 100861)
Filter: (t_message_type IS NULL)
-> Sort (cost=0.05..0.06 rows=2 width=8) (actual time=164.146..164.146 rows=1 loops=1)
Sort Key: temp_limit.id DESC
Sort Method: quicksort Memory: 25kB
(Buffers: shared hit=7 read=175)
-> CTE Scan on temp_limit (cost=0.00..0.04 rows=2 width=8) (actual time=164.130..164.132 rows=2 loops=1)
(Buffers: shared hit=7 read=175)
Total runtime: 164.209 ms, Peak Memory :287 (KB)
(16 rows)