前几天出差的时候,有个网友咨询一个问题,说他们的核心遇到一个比较怪异的问题,已经出现了2次了,对方把相关日志给我了。今天利用周末时间简单分析一下,以供大家参考!
据网友反馈在上午10:07分钟前后系统出现了hang的情况,话不多说,先来看看现象吧,如下是alert log:
Thu Feb 29 09:54:10 2024LNS: Standby redo logfile selected for thread 1 sequence 443904 for destination LOG_ARCHIVE_DEST_4Thu Feb 29 09:54:11 2024LNS: Standby redo logfile selected for thread 1 sequence 443904 for destination LOG_ARCHIVE_DEST_2Thu Feb 29 09:54:11 2024Archived Log entry 3795358 added for thread 1 sequence 443903 ID 0xf960dd75 dest 1:Thu Feb 29 09:55:28 2024Thread 1 cannot allocate new log, sequence 443905Checkpoint not completeCurrent log# 9 seq# 443904 mem# 0: +REDO/xxxx/onlinelog/group_9.266.1062239235Current log# 9 seq# 443904 mem# 1: +FRA/xxxx/onlinelog/group_9.513.1062239249Thu Feb 29 10:02:35 2024minact-scn: useg scan erroring out with error e:12751Thu Feb 29 10:06:51 2024Errors in file u01/app/oracle/diag/diag/rdbms/xxxx/xxxx1/trace/xxxx1_ora_126505.trc:ORA-01013: user requested cancel of current operationThu Feb 29 10:07:34 2024Thread 1 advanced to log sequence 443905 (LGWR switch)Current log# 10 seq# 443905 mem# 0: +REDO/xxxx/onlinelog/group_10.272.1062238997Current log# 10 seq# 443905 mem# 1: +FRA/xxxx/onlinelog/group_10.274.1062239003Thu Feb 29 10:07:34 2024opidcl aborting process unknown ospid (194109) as a result of ORA-1001Thu Feb 29 10:07:34 2024opidcl aborting process unknown ospid (191940) as a result of ORA-1001Thu Feb 29 10:07:34 2024opidcl aborting process unknown ospid (195118) as a result of ORA-1001Thu Feb 29 10:07:34 2024opidcl aborting process unknown ospid (193395) as a result of ORA-1001Thu Feb 29 10:07:34 2024LNS: Standby redo logfile selected for thread 1 sequence 443905 for destination LOG_ARCHIVE_DEST_4Thu Feb 29 10:07:34 2024LNS: Standby redo logfile selected for thread 1 sequence 443905 for destination LOG_ARCHIVE_DEST_2Thu Feb 29 10:07:35 2024opidcl aborting process unknown ospid (193729) as a result of ORA-1001.....opidcl aborting process unknown ospid (193238) as a result of ORA-1001Thu Feb 29 10:07:41 2024opidcl aborting process unknown ospid (214224) as a result of ORA-1001Thu Feb 29 10:07:45 2024Archived Log entry 3795361 added for thread 1 sequence 443904 ID 0xf960dd75 dest 1:Thu Feb 29 10:07:56 2024System State dumped to trace file u01/app/oracle/diag/diag/rdbms/xxxx/xxxx1/trace/xxxx1_diag_48529.trcThu Feb 29 10:08:11 2024Thread 1 advanced to log sequence 443906 (LGWR switch)Current log# 6 seq# 443906 mem# 0: +REDO/xxxx/onlinelog/group_6.271.1062238957Current log# 6 seq# 443906 mem# 1: +FRA/xxxx/onlinelog/group_6.396.1062238963Thu Feb 29 10:08:12 2024LNS: Standby redo logfile selected for thread 1 sequence 443906 for destination LOG_ARCHIVE_DEST_2Thu Feb 29 10:08:19 2024Archived Log entry 3795366 added for thread 1 sequence 443905 ID 0xf960dd75 dest 1:Thu Feb 29 10:08:35 2024Auto-tuning: Starting background process GTXjStarting background process GTXjThu Feb 29 10:08:35 2024GTXj started with pid=95, OS id=250157Thu Feb 29 10:08:37 2024Global Enqueue Services Deadlock detected. More info in fileu01/app/oracle/diag/diag/rdbms/xxxx/xxxx1/trace/xxxx1_lmd0_48542.trc.Thu Feb 29 10:08:42 2024LNS: Standby redo logfile selected for thread 1 sequence 443906 for destination LOG_ARCHIVE_DEST_4Thu Feb 29 10:09:54 2024
看上去9:55到10:07都没有进行日志切换,另外lmd进程也检测到了死锁,同时我们也看到也产生了systemstate dump,这一点还是非常好的,希望以后国产数据库也能提供这个功能(目前我们 #MogDB已经提供了gstrace,在后续版本会有更多的功能增强,敬请期待!关于 MogDB 5.0的一些特性,可以参考官方文档 https://docs.mogdb.io/zh/mogdb/v5.0/characteristic-description-overview).
我们先不着急看trace,先来看看是否有awr或者ash之类的。
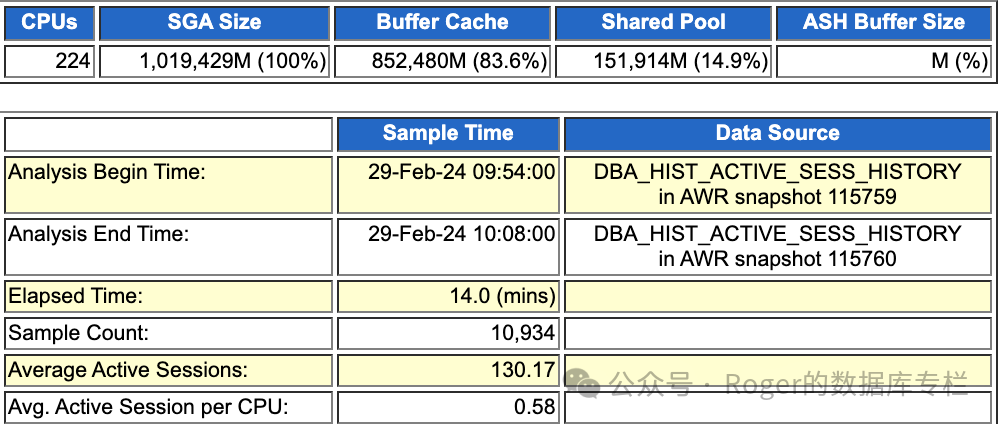
从ASH数据来看,这个库配置是十分的强悍,单节点224 core,物理内存应该在1.5TB左右,毕竟Oracle SGA 都分配了1TB(这是我见过最大的,之前见过SGA设置800GB的,这次刷新我的认知了,格局被拉满了)。
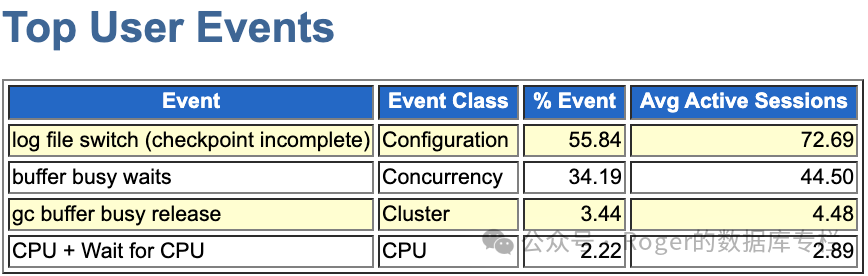
看到ASH event,似乎数据库日志切换相关操作出现了异常,对于buffer busy waits这通常是并发争用过高(比如热块)、IO问题等所导致。进一步来看看top process情况:
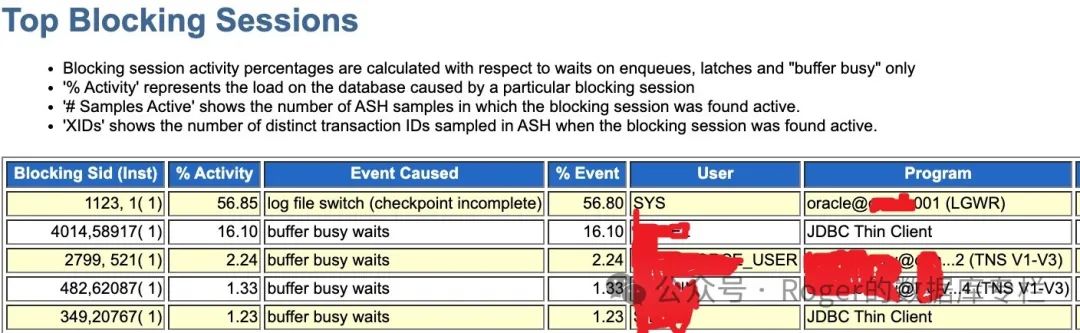
单看ASH的top blocking session,似乎问题都指向了Oracle LGWR进程,如果该进程出问题,那么多自然日志切换是不行的,所有的操作都会被阻塞等待,系统夯死并不奇怪。ASH信息过去简单,但是基本上给我们指明了一个方向,那就是可能lgwr进程出问题了。为了更加清楚的了解这套环境的信息,我继续看看awr报告。
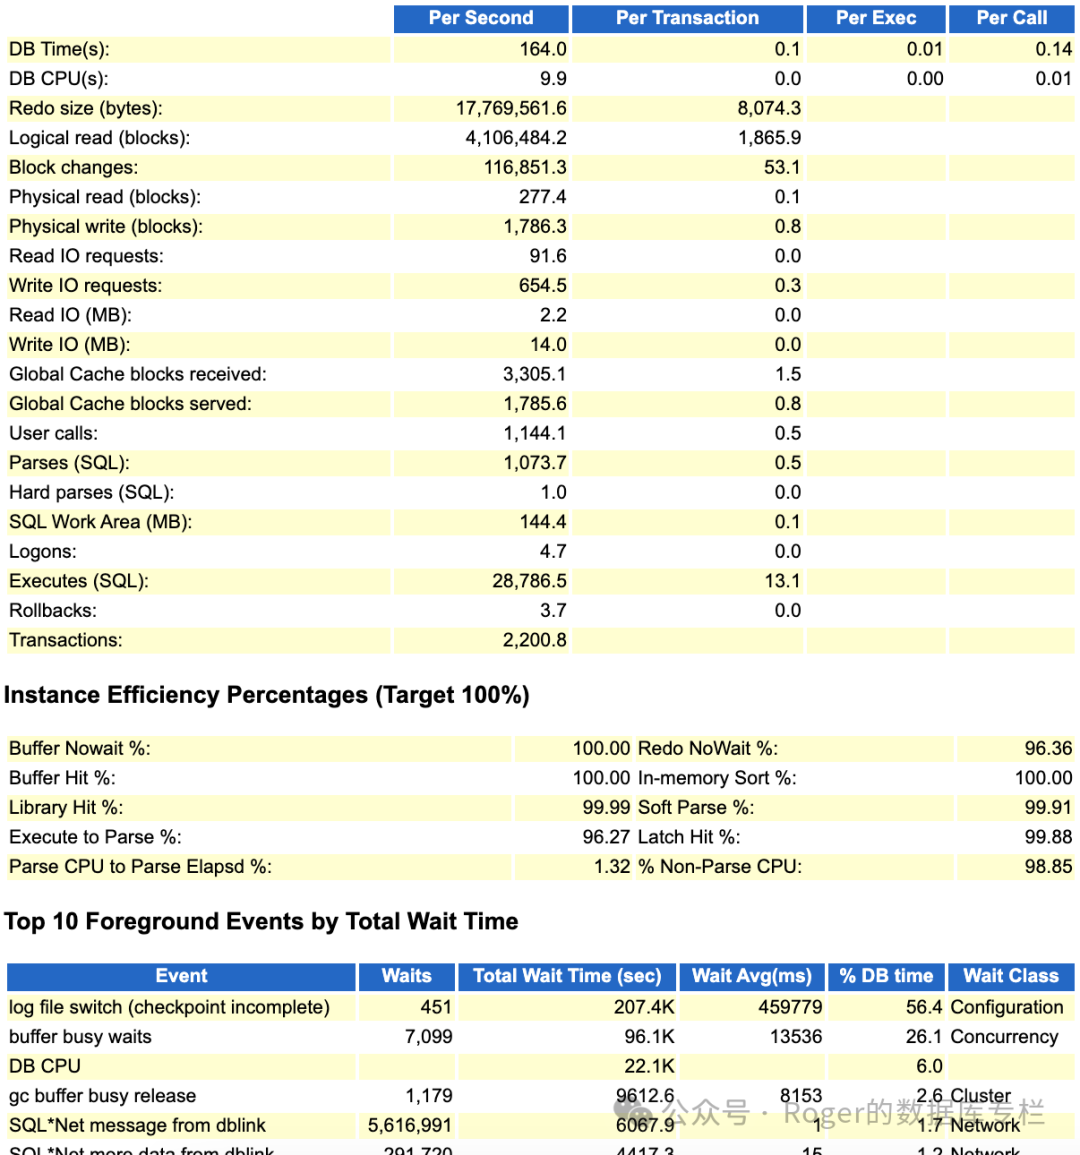
Oracle AWR的 event就不说了,跟ash 如出一辙,从load profile来看,这个系统压力还是很大的,每秒executes(SQL) 2万+。继续来看看Redo相关统计信息和lgwr进程的写情况:
Statistic | Total | per Second | per Trans |
redo synch long waits | 0 | 0.00 | 0.00 |
redo synch poll writes | 60,409 | 26.94 | 0.01 |
redo synch polls | 88,363 | 39.41 | 0.02 |
redo synch time | 22,885 | 10.21 | 0.00 |
redo synch time (usec) | 232,862,072 | 103,864.61 | 47.19 |
redo synch time overhead (usec) | 228,728,940 | 102,021.09 | 46.36 |
redo synch time overhead count (<128 msec) | 327 | 0.15 | 0.00 |
redo synch time overhead count (<2 msec) | 52,177 | 23.27 | 0.01 |
redo synch time overhead count (<32 msec) | 1,288 | 0.57 | 0.00 |
redo synch time overhead count (<8 msec) | 5,790 | 2.58 | 0.00 |
redo synch time overhead count (>=128 msec) | 169 | 0.08 | 0.00 |
redo synch writes | 60,409 | 26.94 | 0.01 |
redo wastage | 3,251,724,852 | 1,450,382.79 | 659.04 |
% of Waits | |||||||||
Event | Total Waits | <1ms | <2ms | <4ms | <8ms | <16ms | <32ms | <=1s | >1s |
latch: redo allocation | 2119 | 96.7 | 2.3 | .8 | .1 | .1 | |||
latch: redo writing | 243.6K | 50.0 | 17.1 | 14.1 | 10.1 | 6.7 | 2.0 | .0 | |
latch: row cache objects | 30.1K | 98.5 | .9 | .4 | .1 | .1 | .0 | ||
latch: shared pool | 442 | 83.3 | 4.1 | 5.4 | 4.5 | 1.8 | .9 | ||
local write wait | 45 | 55.6 | 22.2 | 2.2 | 17.8 | 2.2 | |||
lock deadlock retry | 26 | 100.0 | |||||||
lock escalate retry | 1 | 100.0 | |||||||
log buffer space | 5342 | 16.8 | 13.3 | 19.3 | 19.1 | 13.4 | 7.9 | 10.2 | |
log file parallel write | 916.2K | 84.8 | 10.7 | 3.5 | .8 | .2 | .0 | .0 | |
log file sequential read | 30.3K | 38.2 | 31.9 | 22.3 | 6.2 | .8 | .3 | .2 | |
log file single write | 36 | 100.0 | |||||||
log file switch (checkpoint incomplete) | 457 | .9 | 99.1 |
从上述数据来看,确实很像网友说的lgwr adaptive 这个特性导致的,这里确实有redo poll的操作,另外我们看log file parallel write并没有超过16ms的情况。
看需要分析一下trace,进一步去看看lgwr进程当时的情况了。
分析systemstate dump的时候,刚打开trace,映入眼帘的就是row cache lock死锁,前面部分内容是oracle hanganalyze 分析产生的信息:
*** 2024-02-29 10:06:50.381===============================================================================HANG ANALYSIS:instances (db_name.oracle_sid): crmprod.crmprod1, crmprod.crmprod2oradebug_node_dump_level: 3analysis initiated by oradebugos thread scheduling delay history: (sampling every 1.000000 secs)0.000000 secs at [ 10:06:49 ]NOTE: scheduling delay has not been sampled for 0.704062 secs 0.000000 secs from [ 10:06:45 - 10:06:50 ], 5 sec avg0.000000 secs from [ 10:05:50 - 10:06:50 ], 1 min avg0.000000 secs from [ 10:01:51 - 10:06:50 ], 5 min avgvktm time drift history===============================================================================Chains most likely to have caused the hang:[a] Chain 1 Signature: 'row cache lock'<='row cache lock' (cycle)Chain 1 Signature Hash: 0x75bdd0c[b] Chain 2 Signature: 'row cache lock'<='row cache lock' (cycle)Chain 2 Signature Hash: 0x75bdd0c[c] Chain 3 Signature: 'row cache lock'<='row cache lock' (cycle)Chain 3 Signature Hash: 0x75bdd0c
什么是cycle呢?可以理解为循环、死锁,类似deadlock,从trace来看是一个序列的操作:
===============================================================================Cycles:-------------------------------------------------------------------------------Chain 1:-------------------------------------------------------------------------------Oracle session identified by:{instance: 2 (xxxxx.xxxxx2)os id: 165520process id: 1798, oracle@xxxdb002session id: 209session serial #: 13143}is waiting for 'row cache lock' with wait info:{p1: 'cache id'=0xdp2: 'mode'=0x0p3: 'request'=0x5time in wait: 1.577432 secheur. time in wait: 8 min 8 sectimeout after: 1.422568 secwait id: 46539blocking: 1 sessioncurrent sql: SELECT xxxxxxxxxtab.NEXTVAL FROM DUAL
那么有没有可能是高并发序列产生的row cache lock cycle死锁争用,影响了lgwr进程呢?这里我们先保留这个疑问。
前面继续分析看上去源头是lgwr,那么就继续看看lgwr在干什么?
===============================================================================Non-intersecting chains:-------------------------------------------------------------------------------Chain 4:-------------------------------------------------------------------------------Oracle session identified by:{instance: 1 (xxxxprod.xxxxprod1)os id: 278128process id: 896, oracle@xxxxdb001session id: 5session serial #: 50255}is waiting for 'log file switch (checkpoint incomplete)' with wait info:{time in wait: 2 min 19 sec (last interval)time in wait: 8 min 9 sec (total)timeout after: neverwait id: 1064069blocking: 0 sessionscurrent sql: UPDATE xxx.T_xxx_xxx_APPLYSET APPLIER_ID = :1 ,LAST_UPD = SYSDATE,ACCNT_ID = :2 ,AGREE_NUM = :3 ,RECIPIENT_NAME = :4 ,RECIPIENT_NUM = :5 ,PROVINCEshort stack: ksedsts()+465<-ksdxfstk()+32<-ksdxcb()+1927<-sspuser()+112<-__sighandler()<-semtimedop()+10<-skgpwwait()+178<-ksliwat()+2066<-kslwaitctx()+163<-kcrfws()+508<-kcbchg1_main()+16898<-kcbchg1()+205<-ktuchg2()+1480<-ktbchg2()+281<-kddchg()+799<-kduovw()+4218<-kduurp()+2455<-kdusru()+975<-kauupd()+412<-updrow()+2167<-qerupFetch()+860<-updaul()+1378<-updThreePhaseExe()+318<-updexe()+638<-opiexe()+10378<-kpoal8()+2380<-opiodr()+917<-ttcpip()+2183<-opitsk()+1710<-opiino()+969<-opiodr()+917<-opidrv()+570<-sou2o()+103<-opimawait history:* time between current wait and wait #1: 0.000000 sec1. event: 'latch: redo writing'time waited: 0.001789 secwait id: 1064520 p1: 'address'=0x60023ff0p2: 'number'=0xcfp3: 'tries'=0x0* time between wait #1 and #2: 0.000000 sec2. event: 'log file switch (checkpoint incomplete)'time waited: 0.824966 sec (last interval)time waited: 5 min 49 sec (total)wait id: 1064069* time between wait #2 and #3: 0.000000 sec3. event: 'latch: redo writing'time waited: 0.000005 secwait id: 1064519 p1: 'address'=0x60023ff0p2: 'number'=0xcfp3: 'tries'=0x0}and is blocked by=> Oracle session identified by:{instance: 1 (xxxxrod.xxxxrod1)os id: 48602process id: 33, oracle@xxxxdb001 (LGWR)session id: 1123session serial #: 1}which is waiting for 'rdbms ipc message' with wait info:{p1: 'timeout'=0xc3time in wait: 28486208 min 10 sectimeout after: 0.000000 secwait id: 393202531blocking: 1178 sessionscurrent sql: <none>short stack: ksedsts()+465<-ksdxfstk()+32<-ksdxcb()+1927<-sspuser()+112<-__sighandler()<-pread64()+19<-ksfd_skgfqio()+191<-ksfd_io()+767<-ksfdread()+581<-kfk_ufs_sync_io()+411<-kfk_submit_ufs_io()+247<-kfk_submit_io()+90<-kfk_io1()+1089<-kfkRequest()+14<-kfk_transitIO()+1712<-kfioSubmitIO()+4777<-kfioRequestPriv()+182<-kfioRequest()+691<-ksfd_kfioRequest()+649<-ksfd_osmio()+1053<-ksfd_io()+2782<-ksfdread()+581<-kccrbp()+488<-kccrec_rbl()+507<-kccext_ugg()+287<-kccrec_read_write()+212<-kccugg()+493<-kcc_get_record()+43<-kccgli(wait history:* time between current wait and wait #1: 0.000011 sec1. event: 'KSV master wait'time waited: 0.000057 secwait id: 393202530* time between wait #1 and #2: 0.000068 sec2. event: 'control file sequential read'time waited: 0.000145 secwait id: 393202529 p1: 'file#'=0x0p2: 'block#'=0x2dp3: 'blocks'=0x1* time between wait #2 and #3: 0.000005 sec3. event: 'control file sequential read'time waited: 0.000165 secwait id: 393202528 p1: 'file#'=0x0p2: 'block#'=0x330p3: 'blocks'=0x1}Chain 4 Signature: 'rdbms ipc message'<='log file switch (checkpoint incomplete)'Chain 4 Signature Hash: 0xfb14fb68
看上去很多update在等lgwr,而且可以看到lgwr 阻塞了1178个Session。但是此时lgwr 进程的等待事件居然是rdbms ipc messages。这是一个空闲等待事件.这似乎有点诡异。同时我看hanganalyze 3的结果,
*** 2024-02-29 10:06:50.700===============================================================================HANG ANALYSIS DUMPS:oradebug_node_dump_level: 3===============================================================================State of LOCAL nodes([nodenum]/cnode/sid/sess_srno/session/ospid/state/[adjlist]):[4]/1/5/50255/0x12d22aea120/278128/NLEAF/[1122][7]/1/8/64645/0x12e82b8e8c8/126496/NLEAF/[1122][40]/1/41/30141/0x12e82b9dd28/222217/NLEAF/[7378]......[1057]/1/1058/20481/0x12d62c8e228/192189/NLEAF/[1122][1062]/1/1063/50875/0x12d22cb4460/223750/NLEAF/[1122][1088]/1/1089/1/0x12d22cc69a0/48600/SINGLE_NODE_NW/[1091]/1/1092/51785/0x12e82d6b148/195897/NLEAF/[1122][1092]/1/1093/31217/0x12d82c6a400/192238/NLEAF/[1122][1122]/1/1123/1/0x12d42c8ef90/48602/LEAF/[1124]/1/1125/41567/0x12e82d7a5a8/195899/NLEAF/[1122]......[7518]/1/7519/21069/0x12d8375e740/195527/NLEAF/[1122][7520]/1/7521/36085/0x12d03773710/314154/NLEAF/[1122][7524]/1/7525/61423/0x12e8385c3a8/191947/NLEAF/[1122][7589]/1/7590/46795/0x12d637ad1a8/195530/NLEAF/[1122][7590]/1/7591/18861/0x12e8387ac68/222252/NLEAF/[2798]
其中1/1123 就是lgwr进程,没有nleaf节点,说明从阻塞链条来看确实可能是源头。由于systemstate dump 比较大,这里我们要看某个进程的具体信息的话,那么直接UE 搜索:PROCESS 33即可。
PROCESS 33: LGWR----------------------------------------SO: 0x12d427afb70, type: 2, owner: (nil), flag: INIT/-/-/0x00 if: 0x3 c: 0x3proc=0x12d427afb70, name=process, file=ksu.h LINE:12721, pg=0(process) Oracle pid:33, ser:1, calls cur/top: 0x12d83785f48/0x12d83785f48flags : (0x6) SYSTEMflags2: (0x0), flags3: (0x10)intr error: 0, call error: 0, sess error: 0, txn error 0intr queue: emptyksudlp FALSE at location: 0(post info) last post received: 0 0 26last post received-location: ksa2.h LINE:285 ID:ksasndlast process to post me: 0x12d427e5018 239 0last post sent: 0 0 126last post sent-location: kjc.h LINE:1943 ID:KJCS Post snd proxy to flush msglast process posted by me: 0x12d0279f728 1 6(latch info) wait_event=0 bits=0x0Process Group: DEFAULT, pseudo proc: 0x12d02a887b0O/S info: user: oracle, term: UNKNOWN, ospid: 48602OSD pid info: Unix process pid: 48602, image: oracle@crmdb001 (LGWR)Short stack dump:ksedsts()+465<-ksdxfstk()+32<-ksdxcb()+1927<-sspuser()+112<-__sighandler()<-io_queue_run()+100<-skgfospo()+185<-skgfrwat()+399<-ksfdwtio()+756<-ksfdwat_internal()+649<-ksfdblock()+207<-kfk_block_ufs()+334<-kfk_block()+871<-kfk_transit_waitIO()+188<-kfk_transitIO()+1755<-kfioWaitIO()+721<-kfioRequestPriv()+351<-kfioRequest()+691<-ksfd_kfioRequest()+649<-ksfd_osmbio()+413<-ksfdbio()+1563<-kcrfw_do_write()+974<-kcrfw_redo_write()+2072<-ksbabs()+771<-ksbrdp()+1045<-opirip()+623<-opidrv()+603<-sou2o()+103<-opimai_real()+250<-ssthrdmain()+265<-main()+201<-__libc_start_main()+253----------------------------------------SO: 0x12d83973a48, type: 14, owner: 0x12d427afb70, flag: INIT/-/-/0x00 if: 0x1 c: 0x1proc=0x12d427afb70, name=channel handle, file=ksr2.h LINE:367, pg=0(broadcast handle) 0x12d83973a48 flag: (1) PUBLISHER,owner: 0x12d427afb70 - ospid: 48602event: 2, last message event: 0,last message waited event: 0,next message: (nil)(0), messages published: 0channel: (0x12d638df958) LGWR to NSA2 channel [name: 39]scope: 0, event: 9, last mesage event: 9,publishers/subscribers: 1/1,messages published: 4heuristic msg queue length: 0......SO: 0x12d8395dc38, type: 14, owner: 0x12d427afb70, flag: INIT/-/-/0x00 if: 0x1 c: 0x1proc=0x12d427afb70, name=channel handle, file=ksr2.h LINE:367, pg=0(broadcast handle) 0x12d8395dc38 flag: (2) ACTIVE SUBSCRIBER,owner: 0x12d427afb70 - ospid: 48602event: 16, last message event: 16,last message waited event: 16,next message: (nil)(0), messages read: 0channel: (0x12d638ea218) scumnt mount lock [name: 159]scope: 1, event: 4596, last mesage event: 0,publishers/subscribers: 0/58,messages published: 0heuristic msg queue length: 0----------------------------------------SO: 0x12d42c8ef90, type: 4, owner: 0x12d427afb70, flag: INIT/-/-/0x00 if: 0x3 c: 0x3proc=0x12d427afb70, name=session, file=ksu.h LINE:12729, pg=0(session) sid: 1123 ser: 1 trans: (nil), creator: 0x12d427afb70flags: (0x51) USR/- flags_idl: (0x1) BSY/-/-/-/-/-flags2: (0x409) -/-/INCDID: , short-term DID:txn branch: (nil)edition#: 0 oct: 0, prv: 0, sql: (nil), psql: (nil), user: 0/SYSksuxds FALSE at location: 0service name: SYS$BACKGROUNDCurrent Wait Stack:0: waiting for 'log file parallel write'files=0x2, blocks=0x40, requests=0xcwait_id=393564999 seq_num=36277 snap_id=1wait times: snap=28486210 min 16 sec, exc=28486210 min 16 sec, total=28486210 min 16 secwait times: max=infinite, heur=28486210 min 16 secwait counts: calls=0 os=0in_wait=1 iflags=0x5a0Wait State:fixed_waits=0 flags=0x22 boundary=(nil)/-1Session Wait History:elapsed time of 0.000235 sec since current wait0: waited for 'log file parallel write'files=0x2, blocks=0x3e, requests=0xcwait_id=393564998 seq_num=36276 snap_id=1wait times: snap=0.000712 sec, exc=0.000712 sec, total=0.000712 secwait times: max=infinitewait counts: calls=0 os=0occurred after 0.000185 sec of elapsed time......9: waited for 'log file parallel write'files=0x2, blocks=0x40, requests=0xcwait_id=393564999 seq_num=36277 snap_id=1wait times: snap=0.001645 sec, exc=0.001645 sec, total=0.001645 secwait times: max=infinitewait counts: calls=0 os=0occurred after 0.000235 sec of elapsed timeSampled Session History of session 1123 serial 1---------------------------------------------------The sampled session history is constructed by samplingthe target session every 1 second. The sampling processcaptures at each sample if the session is in a non-idle wait,an idle wait, or not in a wait. If the session is in anon-idle wait then one interval is shown for all the samplesthe session was in the same non-idle wait. If thesession is in an idle wait or not in a wait forconsecutive samples then one interval is shown for allthe consecutive samples. Though we display these consecutivesamples in a single interval the session may NOT be continuouslyidle or not in a wait (the sampling process does not know).The history is displayed in reverse chronological order.sample interval: 1 sec, max history 120 sec---------------------------------------------------[1 sample, 10:07:57]waited for 'log file parallel write', seq_num: 35813p1: 'files'=0x2p2: 'blocks'=0x9cp3: 'requests'=0xctime_waited: >= 0 sec (still in wait)。。。。。。waited for 'log file parallel write', seq_num: 29854p1: 'files'=0x2p2: 'blocks'=0x28ep3: 'requests'=0x20time_waited: 0.007661 sec (sample interval: 0 sec)[152 samples, 10:05:05 - 10:07:35]idle wait at each sample---------------------------------------------------Sampled Session History Summary:longest_non_idle_wait: 'log file parallel write'[1 sample, 10:07:40 ]time_waited: 0.026762 sec (sample interval: 0 sec)
我们不难看出lgwr进程在的等待lgwr file parallel write,之前我们看其等待事件柱状图可以发现,有少量等待是在8ms-16ms之间的,对于高端存储环境来讲,这是比较高的响应时间了(916.2k次等待,其中8-16ms等待次数是1%,大概就是9162次).
那么问题究竟是什么呢,是不是lgwr 这个自适应写redo机制导致的呢?为了进一步确认,我们把lgwr 的call stack列出来:
ksedsts()+465<-ksdxfstk()+32<-ksdxcb()+1927<-sspuser()+112
<-__sighandler()<-io_queue_run()+100
<-skgfospo()+185<-skgfrwat()+399<-ksfdwtio()+756
<-ksfdwat_internal()+649<-ksfdblock()+207<-kfk_block_ufs()+334
<-kfk_block()+871<-kfk_transit_waitIO()+188<-kfk_transitIO()+1755
<-kfioWaitIO()+721<-kfioRequestPriv()+351
<-kfioRequest()+691<-ksfd_kfioRequest()+649<-ksfd_osmbio()+413
<-ksfdbio()+1563<-kcrfw_do_write()+974
<-kcrfw_redo_write()+2072<-ksbabs()+771
<-ksbrdp()+1045<-opirip()+623<-opidrv()+603
<-sou2o()+103<-opimai_real()+250<-ssthrdmain()+265
<-main()+201<-__libc_start_main()+253
针对上述几个关键的函数,我们来看看大概是什么含义:
skgfospo: operating system dependent kernel generic file operating system poll for IO completion
skgfrwat: operating system dependent kernel generic file requests wait for IO to complete
ksfdwtio: kernel service (VOS) functions disk IO wait for IO
从call stack函数来看,lgwr进程确实在进行poll切换操作啊。。。看来就是这个特殊导致的了,实锤了!后面网友将参数 _use_adaptive_log_file_sync进行了调整,这个做法我认为是正确!
写在最后如果对数据恢复感兴趣的小伙伴,可以订阅如下课程,当然该课程并不仅仅是分享数据库异常恢复思路,更多的是讲解数据文件结构、块结构,redo、undo等相关原理,非常有助于大家加深理解,对于转战国产数据库,我认为也有一定借鉴意义。订阅的小伙伴,记得加我微信(最好是备注一下 已订阅xxx),我拉大家进小群,偶尔解答以及开开小灶,分享技术知识,不限于Oracle、Oceanbase、达梦数据库、openGauss等。