


Table of Contents
- 参考
- 目标
- 实验机器配置
- 实验
- 配置python
- 安装必备前置软件
- 配置安装路径以及下载安装包
- 配置xml文件用于后续软件安装
- 将performance.sh中参数vm.min_free_kbytes注释
- 设置字符集以及openGauss的lib的位置配置到环境变量中
- 解压安装包openGauss-2.0.0-openEuler-64bit并给文件夹权限
- 采用交互模式执行,并在执行过程中会创建root用户互信和openGauss用户互信(密码: Admin@123)
- 开始安装openGauss(密码: Admin@123)
- 检查DB状态
- 检查配置中的port
- 测试DB基本操作
- 基本启动/停止/状态操作
- gsql基本操作
- gs_checkos
- gs_checkperf
参考
目标
本实验在安装了openEuler ARM操作系统的华为云主机上安装openGauss数据库,
通过安装过程中的参数配置、命令行安装、工具使用等等方式,
加深对openGauss数据库关联文件作用的理解,熟悉openGauss数据库安装相关的操作。
实验机器配置
计费模式:按需计费(一定要选按需计费,注意配置费用)
区域:华北-北京四(推荐,其他区域可能会导致无法选择openEuler公共镜像)
CPU架构 鲲鹏通用计算增强型规格:最新系列 2vCPUs|4GB
镜像:公共镜像:openEuleropenEuler 20.03 64bit with ARM(40GB)
系统盘:通用型SSD 40G
实验
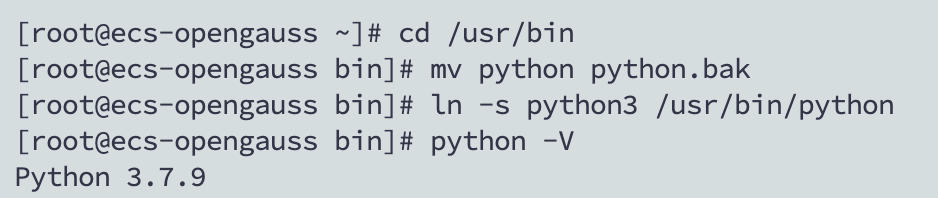
配置python
cd /usr/bin
mv python python.bak
ln -s python3 /usr/bin/python
python -V
安装必备前置软件
yum install -y libaio*
配置安装路径以及下载安装包
mkdir -p /opt/software/openGauss
chmod 755 -R /opt/software

cd /opt/software/openGauss
wget https://openGauss.obs.cn-south-1.myhuaweicloud.com/2.0.0/arm/openGauss-2.0.0-openEuler-64bit-all.tar.gz
配置xml文件用于后续软件安装
cd /opt/software/openGauss

cat >clusterconfig.xml<<EOF
<?xml version="1.0" encoding="UTF-8"?>
<ROOT>
   <CLUSTER>
       <PARAM name="clusterName" value="dbCluster" />
       <PARAM name="nodeNames" value="ecs-opengauss" />
       <PARAM name="backIp1s" value="192.168.0.193"/>
       <PARAM name="gaussdbAppPath" value="/opt/gaussdb/app" />
       <PARAM name="gaussdbLogPath" value="/var/log/gaussdb" />
       <PARAM name="gaussdbToolPath" value="/opt/huawei/wisequery" />
       <PARAM name="corePath" value="/opt/opengauss/corefile"/>
       <PARAM name="clusterType" value="single-inst"/>
   </CLUSTER>

   <DEVICELIST>

       <DEVICE sn="1000001">
           <PARAM name="name" value="ecs-opengauss"/>
           <PARAM name="azName" value="AZ1"/>
           <PARAM name="azPriority" value="1"/>
           <PARAM name="backIp1" value="192.168.0.193"/>
           <PARAM name="sshIp1" value="192.168.0.193"/>

        <!--dbnode-->
        <PARAM name="dataNum" value="1"/>
        <PARAM name="dataPortBase" value="26000"/>
        <PARAM name="dataNode1" value="/gaussdb/data/db1"/>
       </DEVICE>
   </DEVICELIST>
</ROOT>
EOF
注意: 将IP替换成实际的私有IP,其他保持不变
将performance.sh中参数vm.min_free_kbytes注释
vi /etc/profile.d/performance.sh
#sysctl -w vm.min_free_kbytes=112640 &> /dev/null
设置字符集以及openGauss的lib的位置配置到环境变量中
cat >>/etc/profile<<EOF
export LANG=en_US.UTF-8
export packagePath=/opt/software/openGauss
export LD_LIBRARY_PATH=$packagePath/script/gspylib/clib:$LD_LIBRARY_PATH
EOF

source /etc/profile
解压安装包openGauss-2.0.0-openEuler-64bit并给文件夹权限
cd /opt/software/openGauss
tar -zxvf openGauss-2.0.0-openEuler-64bit-all.tar.gz
tar -zxvf openGauss-2.0.0-openEuler-64bit-om.tar.gz

chmod -R 755 /opt/software/openGauss/script/
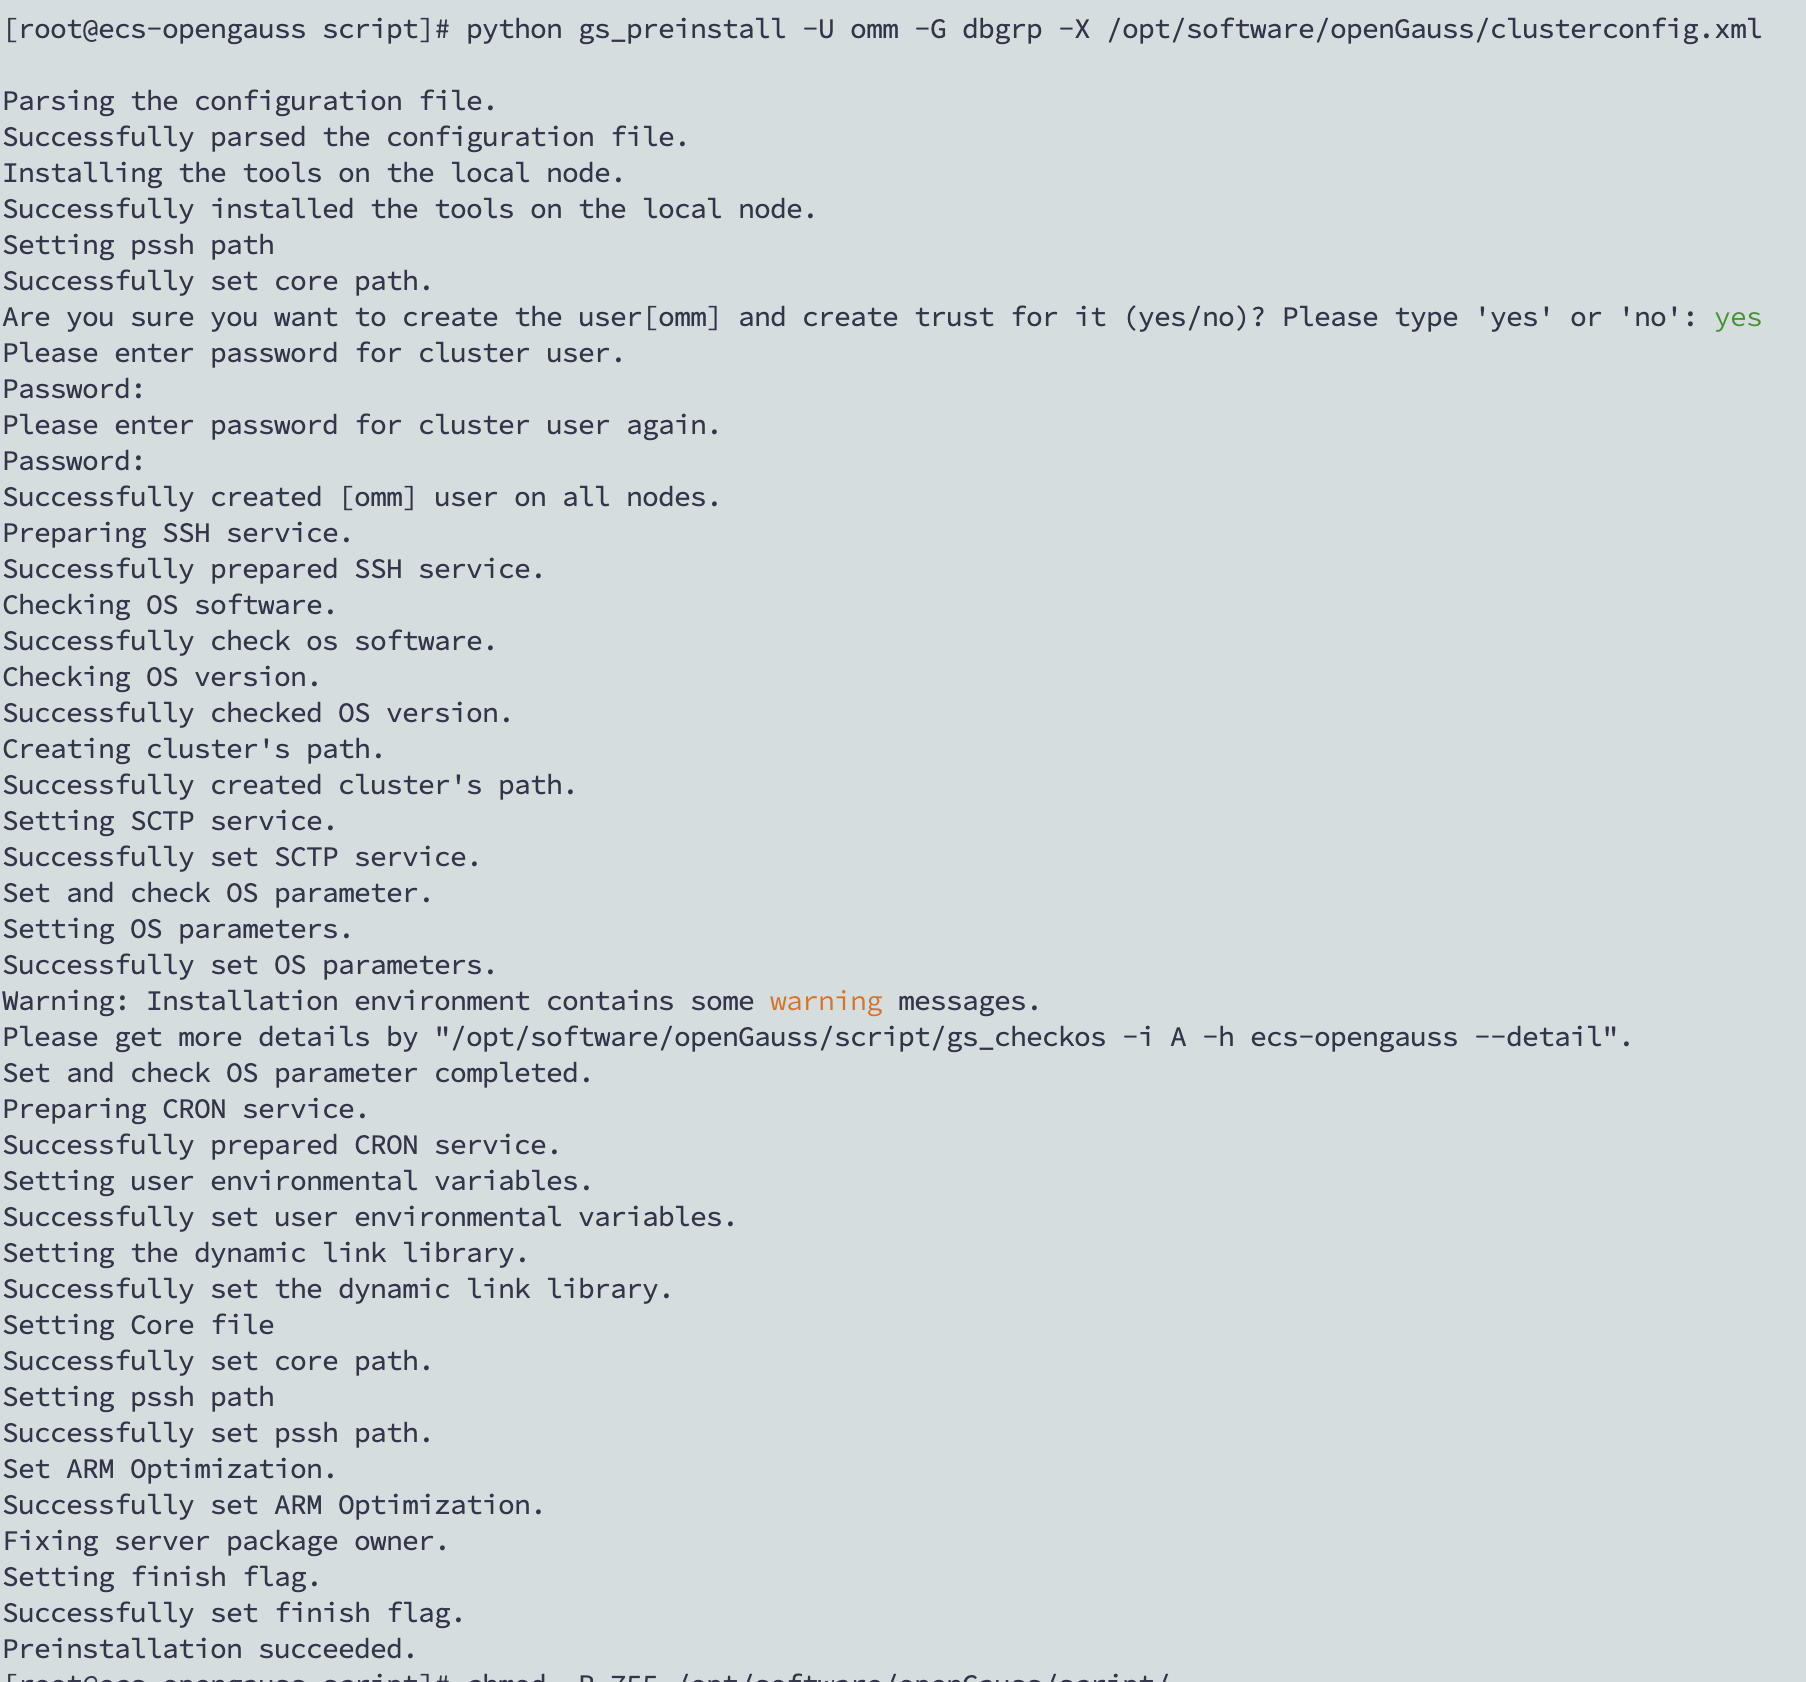
采用交互模式执行,并在执行过程中会创建root用户互信和openGauss用户互信(密码: Admin@123)
cd /opt/software/openGauss/script/
python gs_preinstall -U omm -G dbgrp -X /opt/software/openGauss/clusterconfig.xml
开始安装openGauss(密码: Admin@123)
su - omm
gs_install -X /opt/software/openGauss/clusterconfig.xml --gsinit-parameter="--encoding=UTF8"  --dn-guc="max_process_memory=4GB"  --dn-guc="shared_buffers=256MB" --dn-guc="bulk_write_ring_size=256MB" --dn-guc="cstore_buffers=16MB"
检查DB状态
gs_om -t status --detail
检查配置中的port
cat /gaussdb/data/db1/postgresql.conf | grep port
测试DB基本操作
[omm@ecs-opengauss ~]$ gsql -d postgres -p 26000 -r
gsql ((openGauss 2.0.0 build 78689da9) compiled at 2021-03-31 21:03:52 commit 0 last mr  )
Non-SSL connection (SSL connection is recommended when requiring high-security)
Type "help" for help.

postgres=# CREATE USER usr_XXX WITH PASSWORD "XXXXXX@123";
postgres=# CREATE DATABASE db_XXX OWNER usr_XXX;
postgres=# \q


gsql -d db_XXX -p 26000 -U usr_XXX -W XXXXXX@123  -r

[omm@ecs-opengauss ~]$ gsql -d db_XXX -p 26000 -U usr_XXX -W XXXXXX@123  -r
gsql ((openGauss 2.0.0 build 78689da9) compiled at 2021-03-31 21:03:52 commit 0 last mr  )
Non-SSL connection (SSL connection is recommended when requiring high-security)
Type "help" for help.

db_XXX=> CREATE SCHEMA sch_XXXX AUTHORIZATION usr_XXX;
CREATE SCHEMA
db_XXX=> CREATE TABLE mytable (id int);
db_XXX=> INSERT INTO mytable values (100);
db_XXX=> \q
[omm@ecs-opengauss ~]$
基本启动/停止/状态操作
gs_om -t start

gs_om -t status

gs_om -t stop
gsql基本操作
gsql --help

postgres=# help
You are using gsql, the command-line interface to gaussdb.
Type:  \copyright for distribution terms
      \h for help with SQL commands
      \? for help with gsql commands
      \g or terminate with semicolon to execute query
      \q to quit
postgres=# \copyright
GaussDB Kernel Database Management System
Copyright (c) Huawei Technologies Co., Ltd. 2018. All rights reserved.
postgres=# \h
postgres=# \?
postgres=# \q
gs_checkos
gs_checkos -i A
[root@ecs-opengauss script]# /root/gauss_om/omm/script/gs_checkos -i A
Checking items:
   A1. [ OS version status ]                                   : Normal
   A2. [ Kernel version status ]                               : Normal
   A3. [ Unicode status ]                                      : Normal
   A4. [ Time zone status ]                                    : Normal
   A5. [ Swap memory status ]                                  : Normal
   A6. [ System control parameters status ]                    : Warning
   A7. [ File system configuration status ]                    : Warning
   A8. [ Disk configuration status ]                           : Normal
   A9. [ Pre-read block size status ]                          : Normal
   A10.[ IO scheduler status ]                                 : Normal
BondMode Null
   A11.[ Network card configuration status ]                   : Warning
   A12.[ Time consistency status ]                             : Warning
   A13.[ Firewall service status ]                             : Normal
   A14.[ THP service status ]                                  : Normal
Total numbers:14. Abnormal numbers:0. Warning numbers:4.
[root@ecs-opengauss script]#
gs_checkperf
[omm@ecs-opengauss ~]$ gs_checkperf
Cluster statistics information:
   Host CPU busy time ratio                     :    15.22      %
   MPPDB CPU time % in busy time                :    7.56       %
   Shared Buffer Hit ratio                      :    95.60      %
   In-memory sort ratio                         :    0
   Physical Reads                               :    366
   Physical Writes                              :    84
   DB size                                      :    42         MB
   Total Physical writes                        :    84
   Active SQL count                             :    4
   Session count                                :    6
[omm@ecs-opengauss ~]$

[omm@ecs-opengauss ~]$ gs_checkperf --detail
Cluster statistics information:
Host CPU usage rate:
   Host total CPU time                          :    3889660.000 Jiffies
   Host CPU busy time                           :    621030.000 Jiffies
   Host CPU iowait time                         :    23690.000  Jiffies
   Host CPU busy time ratio                     :    15.97      %
   Host CPU iowait time ratio                   :    .61        %
MPPDB CPU usage rate:
   MPPDB CPU time % in busy time                :    16.61      %
   MPPDB CPU time % in total time               :    2.65       %
Shared buffer hit rate:
   Shared Buffer Reads                          :    816
   Shared Buffer Hits                           :    44870
   Shared Buffer Hit ratio                      :    98.21      %
In memory sort rate:
   In-memory sort count                         :    0
   In-disk sort count                           :    0
   In-memory sort ratio                         :    0
I/O usage:
   Number of files                              :    94
   Physical Reads                               :    425
   Physical Writes                              :    213
   Read Time                                    :    108601     ms
   Write Time                                   :    1920       ms
Disk usage:
   DB size                                      :    42         MB
   Total Physical writes                        :    213
   Average Physical write                       :    110937.50
   Maximum Physical write                       :    213
Activity statistics:
   Active SQL count                             :    4
   Session count                                :    6
Node statistics information:
dn_6001:
   MPPDB CPU Time                               :    103170     Jiffies
   Host CPU Busy Time                           :    621030     Jiffies
   Host CPU Total Time                          :    3889660    Jiffies
   MPPDB CPU Time % in Busy Time                :    16.61      %
   MPPDB CPU Time % in Total Time               :    2.65       %
   Physical memory                              :    3121086464 Bytes
   DB Memory usage                              :    3675848704 Bytes
   Shared buffer size                           :    268435456  Bytes
   Shared buffer hit ratio                      :    98.21      %
   Sorts in memory                              :    0
   Sorts in disk                                :    0
   In-memory sort ratio                         :    0
   Number of files                              :    94
   Physical Reads                               :    425
   Physical Writes                              :    213
   Read Time                                    :    108601
   Write Time                                   :    1920
Session statistics information(Top 10):
Session CPU statistics:
1 dn_6001-postgres-omm:
   Session CPU time                             :    2
   Database CPU time                            :    103360
   Session CPU time %                           :    0.00       %
2 dn_6001-postgres-omm:
   Session CPU time                             :    0
   Database CPU time                            :    103360
   Session CPU time %                           :    0.00       %
3 dn_6001-postgres-omm:
   Session CPU time                             :    0
   Database CPU time                            :    103360
   Session CPU time %                           :    0.00       %
4 dn_6001-postgres-omm:
   Session CPU time                             :    0
   Database CPU time                            :    103360
   Session CPU time %                           :    0.00       %

Session Memory statistics:
1 dn_6001-postgres-omm:
   Buffer Reads                                 :    1009
   Shared Buffer Hit ratio                      :    100.00
   In Memory sorts                              :    1
   In Disk sorts                                :    0
   In Memory sorts ratio                        :    100.00
   Total Memory Size                            :    8879168
   Used Memory Size                             :    6797760
2 dn_6001-postgres-omm:
   Buffer Reads                                 :    283
   Shared Buffer Hit ratio                      :    100.00
   In Memory sorts                              :    0
   In Disk sorts                                :    0
   In Memory sorts ratio                        :    0
   Total Memory Size                            :    5890184
   Used Memory Size                             :    4521944
3 dn_6001-postgres-omm:
   Buffer Reads                                 :    283
   Shared Buffer Hit ratio                      :    100.00
   In Memory sorts                              :    0
   In Disk sorts                                :    0
   In Memory sorts ratio                        :    0
   Total Memory Size                            :    5881992
   Used Memory Size                             :    4521184
4 dn_6001-postgres-omm:
   Buffer Reads                                 :    282
   Shared Buffer Hit ratio                      :    99.65
   In Memory sorts                              :    0
   In Disk sorts                                :    0
   In Memory sorts ratio                        :    0
   Total Memory Size                            :    5857416
   Used Memory Size                             :    4511992

Session IO statistics:
1 dn_6001-postgres-omm:
   Physical Reads                               :    1
   Read Time                                    :    6
2 dn_6001-postgres-omm:
   Physical Reads                               :    0
   Read Time                                    :    0
3 dn_6001-postgres-omm:
   Physical Reads                               :    0
   Read Time                                    :    0
4 dn_6001-postgres-omm:
   Physical Reads                               :    0
   Read Time                                    :    0
[omm@ecs-opengauss ~]$最后修改时间:2024-03-15 15:14:35
「喜欢这篇文章,您的关注和赞赏是给作者最好的鼓励」
关注作者
【版权声明】本文为墨天轮用户原创内容,转载时必须标注文章的来源(墨天轮),文章链接,文章作者等基本信息,否则作者和墨天轮有权追究责任。如果您发现墨天轮中有涉嫌抄袭或者侵权的内容,欢迎发送邮件至:contact@modb.pro进行举报,并提供相关证据,一经查实,墨天轮将立刻删除相关内容。
