


下载解压sql_exporter
cd /opt
wget https://github.com/free/sql_exporter/releases/download/0.5/sql_exporter-0.5.linux-amd64.tar.gz
tar -zxf sql_exporter-0.5.linux-amd64.tar.gz
ln -s sql_exporter-0.5.linux-amd64 sql_exporter_107
cd sql_exporter_205
修改配置文件
# Global defaults.
global:
  # Subtracted from Prometheus' scrape_timeout to give us some headroom and prevent Prometheus from timing out first.
  scrape_timeout_offset: 500ms
  # Minimum interval between collector runs: by default (0s) collectors are executed on every scrape.
  min_interval: 0s
  # Maximum number of open connections to any one target. Metric queries will run concurrently on multiple connections,
  # as will concurrent scrapes.
  max_connections: 3
  # Maximum number of idle connections to any one target. Unless you use very long collection intervals, this should
  # always be the same as max_connections.
  max_idle_connections: 3

# The target to monitor and the collectors to execute on it.
target:
  # Data source name always has a URI schema that matches the driver name. In some cases (e.g. MySQL)
  # the schema gets dropped or replaced to match the driver expected DSN format.
  data_source_name: 'sqlserver://账号:密码@IP地址:端口'

  # Collectors (referenced by name) to execute on the target.
  collectors: [mssql_standard]

# Collector files specifies a list of globs. One collector definition is read from each matching file.
collector_files:
  - "*.collector.yml"
封装sql_exporter的系统服务
[root@prometheusserver sql_exporter_205]# cat /etc/systemd/system/sql_exporter_205.service
[Unit]
Description=sql_exporter_205

[Service]
Type=simple
ExecStart=/opt/sql_exporter_205/sql_exporter_205 -config.file /opt/sql_exporter_205/sql_exporter_205.yml -web.listen-address 0.0.0.0:9397
Restart=on-failure

[Install]
WantedBy=multi-user.target
启动、查看
systemctl daemon-reload
systemctl start sql_exporter_107
systemctl enable sql_exporter_107
[root@localhost opt]# systemctl status sql_exporter_107
[root@localhost opt]# systemctl status sql_exporter_107
● sql_exporter_107.service - sql_exporter_107
   Loaded: loaded (/etc/systemd/system/sql_exporter_107.service; enabled; vendor preset: disabled)
   Active: active (running) since 四 2024-01-04 18:39:46 CST; 3 months 4 days ago
 Main PID: 878 (sql_exporter_10)
    Tasks: 14
   Memory: 38.4M
   CGroup: /system.slice/sql_exporter_107.service
           └─878 /opt/sql_exporter_107/sql_exporter_107 -config.file /opt/sql_exporter_107/sql_exporter_107.yml -web.listen-address 0.0.0.0:9398

4月 09 11:24:13 localhost.localdomain sql_exporter_107[878]: I0409 11:24:13.536273     878 promhttp.go:38] Error gathering metrics: [from Gatherer #1] [, collector="mssql_stan...pe *string
4月 09 11:26:13 localhost.localdomain sql_exporter_107[878]: I0409 11:26:13.531694     878 promhttp.go:38] Error gathering metrics: [from Gatherer #1] [, collector="mssql_stan...pe *string
4月 09 11:28:13 localhost.localdomain sql_exporter_107[878]: I0409 11:28:13.535657     878 promhttp.go:38] Error gathering metrics: [from Gatherer #1] [, collector="mssql_stan...pe *string
4月 09 11:30:13 localhost.localdomain sql_exporter_107[878]: I0409 11:30:13.528976     878 promhttp.go:38] Error gathering metrics: [from Gatherer #1] [, collector="mssql_stan...pe *string
4月 09 11:32:13 localhost.localdomain sql_exporter_107[878]: I0409 11:32:13.526881     878 promhttp.go:38] Error gathering metrics: [from Gatherer #1] [, collector="mssql_stan...pe *string
4月 09 11:34:13 localhost.localdomain sql_exporter_107[878]: I0409 11:34:13.535847     878 promhttp.go:38] Error gathering metrics: [from Gatherer #1] [, collector="mssql_stan...pe *string
4月 09 11:36:13 localhost.localdomain sql_exporter_107[878]: I0409 11:36:13.533302     878 promhttp.go:38] Error gathering metrics: [from Gatherer #1] [, collector="mssql_stan...pe *string
4月 09 11:38:13 localhost.localdomain sql_exporter_107[878]: I0409 11:38:13.527664     878 promhttp.go:38] Error gathering metrics: [from Gatherer #1] [, collector="mssql_stan...pe *string
4月 09 11:40:13 localhost.localdomain sql_exporter_107[878]: I0409 11:40:13.532112     878 promhttp.go:38] Error gathering metrics: [from Gatherer #1] [, collector="mssql_stan...pe *string
4月 09 11:42:13 localhost.localdomain sql_exporter_107[878]: I0409 11:42:13.526597     878 promhttp.go:38] Error gathering metrics: [from Gatherer #1] [, collector="mssql_stan...pe *string
Hint: Some lines were ellipsized, use -l to show in full.
服务端配置
[root@localhost opt]# cat /opt/prometheus/sd_configs/mssqlserverdb.yml
- targets: ['192.168.0.102:9398']
  labels:
    group: mssqlserverdb
    instance: '192.168.0.107'
    userid: 4403011340
    mobile: 18218026974
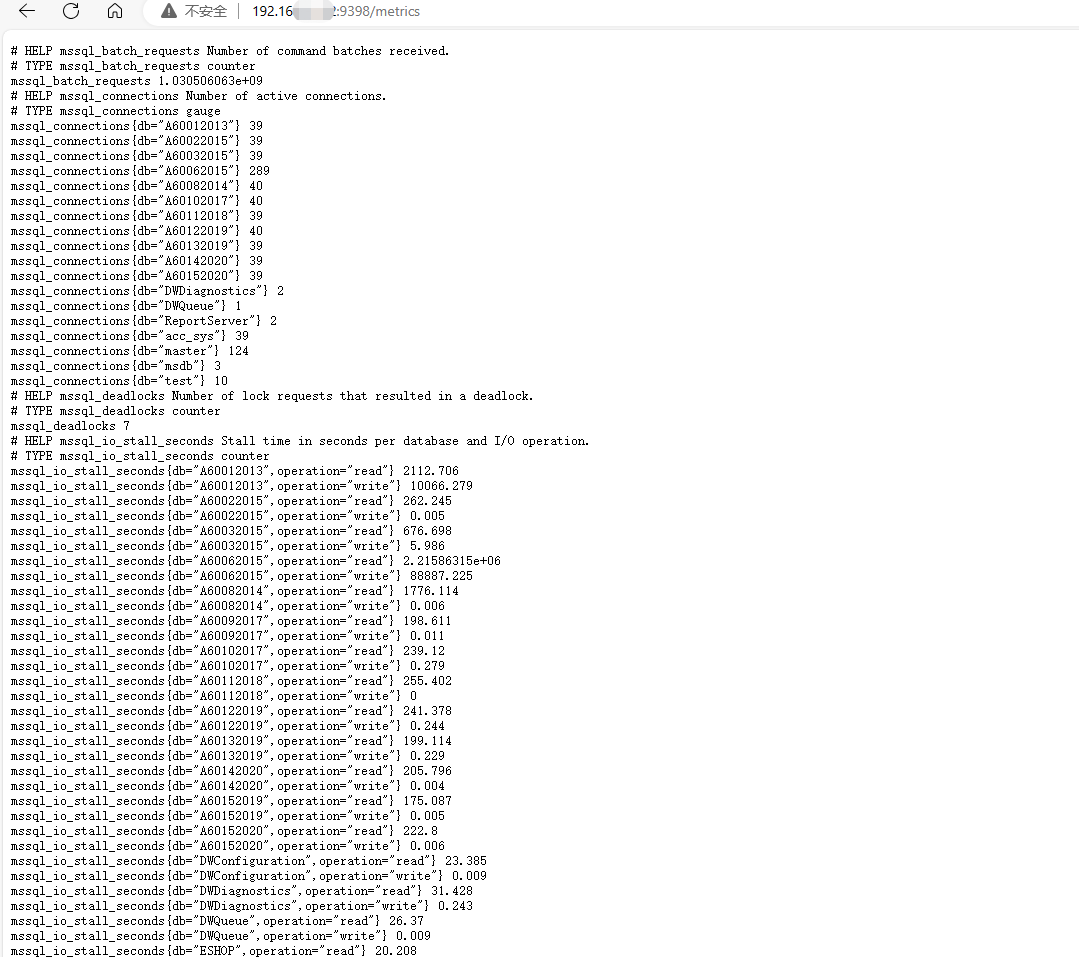
核验

单击包含IP地址和端口的链接,看到如下图,表示监控配置成功:
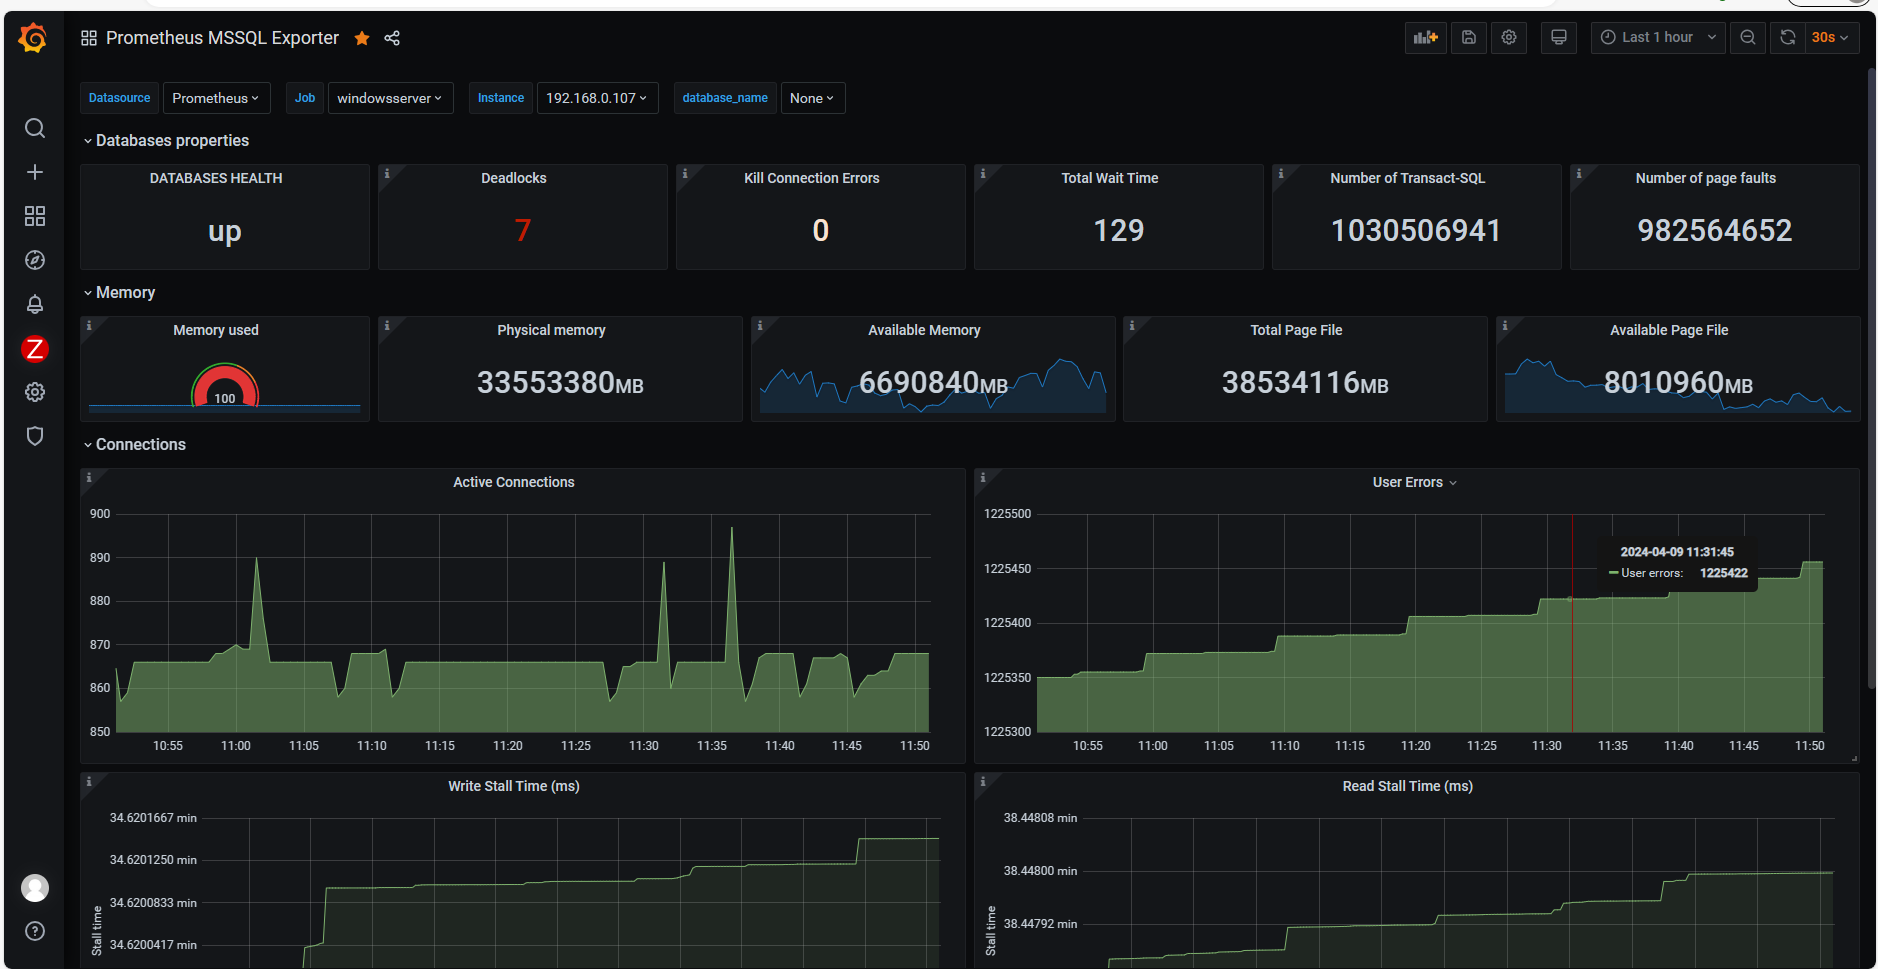
配合grafana的监控仪表盘
仪表盘地址https://grafana.com/grafana/dashboards/?search=mssql
仪表盘的下载、导入此处省略,参考我前面的文章 https://www.modb.pro/db/28988 配置即可。
监控效果图:
参考文档
https://www.cnblogs.com/jinanxiaolaohu/p/17848034.html
最后修改时间:2024-05-09 17:09:14
「喜欢这篇文章,您的关注和赞赏是给作者最好的鼓励」
关注作者
【版权声明】本文为墨天轮用户原创内容,转载时必须标注文章的来源(墨天轮),文章链接,文章作者等基本信息,否则作者和墨天轮有权追究责任。如果您发现墨天轮中有涉嫌抄袭或者侵权的内容,欢迎发送邮件至:contact@modb.pro进行举报,并提供相关证据,一经查实,墨天轮将立刻删除相关内容。
