


简介
PgBouncer工具可以用于PostgreSQL和Greenplum数据库连接的连接池。
在Greenplum数据库中使用pgBouncer作为连接池管理器是有益的,尤其是在高并发的场景下。pgBouncer作为一个轻量级的数据库连接池管理器,它可以有效减少数据库服务器建立和销毁连接的开销,提高系统性能和稳定性。
以下是在Greenplum中使用pgBouncer的一些好处:
连接复用:pgBouncer能够维持少量的持久连接,并让多个客户端请求共享这些连接,从而避免了频繁创建和销毁连接的开销。
资源管理:通过限制并发连接数,可以有效地管理Greenplum数据库的资源,防止因连接数过多而导致的资源耗尽问题。
性能提升:减少TCP连接的建立和销毁次数,可以减少网络开销和内存管理的负担,提高数据库的整体响应速度。
稳定性增强:通过连接池,pgBouncer能够更好地处理短连接请求,避免因为连接数过多而引起的数据库崩溃风险。
安全性:pgBouncer支持SSL加密连接,增强了数据传输过程中的安全性。
易用性:pgBouncer配置相对简单,易于集成到现有的部署和监控体系中。
pgbouncer 官网介绍 http://www.pgbouncer.org/
配置文件:http://www.pgbouncer.org/config.html
有关使用greenplum下pgbouncer的总结
1、pgbouncer是 PostgreSQL的轻量的连接池,可以有效降低连接数,提升系统性能。Greenplum默认已经自带pgbouncer工具,无需额外安装,只是多数组织在实践中似乎并未启用此服务,也算是一种资源的浪费了。
2、pgbouncer默认存在于Greenplum数据库的bin目录下。
1[gpadmin@mdw ~]$ which pgbouncer
2/usr/local/greenplum-db-6.26.3/bin/pgbouncer
3、pgbouncer可以配置在运行在Greenplum数据库的master上或另一台机器上,用户最好运行在Greenplum数据库的master上。
4、若配置了[databases]
的具体值,则使用pgbouncer不能切换到其它数据库中
1postgres=# \c db1
2connection to server at "192.16.7.163", port 6432 failed: FATAL:  no such database: db1
3Previous connection kept
4postgres=# \l db1
5                                          List of databases
6 Name | Owner | Encoding |  Collate   |   Ctype    | ICU Locale | Locale Provider | Access privileges
7------+-------+----------+------------+------------+------------+-----------------+-------------------
8 db1  | xxt   | UTF8     | en_US.utf8 | en_US.utf8 |            | libc            |
9(1 row)
若想pgbouncer可以连接任意数据库,则可以在[databases]
下配置* =
5、 欧拉系统openEuler 22.03 LTS需要安装libevent-2.0.21包,否则会报错:/usr/local/greenplum-db/bin/pgbouncer: error while loading shared libraries: libevent-2.0.so.5: cannot open shared object file: No such file or directory
1rpm -ivh libevent-2.0.21-4.el7.x86_64.rpm --force
6、报错“pooler error: unsupported startup parameter: search_path”,或“unsupported startup parameter: extra_float_digits”
1ignore_startup_parameters = extra_float_digits,search_path
7、端口默认为6432,也可以配置6543端口。
8、我使用auth_query配置后,并不能从数据库中查询密码,可能是版本问题吧,所以只能在创建新用户或更新用户密码后,需要先执行导出密码copy (select '"'||usename ||'" "' || passwd||'"' from pg_shadow order by 1) to '/usr/local/greenplum-db/pgbouncer/users.txt';
1 failed: FATAL:  server login has been failing, try again later (server_login_retry)
2 failed: FATAL:  bouncer config error
9、若报错“failed: FATAL: no pg_hba.conf entry for host "[local]", user "pgbouncer", database "postgres", SSL off”,可以考虑在GreenPlum的master节点的pg_hba.conf文件中配置如下内容:
1local all all md5
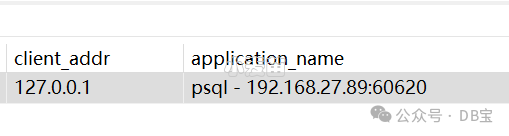
10、使用pgbouncer的一个缺点是:在GP库中直接查询时,只能看到客户端的IP是pgbouncer的IP。所以,若出现问题,要进行追踪是,增加了难度。但是,可以增加参数application_name_add_host=1
用来记录客户端的真实的IP和端口,然后在的pg_stat_activity.application_name中就可以看到了。如下:
GreenPlum 环境快速部署使用并配置pgbouncer
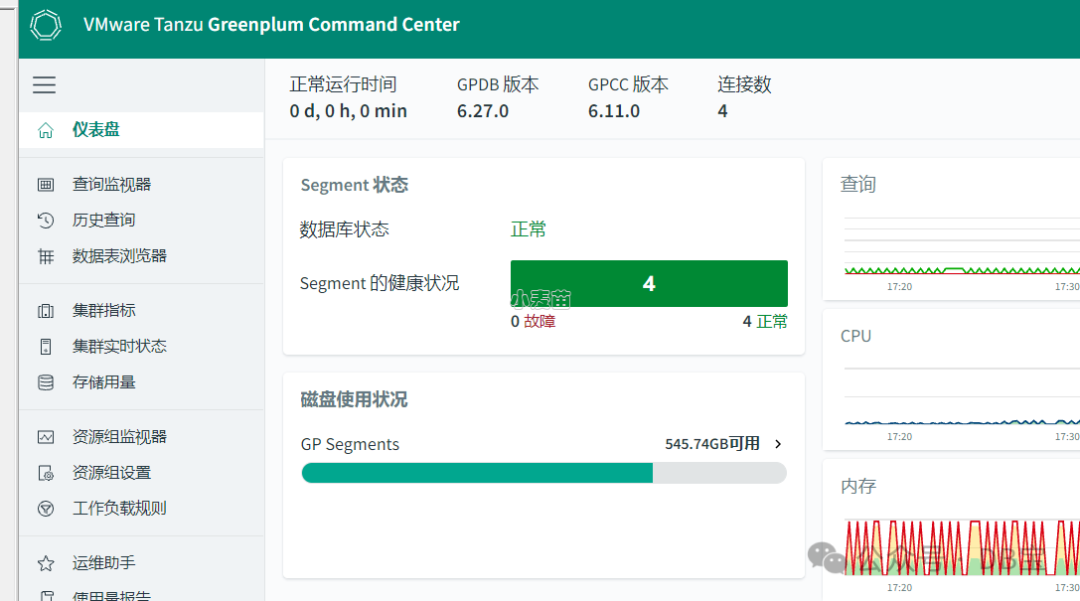
GreenPlum 环境快速部署
 1docker rm -f gpdb6270
 2docker run -itd --name gpdb6270 -h gpdb6270 \
 3  -p 5627:5432 -p 26270:28080  \
 4  -v /sys/fs/cgroup:/sys/fs/cgroup \
 5  --privileged=true lhrbest/greenplum:6.27.0_v2 \
 6  /usr/sbin/init
 7
 8docker exec -it gpdb6270 bash
 9
10su - gpadmin
11
12
13gpstart -a
14gpcc start
15
16
17
18gpcc status
19gpstate
配置pgbouncer
在mdw服务器上做如下的配置。
 1create user pgbouncer password 'lhr' superuser;
 2
 3mkdir -p /usr/local/greenplum-db/pgbouncer
 4cat > /usr/local/greenplum-db/pgbouncer/pgbouncer.ini <<"EOF"
 5[databases]
 6* = host=127.0.0.1 port=5432
 7
 8[pgbouncer]
 9pool_mode = session
10
11listen_port = 6432
12listen_addr = *
13
14auth_type = md5
15auth_user = pgbouncer
16auth_file = /usr/local/greenplum-db/pgbouncer/users.txt
17
18
19logfile = /usr/local/greenplum-db/pgbouncer/pgbouncer.log
20pidfile = /usr/local/greenplum-db/pgbouncer/pgbouncer.pid
21
22admin_users = pgbouncer
23
24default_pool_size=60
25max_client_conn=2000
26
27
28ignore_startup_parameters = extra_float_digits,search_path
29
30so_reuseport = 1
31application_name_add_host=1
32
33EOF
34
35
36psql
37copy (select '"'||usename ||'"  "' || passwd||'"' from pg_shadow order by 1) to '/usr/local/greenplum-db/pgbouncer/users.txt';
38
39
40
41/usr/local/greenplum-db/bin/pgbouncer -d /usr/local/greenplum-db/pgbouncer/pgbouncer.ini
42/usr/local/greenplum-db/bin/pgbouncer -Rd /usr/local/greenplum-db/pgbouncer/pgbouncer.ini
43
44
45[gpadmin@gpdb6270 ~]$ psql -U pgbouncer -h127.0.0.1 -p 6432 -d pgbouncer
46Password for user pgbouncer:
47psql (9.4.26, server 1.21.0/bouncer)
48Type "help" for help.
49
50pgbouncer=# show clients;
51 type |   user    | database  | state  |   addr    | port  | local_addr | local_port |      connect_time       |      request_time       | wait | wait_us | close_needed |    ptr    | link | remote_pid | tls |    application_name    | prepared_statements
52------+-----------+-----------+--------+-----------+-------+------------+------------+-------------------------+-------------------------+------+---------+--------------+-----------+------+------------+-----+------------------------+---------------------
53 C    | pgbouncer | pgbouncer | active | 127.0.0.1 | 47030 | 127.0.0.1  |       6432 | 2024-04-19 18:18:34 CST | 2024-04-19 18:18:38 CST |    0 |       0 |            0 | 0x12cfb40 |      |          0 |     | psql - 127.0.0.1:47030 |                   0
54(1 row)
55
56pgbouncer=#
57
prometheus+grafana环境快速搭建
普罗米修斯+grafana的详细搭建过程,之前麦老师介绍过很多次了,这里直接使用docker来创建:
1docker rm -f lhrprometheus
2docker run -d --name lhrprometheus -h lhrprometheus \
3 -p 2222:22 -p 23389:3389 \
4 -p 29090:9090 -p 29093:9093 -p 23000:3000 \
5  -v /sys/fs/cgroup:/sys/fs/cgroup   --restart=always \
6 --privileged=true lhrbest/lhrprometheus:2.0 \
7   /usr/sbin/init
8
9docker exec -it lhrprometheus bash
对pgbouncer的监控
目前对pgbouncer的监控有2个工具,分别为:https://github.com/spreaker/prometheus-pgbouncer-exporter 和 https://github.com/prometheus-community/pgbouncer_exporter,下面分别介绍。
工具1:pgbouncer-exporter
缺点:安装麻烦,2022.05.20后再没更新过
参考:https://github.com/spreaker/prometheus-pgbouncer-exporter
dashboards使用:13353 https://grafana.com/grafana/dashboards/13353-pgbouncer/
docker地址:https://hub.docker.com/r/spreaker/prometheus-pgbouncer-exporter
安装过程:
 1-- 1、需要有pg_config
 2yum install -y https://download.postgresql.org/pub/repos/yum/reporpms/EL-7-x86_64/pgdg-redhat-repo-latest.noarch.rpm
 3
 4sed -i 's/gpgcheck=1/gpgcheck=0/g'  /etc/yum.repos.d/pgdg-redhat-all.repo
 5sed -i 's/repo_gpgcheck = 1/repo_gpgcheck = 0/g'  /etc/yum.repos.d/pgdg-redhat-all.repo
 6
 7yum install -y postgresql15 postgresql15-server postgresql15-contrib postgresql15-libs
 8echo "export PATH=/usr/pgsql-15/bin:$PATH" >> /etc/profile
 9
10
11
12-- 2、需要先安装依赖包 ,否则报错
13./psycopg/psycopg.h:36:22: fatal error: libpq-fe.h: No such file or directory
14./psycopg/psycopg.h:35:20: fatal error: Python.h: No such file or directory
15
16 yum install -y python3-devel  libpq5 libpq5-devel
17 pip3 install prometheus-pgbouncer-exporter
18
19
20-- 3、启动
21nohup pgbouncer-exporter --config /etc/pgbouncer-exporter/config.yml &
22
23curl http://127.0.0.1:9100/metrics
24
25
26mkdir -p /etc/pgbouncer-exporter/
27cat > /etc/pgbouncer-exporter/config.yml <<EOF
28# The host on which the exporter should listen to (defaults to 127.0.0.1)
29exporter_host: 0.0.0.0
30
31# The port on which the exporter should listen to (defaults to 9100)
32exporter_port: 9100
33
34# The list of pgbouncer instances to monitor
35pgbouncers:
36  - dsn: postgresql://pgbouncer:lhr@192.16.7.163:6543/pgbouncer
37    exclude_databases:
38      - pgbouncer
39    extra_labels:
40      pool_id: 1
41EOF
42
43
44
45
46-- 或者使用docker直接创建也可以
47docker run -d \
48  --name pgbouncer-exporter \
49  -v /etc/timezone:/etc/timezone \
50  -v /etc/localtime:/etc/localtime \
51  -p 9127:9127 \
52  -v /etc/pgbouncer-exporter/config.yml:/etc/pgbouncer-exporter/config.yml \
53  --restart=unless-stopped \
54  spreaker/prometheus-pgbouncer-exporter:2.0.3
55
56
57
58-- 4、修改配置文件: vi /usr/local/prometheus/prometheus.yml
59
60  - job_name: 'pgbouncer'
61    static_configs:
62    - targets: ['localhost:9100']
63      labels:
64        instance: 192.16.7.163:6543
65        node_ip: 192.16.7.163:6543
66
67curl -XPOST http://localhost:9090/-/reload
68
69
70-- 5、grafana添加dashboards
7113353
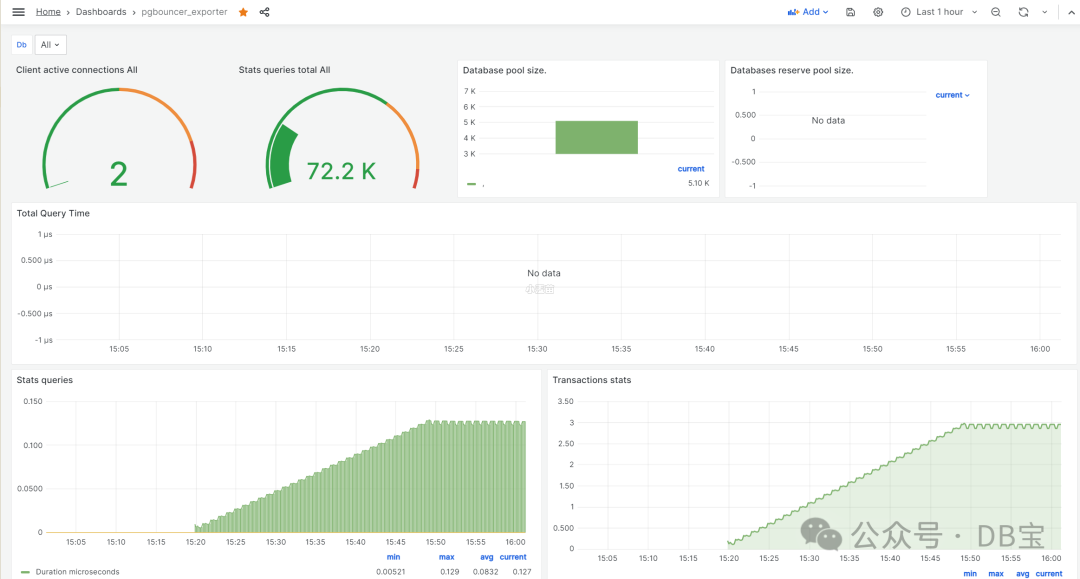
监控结果:

监控指标:
| Metric name | Type | PgBouncer | Description |
|---|---|---|---|
pgbouncer_stats_requests_total | counter | <= 1.7 | Total number of requests pooled. Could be transactions or queries, depending on pool mode. (labels: database) |
pgbouncer_stats_queries_total | counter | >= 1.8 | Total number of SQL queries pooled by pgbouncer (labels: database) |
pgbouncer_stats_queries_duration_microseconds | counter | all | Total number of microseconds spent waiting for a server to return a query response. Includes time spent waiting for an available connection. (labels: database) |
pgbouncer_stats_waiting_duration_microseconds | counter | >= 1.8 | Total number of microseconds spent waiting for an available connection. (labels: database) |
pgbouncer_stats_received_bytes_total | counter | all | Total volume in bytes of network traffic received by pgbouncer (labels: database) |
pgbouncer_stats_sent_bytes_total | counter | all | Total volume in bytes of network traffic sent by pgbouncer (labels: database) |
pgbouncer_stats_transactions_total | counter | >= 1.8 | Total number of SQL transactions pooled by pgbouncer (labels: database) |
pgbouncer_stats_transactions_duration_microseconds | counter | >= 1.8 | Total number of microseconds spent in a transaction. Includes time spent waiting for an available connection. (labels: database) |
pgbouncer_pools_client_active_connections | gauge | all | Client connections that are linked to server connection and can process queries (labels: database, user) |
pgbouncer_pools_client_waiting_connections | gauge | all | Client connections have sent queries but have not yet got a server connection (labels: database, user) |
pgbouncer_pools_server_active_connections | gauge | all | Server connections that linked to client (labels: database, user) |
pgbouncer_pools_server_idle_connections | gauge | all | Server connections that unused and immediately usable for client queries (labels: database, user) |
pgbouncer_pools_server_used_connections | gauge | all | Server connections that have been idle more than server_check_delay, so they needs server_check_query to run on it before it can be used (labels: database, user) |
pgbouncer_pools_server_testing_connections | gauge | all | Server connections that are currently running either server_reset_query or server_check_query (labels: database, user) |
pgbouncer_pools_server_login_connections | gauge | all | Server connections currently in logging in process (labels: database, user) |
pgbouncer_pools_client_maxwait_seconds | gauge | all | How long the first (oldest) client in queue has waited, in seconds (labels: database, user) |
pgbouncer_databases_database_pool_size | gauge | all | Configured pool size limit (labels: database, backend_database) |
pgbouncer_databases_database_reserve_pool_size | gauge | all | Configured reserve limit (labels: database, backend_database) |
pgbouncer_databases_database_current_connections | gauge | all | Total number of per-database Database connections count (labels: database, backend_database) |
pgbouncer_databases_database_max_connections | gauge | all | Maximum number of allowed connections per-database (labels: database, backend_database) |
pgbouncer_config_max_client_conn | gauge | all | Configuration of maximum number of allowed client connections |
pgbouncer_config_max_user_connections | gauge | all | Configuration of maximum number of server connections per user |
工具2:pgbouncer_exporter
优点:安装简单,配置也简单。
参考:https://github.com/prometheus-community/pgbouncer_exporter
docker地址:https://hub.docker.com/r/prometheuscommunity/pgbouncer-exporter
 1-- 1、安装
 2wget https://github.com/prometheus-community/pgbouncer_exporter/releases/download/v0.8.0/pgbouncer_exporter-0.8.0.linux-amd64.tar.gz
 3tar -zxvf pgbouncer_exporter-0.8.0.linux-amd64.tar.gz
 4cd pgbouncer_exporter-0.8.0.linux-amd64
 5mv pgbouncer_exporter /usr/local/bin/
 6
 7nohup pgbouncer_exporter --pgBouncer.connectionString="postgres://pgbouncer:lhr@192.16.7.163:6543/pgbouncer?sslmode=disable" &
 8curl http://127.0.0.1:9127/metrics
 9
10
11
12
13-- 2、修改配置文件: vi /usr/local/prometheus/prometheus.yml
14
15
16  - job_name: 'pgbouncer1'
17    static_configs:
18    - targets: ['localhost:9127']
19      labels:
20        instance: 192.16.7.163:6543
21
22
23curl -XPOST http://localhost:9090/-/reload
24
25
26-- 3、grafana添加dashboards
2714022
监控结果:
监控指标:
| PgBouncer column | Prometheus Metric | Description |
|---|---|---|
| stats_total_query_count | pgbouncer_stats_queries_pooled_total | Total number of SQL queries pooled |
| stats.total_query_time | pgbouncer_stats_queries_duration_seconds_total | Total number of seconds spent by pgbouncer when actively connected to PostgreSQL, executing queries |
| stats.total_received | pgbouncer_stats_received_bytes_total | Total volume in bytes of network traffic received by pgbouncer, shown as bytes |
| stats.total_requests | pgbouncer_stats_queries_total | Total number of SQL requests pooled by pgbouncer, shown as requests |
| stats.total_sent | pgbouncer_stats_sent_bytes_total | Total volume in bytes of network traffic sent by pgbouncer, shown as bytes |
| stats.total_wait_time | pgbouncer_stats_client_wait_seconds_total | Time spent by clients waiting for a server in seconds |
| stats.total_xact_count | pgbouncer_stats_sql_transactions_pooled_total | Total number of SQL transactions pooled |
| stats.total_xact_time | pgbouncer_stats_server_in_transaction_seconds_total | Total number of seconds spent by pgbouncer when connected to PostgreSQL in a transaction, either idle in transaction or executing queries |
| pools.cl_active | pgbouncer_pools_client_active_connections | Client connections linked to server connection and able to process queries, shown as connection |
| pools.cl_waiting | pgbouncer_pools_client_waiting_connections | Client connections waiting on a server connection, shown as connection |
| pools.sv_active | pgbouncer_pools_server_active_connections | Server connections linked to a client connection, shown as connection |
| pools.sv_idle | pgbouncer_pools_server_idle_connections | Server connections idle and ready for a client query, shown as connection |
| pools.sv_used | pgbouncer_pools_server_used_connections | Server connections idle more than server_check_delay, needing server_check_query, shown as connection |
| pools.sv_tested | pgbouncer_pools_server_testing_connections | Server connections currently running either server_reset_query or server_check_query, shown as connection |
| pools.sv_login | pgbouncer_pools_server_login_connections | Server connections currently in the process of logging in, shown as connection |
| pools.maxwait | pgbouncer_pools_client_maxwait_seconds | Age of oldest unserved client connection, shown as second |
| config.max_client_conn | pgbouncer_config_max_client_connections | Configured maximum number of client connections |
| config.max_user_connections | pgbouncer_config_max_user_connections | Configured maximum number of server connections per user |
参考
GreenPlum中的pgbouncer连接池参考:https://www.xmmup.com/zaigreenplumzhongshiyongpgbouncerlianjiechi.html
PostgreSQL中的pgbouncer连接池参考:https://www.xmmup.com/pglianjiechigongjuzhipgbouncer.html
