



Sysbench简介
Sysbench 是一款开源数据库常用的性能压测工具,常用于开源数据库如MySQL和PostgreSQL等关系型数据库的基准性能测试。本文档将通过sysbench工具对PanWeiDB进行基线POC性能测试的部署及方法进行说明,以便于后面在业务进行中对PanWeiDB数据库进行基础性能的了解及调优。本文档重在对性能测试的方法进行阐述讲解,因测试环境采用腾讯云且配置有限,所以不对具体在该配置下的性能进行深入探讨及测试。
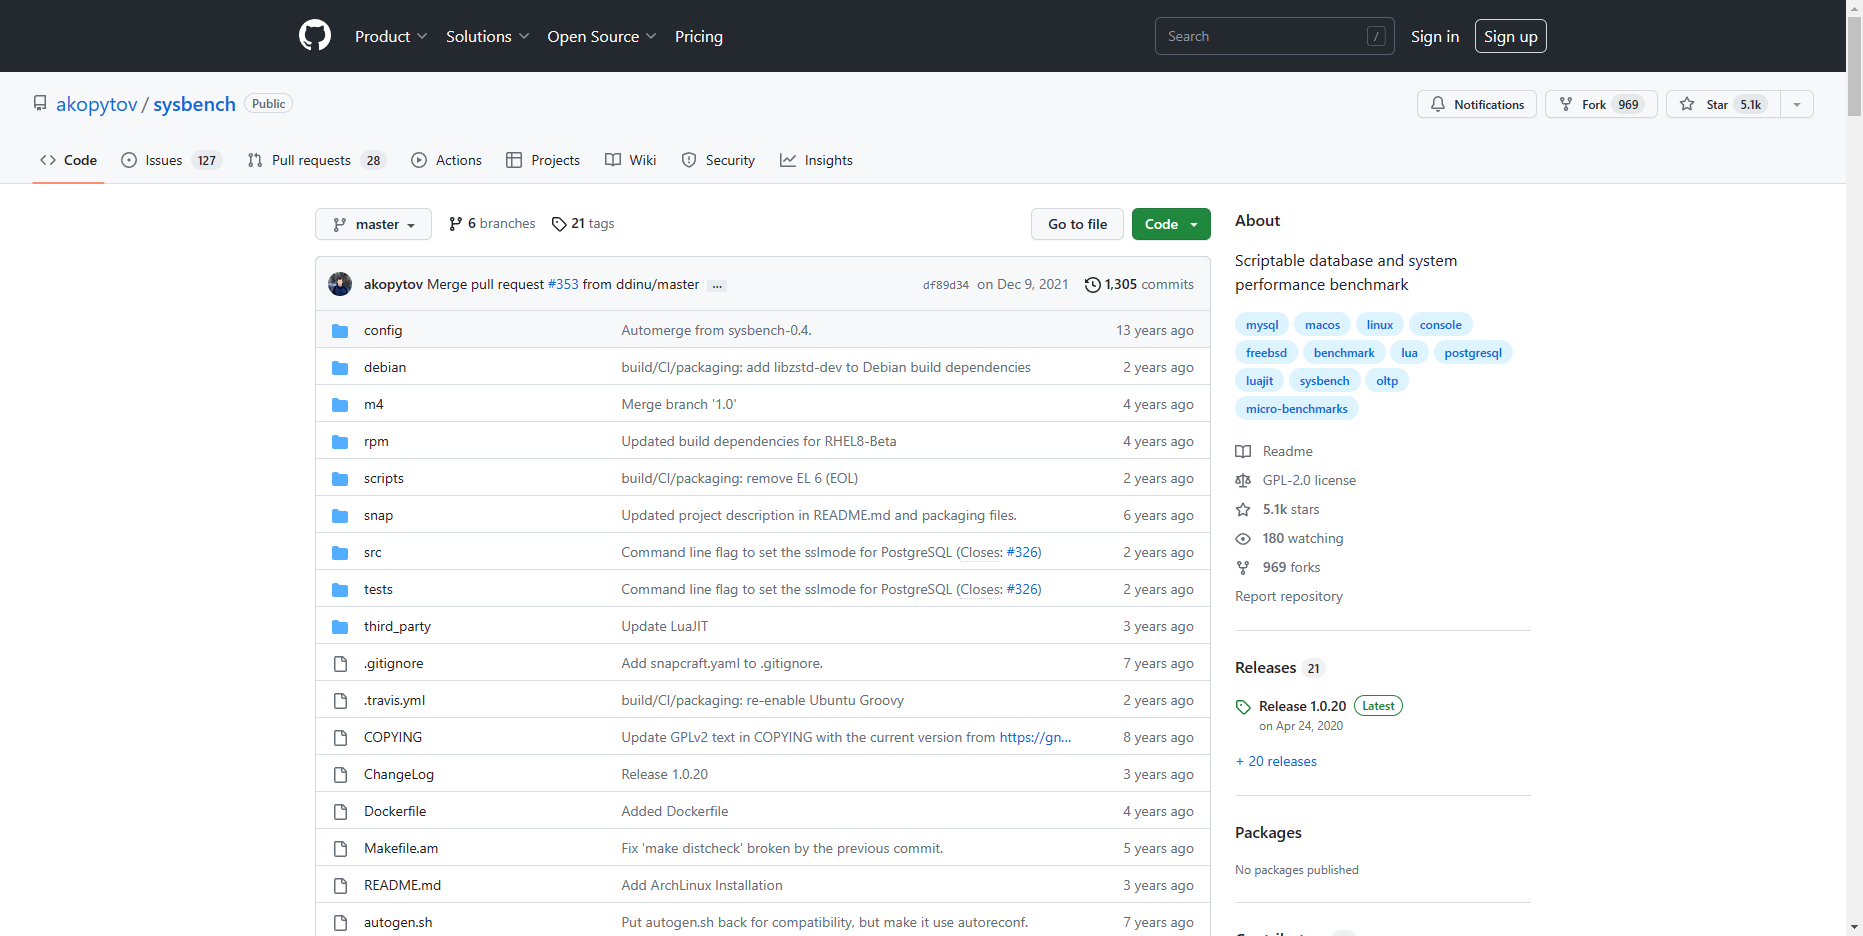
Sysbench下载地址:GitHub - akopytov/sysbench:可编写脚本的数据库和系统性能基准 ,如下图:
Sysbench安装
Sysbench适用于多种类型的操作系统,包括如Debian/Ubuntu、RHEL/CentOS、Fedora、Arch Linux、macOS等,根据官方的安装说明可分为二进制安装和源码编译安装两种方式,在PanWeiDB数据库的场景下需要通过源码编译安装的方式进行Sysbench的编译安装部署。这里我们使用以上连接的版本进行下载配置。
测试环境配置
本次测试配置采用腾讯云8C32G服务器进行部署测试,PanWeiDB V1.0.0版本采用单实例进行部署安装测试并按照官方文档进行参数最佳调优设置,操作系统为CentOS 7.6版本。
安装Sysbench
配置yum源并安装相关依赖
yum -y install make automake libtool pkgconfig libaio-devel
# For PostgreSQL support
yum -y install postgresql-devel
【备注】依据sysbench网站的提示必须安装相关yum源依赖后方可进行后续安装。
编译安装Sysbench
步骤1 创建/soft目录
mkdir -p /soft/
cd /soft/
步骤2 上传文件sysbench-master.zip和gaussdb.include.zip到/soft/目录下进行解压;
unzip sysbench-master.zip
步骤3 执行编译安装
cd /soft/sysbench-master
./autogen.sh
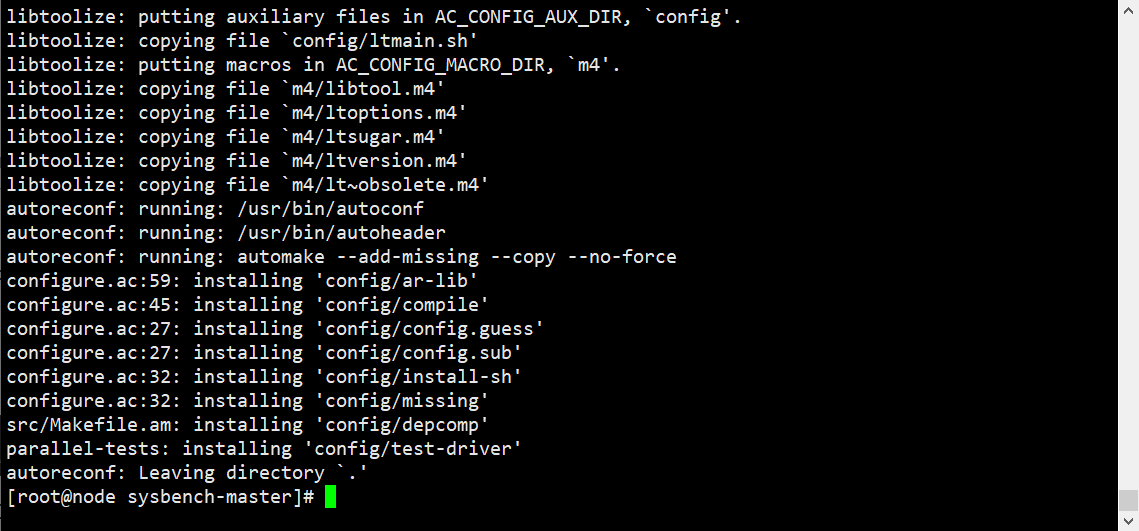
【备注】确保安装无error产生,否则无make文件生成。
步骤4 查询pylib库路径,选择LD_LIBRARY_PATH路径下的 /database/panweidb/tool/script/gspylib/配置pylib库路径;
env | grep lib

步骤5 执行编译配置,pgsql-include路径指定到gaussdb.include目录下,pgsql-libs路径指定到步骤4中的pylib路径即可;
./configure --with-pgsql --without-mysql --with-pgsql-libs=/database/panweidb/tool/lib:/database/panweidb/tool/script/gspylib/
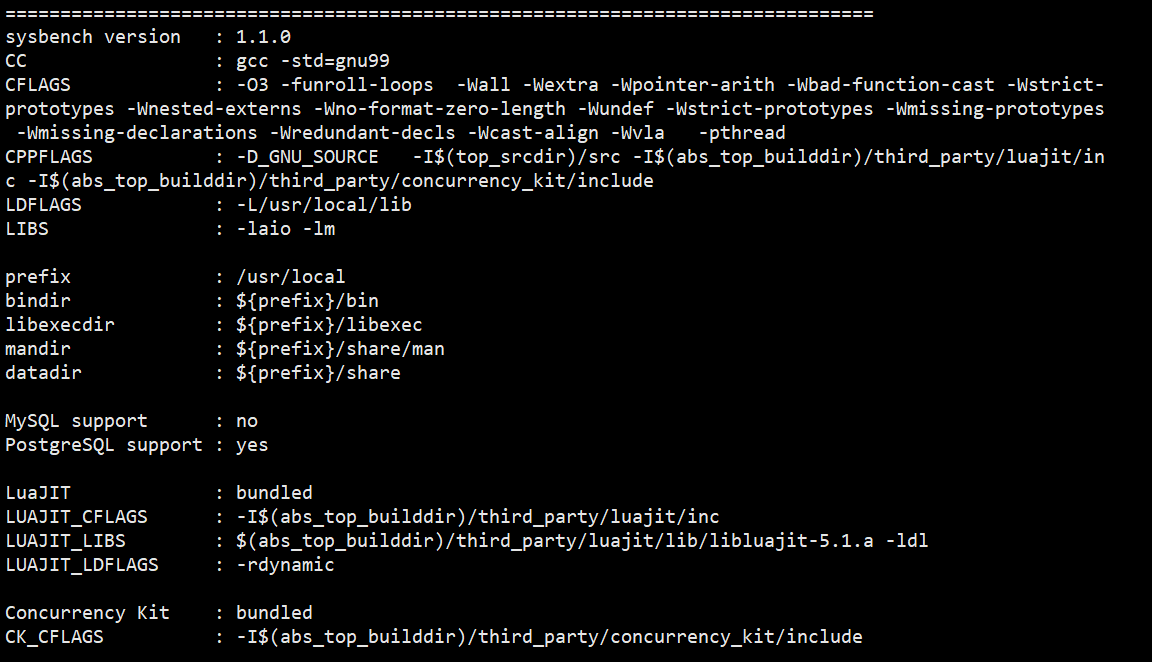
步骤6 执行编译配置安装
make -j && make install
步骤7 修改sysbench所属用户和组,与数据库所属用户和组保持相同;
chown -R omm:dbgrp /soft
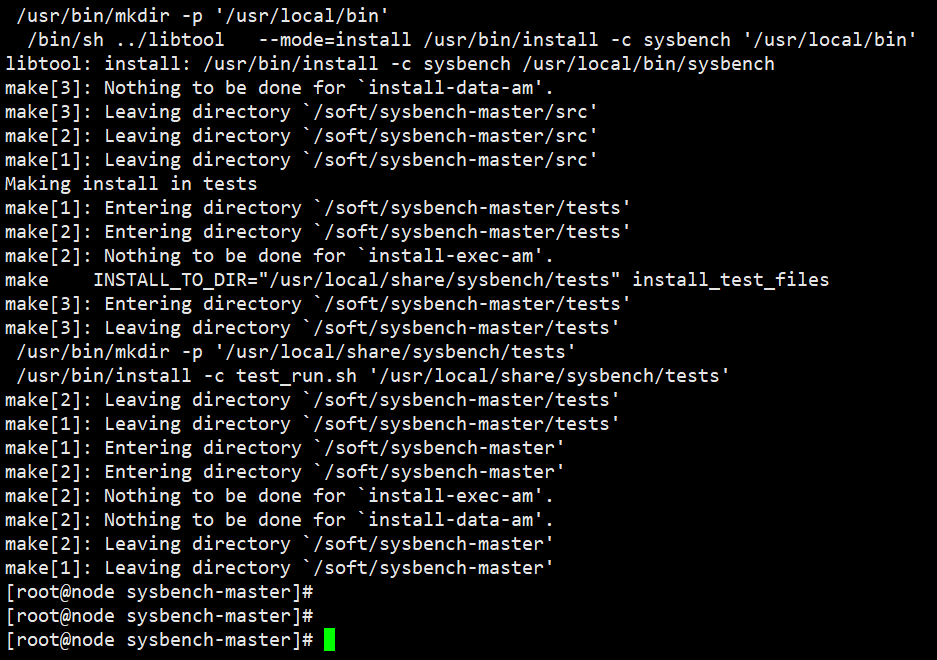
步骤8 使用如下命令测试是否安装成功
sysbench --version

以上为sysbench安装完成验证,可以进行后续验证测试。
Sysbench使用
Sysbench参数
[root@node sysbench-master]# sysbench --help Usage: sysbench [options]... [testname] [command] Commands implemented by most tests: prepare run cleanup help General options: --threads=N number of threads to use [1] --events=N limit for total number of events [0] --time=N limit for total execution time in seconds [10] --warmup-time=N execute events for this many seconds with statistics disabled before the actual benchmark run with statistics enabled [0] --forced-shutdown=STRING number of seconds to wait after the --time limit before forcing shutdown, or 'off' to disable [off] --thread-stack-size=SIZE size of stack per thread [64K] --thread-init-timeout=N wait time in seconds for worker threads to initialize [30] --rate=N average transactions rate. 0 for unlimited rate [0] --report-interval=N periodically report intermediate statistics with a specified interval in seconds. 0 disables intermediate reports [0] --report-checkpoints=[LIST,...] dump full statistics and reset all counters at specified points in time. The argument is a list of comma-separated values representing the amount of time in seconds elapsed from start of test when report checkpoint(s) must be performed. Report checkpoints are off by default. [] --debug[=on|off] print more debugging info [off] --validate[=on|off] perform validation checks where possible [off] --help[=on|off] print help and exit [off] --version[=on|off] print version and exit [off] --config-file=FILENAME File containing command line options --luajit-cmd=STRING perform LuaJIT control command. This option is equivalent to 'luajit -j'. See LuaJIT documentation for more information Pseudo-Random Numbers Generator options: --rand-type=STRING random numbers distribution {uniform, gaussian, pareto, zipfian} to use by default [uniform] --rand-seed=N seed for random number generator. When 0, the current time is used as an RNG seed. [0] --rand-pareto-h=N shape parameter for the Pareto distribution [0.2] --rand-zipfian-exp=N shape parameter (exponent, theta) for the Zipfian distribution [0.8] Log options: --verbosity=N verbosity level {5 - debug, 0 - only critical messages} [3] --percentile=N percentile to calculate in latency statistics (1-100). Use the special value of 0 to disable percentile calculations [95] --histogram[=on|off] print latency histogram in report [off] General database options: --db-driver=STRING specifies database driver to use ('help' to get list of available drivers) --db-ps-mode=STRING prepared statements usage mode {auto, disable} [auto] --db-debug[=on|off] print database-specific debug information [off] Compiled-in database drivers: pgsql - PostgreSQL driver pgsql options: --pgsql-host=STRING PostgreSQL server host [localhost] --pgsql-port=N PostgreSQL server port [5432] --pgsql-user=STRING PostgreSQL user [sbtest] --pgsql-password=STRING PostgreSQL password [] --pgsql-db=STRING PostgreSQL database name [sbtest] --pgsql-sslmode=STRING PostgreSQL SSL mode (disable, allow, prefer, require, verify-ca, verify-full) [prefer] Compiled-in tests: fileio - File I/O test cpu - CPU performance test memory - Memory functions speed test threads - Threads subsystem performance test mutex - Mutex performance test See 'sysbench <testname> help' for a list of options for each test. |
【备注】这里需要掌握的主要参数类为General options和pgsql options ,属于sysbench常用的参数配置。
Sysbench脚本
Sysbench安装成功后,可通过/soft/sysbench-master/src/lua的路径查询到压测所需要的所有常用脚本,如下图所示:

图中绿色字体均为可执行的lua脚本,根据不同的压测场景所使用的脚本也有区别,可通过字面意思大致理解其使用的场景环境,具体如下:
- bulk_insert.lua:批量插入测试
- oltp_delete.lua:删除测试
- oltp_insert.lua:插入测试
- oltp_point_select.lua:基于主键进行的查询
- oltp_read_only.lua:只读测试
- oltp_read_write.lua:读写测试
- oltp_update_index.lua:基于主键进行更新,更新的是索引字段;
- oltp_update_non_index.lua:基于主键进行更新,更新的是非索引字段;
- oltp_write_only.lua:只写测试
- select_random_points.lua:基于索引进行随机查询
- select_random_ranges.lua:基于索引进行随机范围查询
Sysbench压测
Sysbench基准性能压测在实际使用中主要分为三个阶段,分别为:生成数据prepare、压测run、清理数据cleanup,三个阶段在实际使用中需要依次进行,但cleanup很少使用,往往在数据库中直接通过drop table的操作方式进行自清理数据。
在实际压测前需在PanWeiDB中创建测试账户及测试库,建议账户权限为sysadmin,如下:
[omm@node lua]$ gsql -d postgres -p 17700 -r gsql ((PanWeiDB(openGauss) 1.0.0 build 9a7e96bc) compiled at 2022-10-15 20:54:36 commit 0 last mr ) Non-SSL connection (SSL connection is recommended when requiring high-security) Type "help" for help. PanWeiDB=# create user test with password 'test@123' sysadmin; NOTICE: The encrypted password contains MD5 ciphertext, which is not secure. CREATE ROLE PanWeiDB=# create database testdb with owner test; CREATE DATABASE |
下面在实际POC测试中举例进行说明:
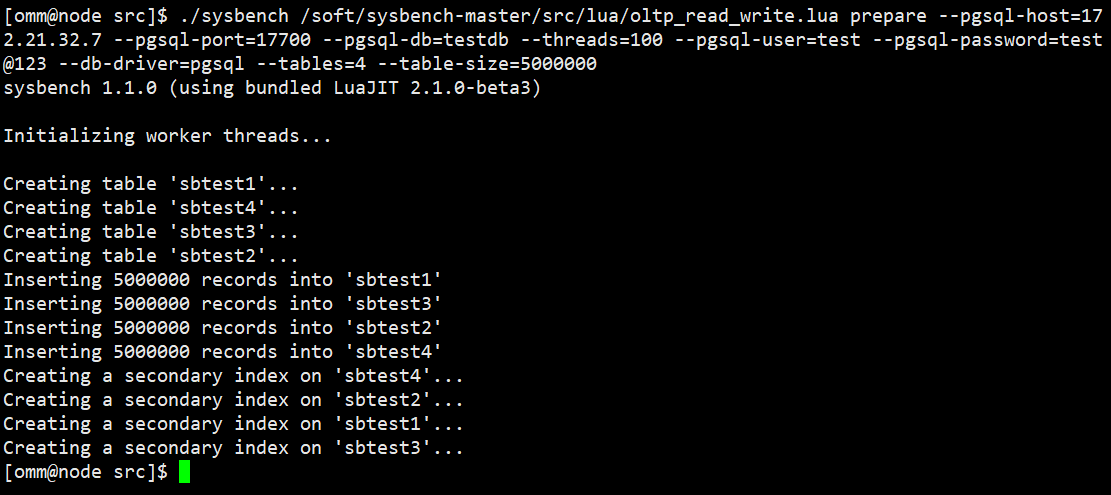
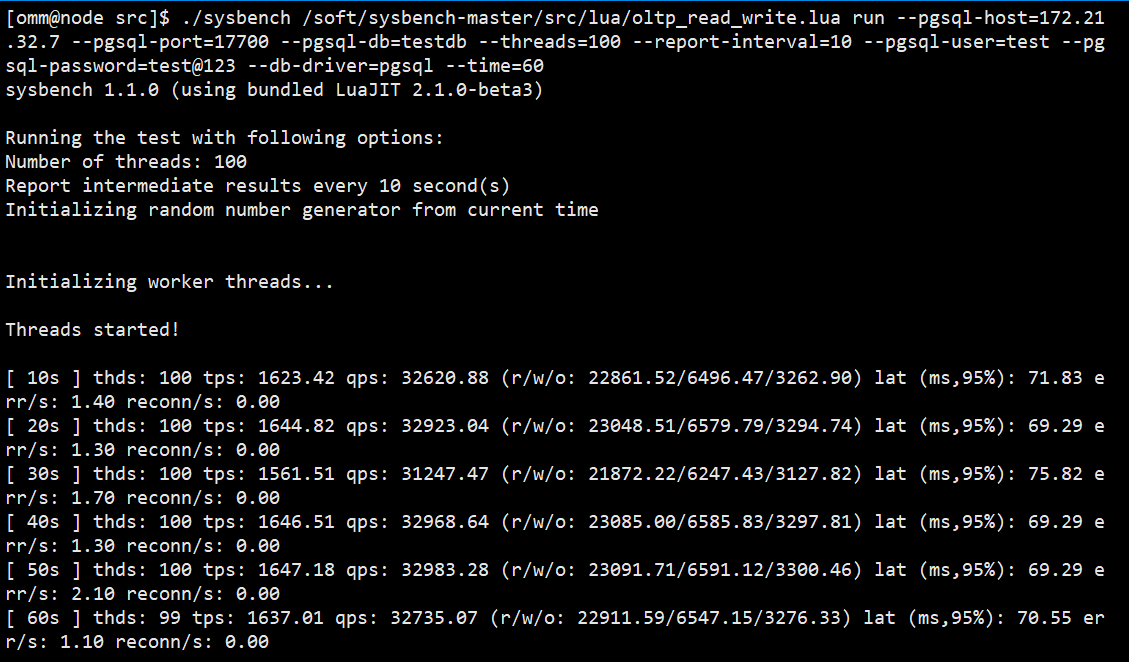
# 生成数据:100个并发线程创建4个表,每个表为5000000条数据量; cd /soft/sysbench-master/src ./sysbench /soft/sysbench-master/src/lua/oltp_read_write.lua prepare --pgsql-host=172.21.32.7 --pgsql-port=17700 --pgsql-db=testdb --threads=100 --pgsql-user=test --pgsql-password=test@123 --db-driver=pgsql --tables=4 --table-size=5000000 # 压测:100个并发线程每隔10秒钟进行压测显示,时长为60秒; ./sysbench /soft/sysbench-master/src/lua/oltp_read_write.lua run --pgsql-host=172.21.32.7 --pgsql-port=17700 --pgsql-db=testdb --threads=100 --report-interval=10 --pgsql-user=test --pgsql-password=test@123 --db-driver=pgsql --time=60 |
压测运行相关截图如下:
【生成数据】
【性能压测】
Sysbench 结果分析
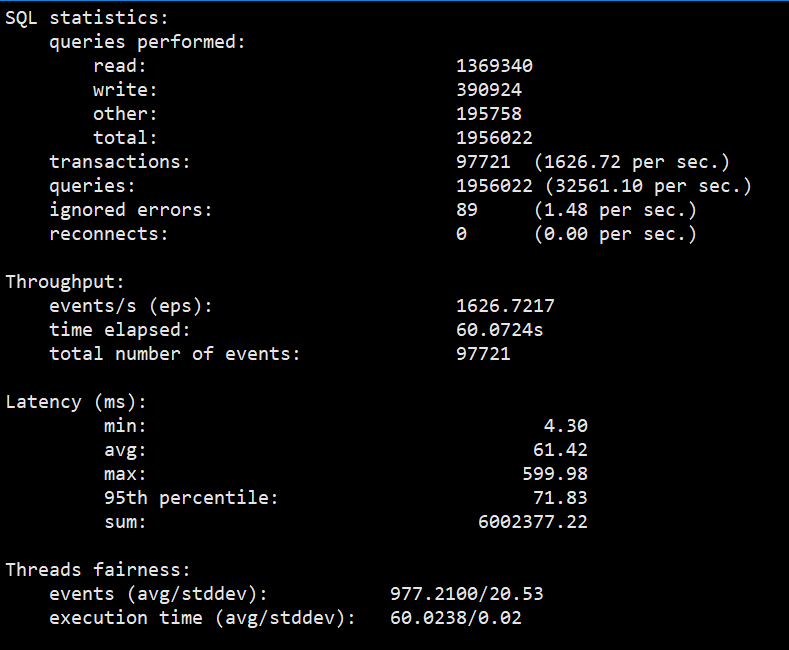
PanWeiDB单实例Sysbench基线性能压测结果如图:
压测命令说明
[omm@node src]$ ./sysbench /soft/sysbench-master/src/lua/oltp_read_write.lua run --pgsql-host=172.21.32.7 --pgsql-port=17700 --pgsql-db=testdb --threads=100 --report-interval=10 --pgsql-user=test --pgsql-password=test@123 --db-driver=pgsql --time=60 |
- oltp_read_write.lua run 为读写测试,当然首先需要 prepare 准备好该场景的相关数据;
- --threads=50 并发线程数量为50;
- --report-interval=10 每10秒进行一次报告打印;
- --db-driver=pgsql 在 GaussDB 下的压测统一使用该参数;
- --tables=4 --table-size=5000000 压测共4个表,每个表5000000条数据量;
- --time=60 共60秒压测时长,每10秒打印一次报告;
过程报告说明
Threads started! [ 10s ] thds: 100 tps: 1623.42 qps: 32620.88 (r/w/o: 22861.52/6496.47/3262.90) lat (ms,95%): 71.83 err/s: 1.40 reconn/s: 0.00 [ 20s ] thds: 100 tps: 1644.82 qps: 32923.04 (r/w/o: 23048.51/6579.79/3294.74) lat (ms,95%): 69.29 err/s: 1.30 reconn/s: 0.00 [ 30s ] thds: 100 tps: 1561.51 qps: 31247.47 (r/w/o: 21872.22/6247.43/3127.82) lat (ms,95%): 75.82 err/s: 1.70 reconn/s: 0.00 [ 40s ] thds: 100 tps: 1646.51 qps: 32968.64 (r/w/o: 23085.00/6585.83/3297.81) lat (ms,95%): 69.29 err/s: 1.30 reconn/s: 0.00 [ 50s ] thds: 100 tps: 1647.18 qps: 32983.28 (r/w/o: 23091.71/6591.12/3300.46) lat (ms,95%): 69.29 err/s: 2.10 reconn/s: 0.00 [ 60s ] thds: 99 tps: 1637.01 qps: 32735.07 (r/w/o: 22911.59/6547.15/3276.33) lat (ms,95%): 70.55 err/s: 1.10 reconn/s: 0.00 |
- tds 并发线程数;
- tps 每秒事务数;
- qps 每秒请求数,等于r(读操作)+w(写操作)+o(其它操作,主要包括 begin 和 commit 等);
- lat 延迟时间,ms,95% 是95%的查询时间小于或等于该值,单位毫秒;
- err/s 每秒错误数;
- reconn/s 每秒重试次数;
结论报告说明
SQL statistics: queries performed: read: 1369340 # 读操作数量 write: 390924 # 写操作数量 other: 195758 # 其它操作数量 total: 1956022 # 总操作数量,为上面三者总和; transactions: 97721 (1626.72 per sec.) # 总事务数(每秒事务数) queries: 1956022 (32561.10 per sec.) # 总操作数(每秒操作数) ignored errors: 89 (1.48 per sec.) # 忽略的错误数(每秒忽略的错误数) reconnects: 0 (0.00 per sec.) # 重试次数(每秒重试的次数) Throughput: events/s (eps): 1626.7217 # 每秒执行的event数量 time elapsed: 60.0724s # 执行event的时间 total number of events: 97721 # 执行event的总数,该值为以上两个值的乘积,在 oltp_read_write 压测脚本中,一个 event 其实就是一个事务; Latency (ms): min: 4.30 # 最小耗时 avg: 61.42 # 平均耗时 max: 599.98 # 最大耗时 95th percentile: 71.83 # 95% 的 event 的执行耗时 sum: 6002377.22 # 总耗时 Threads fairness: events (avg/stddev): 977.2100/20.53 # 平均每个线程执行event的数量,stddev 是个标准差,值越小,代表结果越稳定; execution time (avg/stddev): 60.0238/0.02 # 平均每个线程的执行时间 |
【备注】输出中,重点关注三个指标:
- 每秒事务数,即我们常说的 TPS。
- 每秒操作数,即我们常说的 QPS。
- 95% event 的执行耗时。
TPS 和 QPS 反映了系统的吞吐量,越大越好。执行耗时代表了事务的执行时长,越小越好。在一定范围内,并发线程数指定得越大,TPS 和 QPS 也会越高。
