本文讲解如下内容
(1)能够安装prometheus服务器
(2)能够通过安装node_exporter监控远程linux
(3)能够通过安装mysqld_exporter监控远程mysql数据库
(4)能够安装grafana
(5)能够在grafana添加prometheus数据源
(6)能够在grafana图形显示主机监控数据
(7)能够在grafana图形显示mysql监控数据
测试地址(可访问)
prometheus:http://1.15.57.253:9090/
grafana :http://1.15.57.253:3000/ 密码admin admin
架构图

安装规划
我的腾讯云IP是 1.15.57.253
因此组件都装在这台机器上。另外在这个机器上有安装mysql5.7
| 组件(IP1.15.57.253) | 端口 |
|---|---|
prometheus | 9090 |
node_exporter | 9100 |
mysqld_exporter | 9104 |
| grafana | 3000 |
| mysql5.7 | 3360 |
(1)安装prometheus
下载地址,
下载相应版本,安装到服务器上官网提供的是二进制版,解压就能用,不需要编译
https://prometheus.io/download/
解压
tar xf prometheus-2.31.1.linux-amd64.tar.gz -C /usr/local/
mv /usr/local/prometheus-2.31.1.linux-amd64/ /usr/local/prometheus
使用默认配置文件启动
/usr/local/prometheus/prometheus --config.file="/usr/local/prometheus/prometheus.yml" &
确认端口(9090)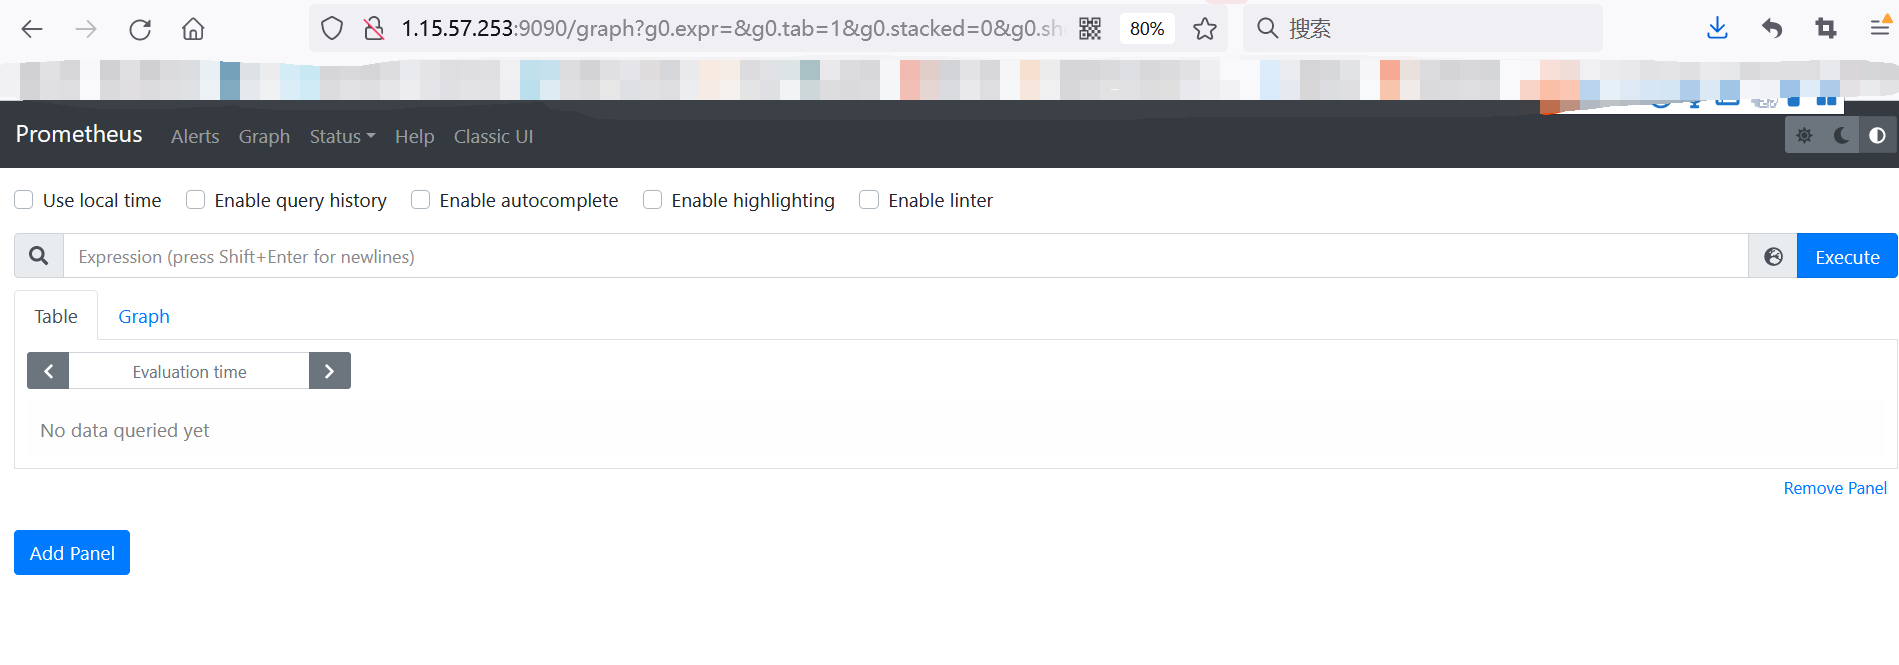
lsof -i:9090启动后可以直接访问http://1.15.57.253:9090/
默认只监控了本机一台,点Status --》点Targets --》可以看到只监控了本机
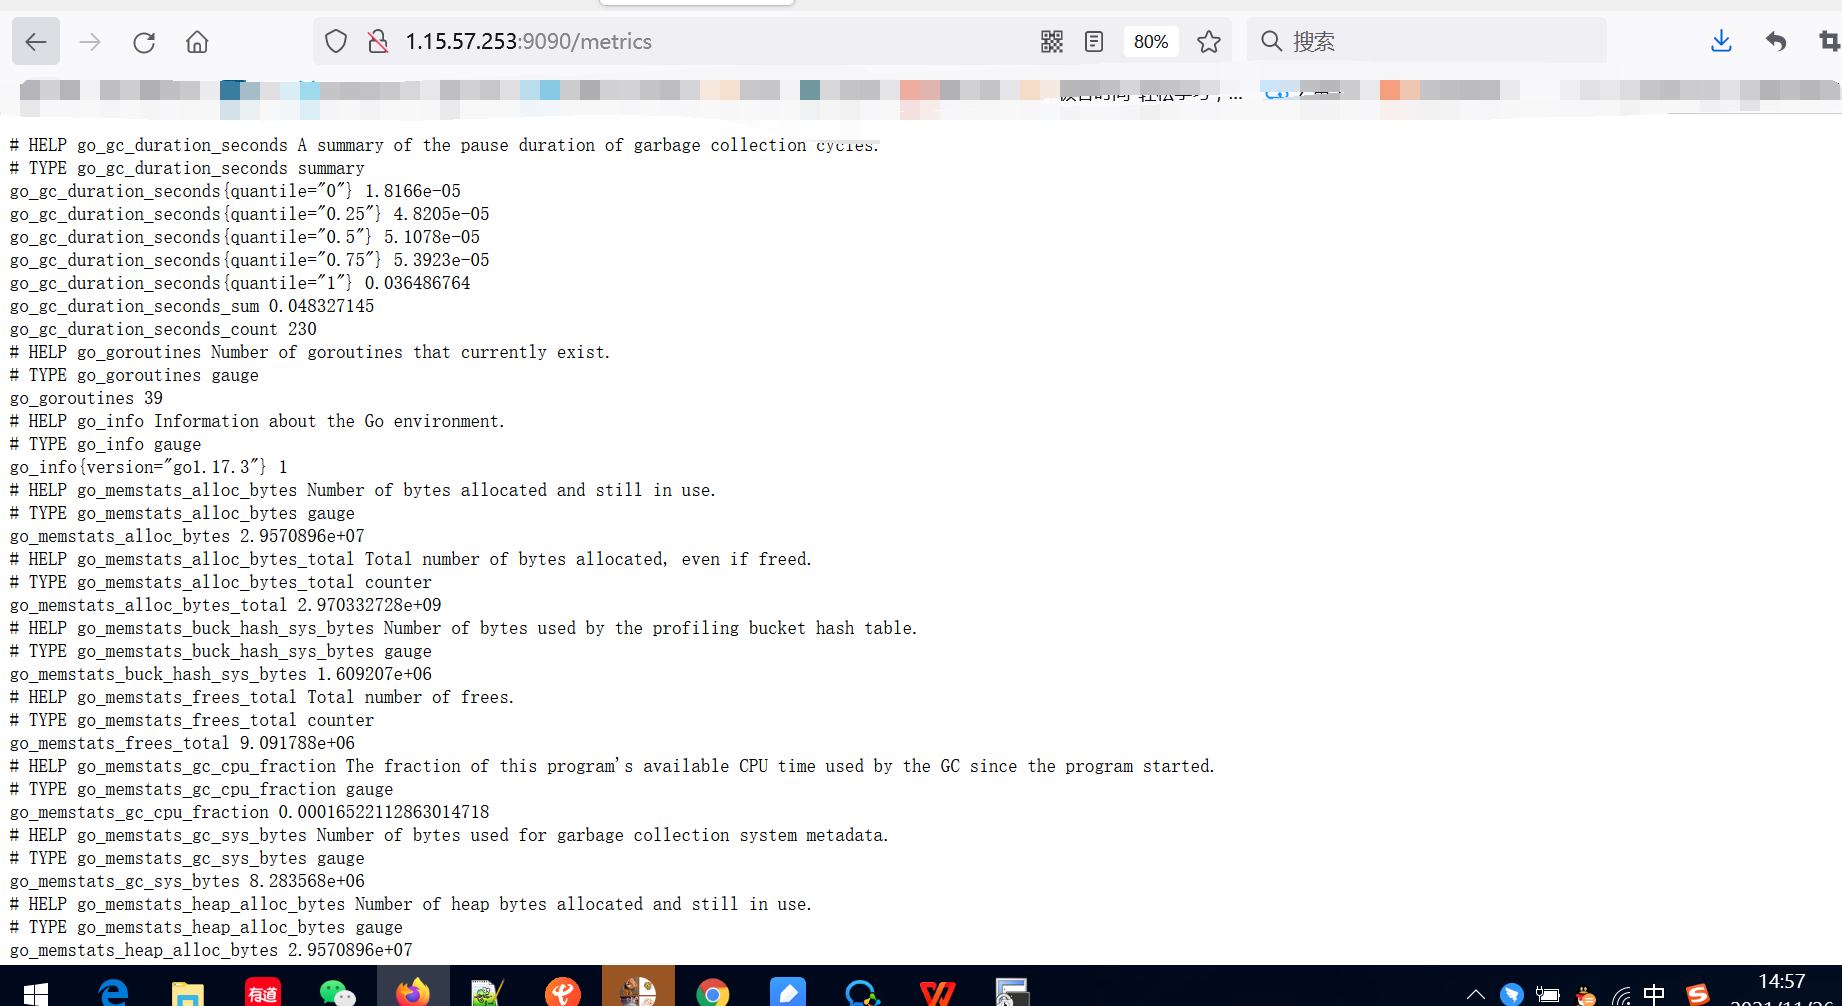
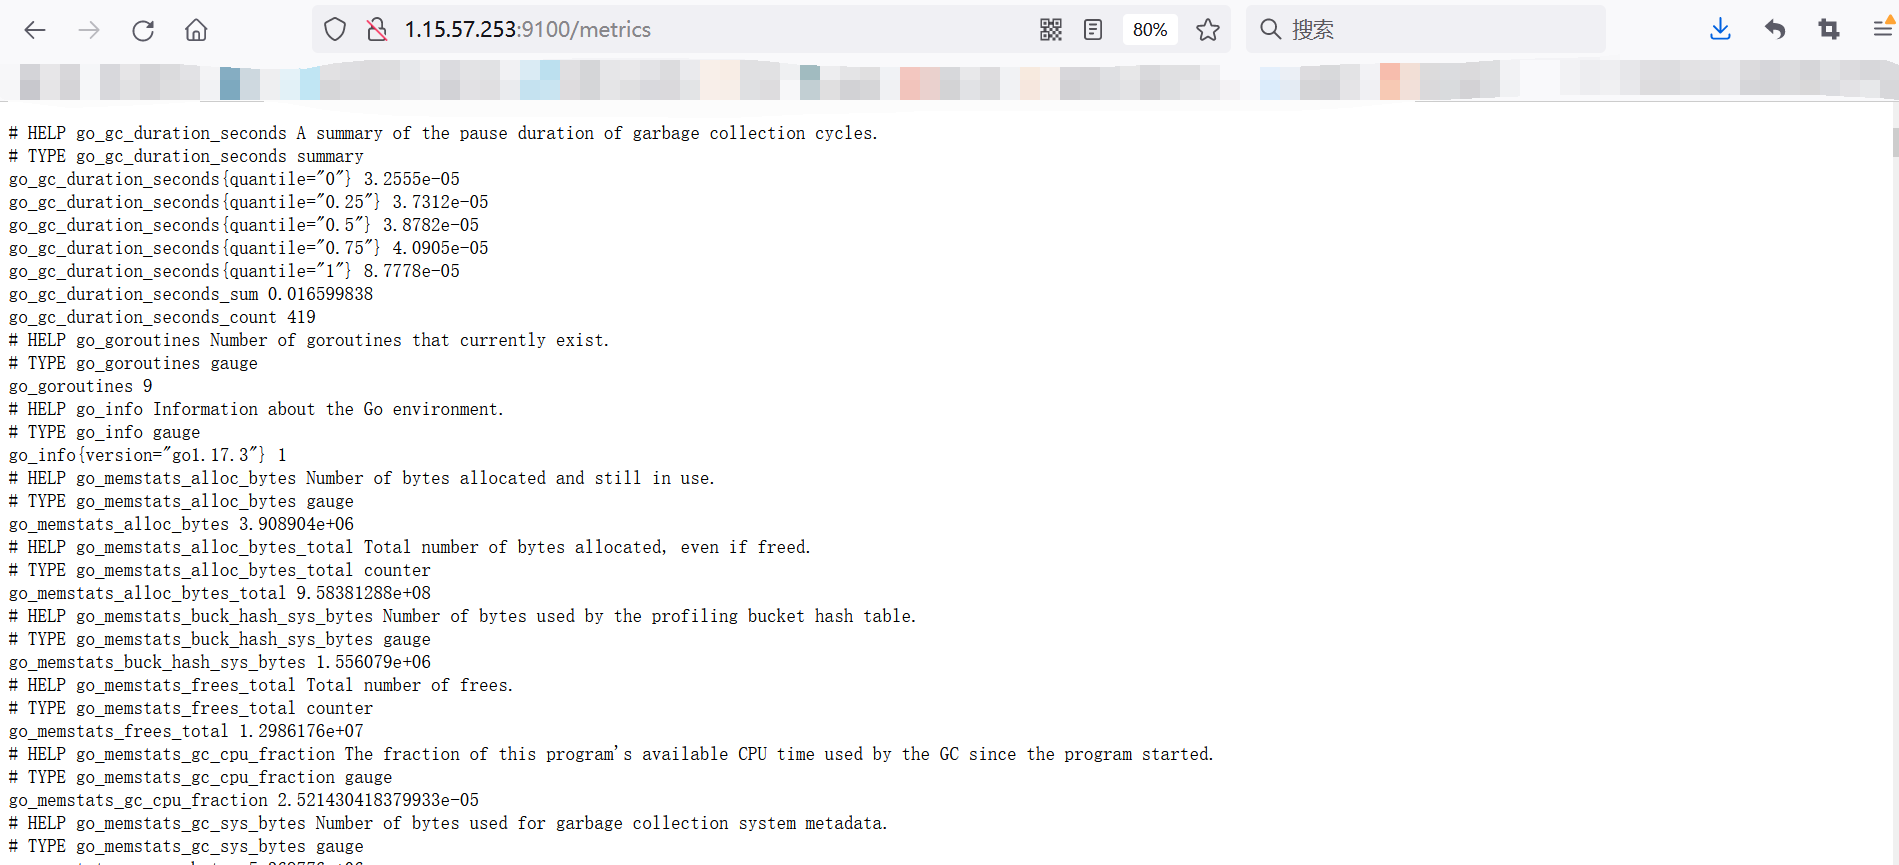
访问http://1.15.57.253:9090/metrics
主机数据展示
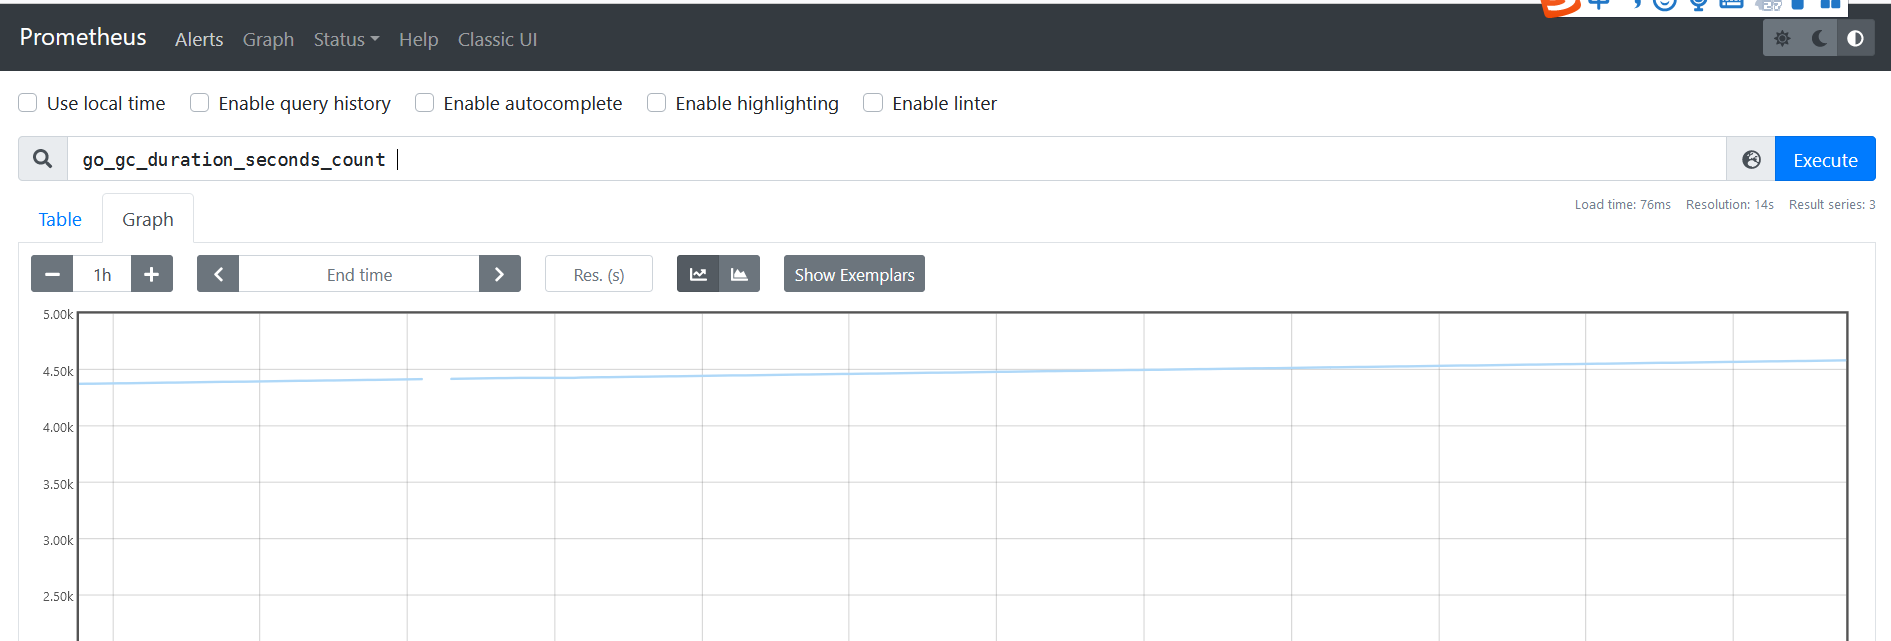
也可以在这里以通过关键字查询监控项
(2)监控远程Linux主机
下载地址:https://prometheus.io/download/
tar -xzf node_exporter-1.3.0.linux-amd64.tar.gz -C /usr/local/
mv /usr/local/node_exporter-1.3.0.linux-amd64/ /usr/local/node_exporter
启动命令node_exporter,可以直接使用此命令启动
nohup /usr/local/node_exporter/node_exporter &
确认端口(9100)
lsof -i:9100
扩展: nohup命令: 如果把启动node_exporter的终端给关闭,那么进程也会随之关闭。nohup命令会帮你解决这个问题。
通过浏览器访问http://被监控端IP:9100/metrics就可以查看到node_exporter在被监控端收集的监控信息
回到prometheus服务器的配置文件里添加被监控机器的配置段
vim /usr/local/prometheus/prometheus.yml
添加如下
- job_name: "node"

# metrics_path defaults to '/metrics'
# scheme defaults to 'http'.

static_configs:
- targets: ["1.15.57.253:9100"]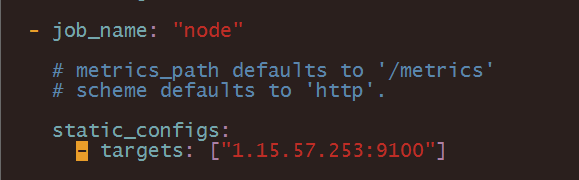
改完配置文件后,重启服务
pkill prometheus
lsof -i:9090 # 确认端口没有进程占
启动
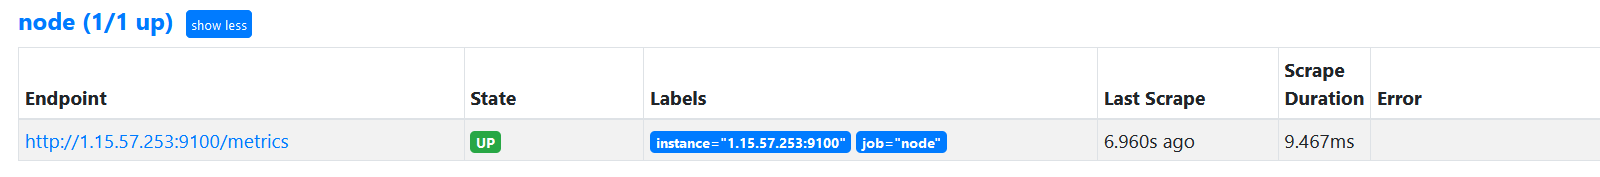
/usr/local/prometheus/prometheus --config.file="/usr/local/prometheus/prometheus.yml" &
lsof -i:9090 # 确认端口被占用,说明重启成功 回到web管理界面 --》点Status --》点Targets --》可以看到多了一台监控目标
(3)监控远程MySQL
下载地址: https://prometheus.io/download/
tar zxf mysqld_exporter-0.10.0.linux-amd64.tar.gz -C /usr/local/
cd /usr/local/
mv mysqld_exporter-0.10.0.linux-amd64/ mysqld_exporter
cd mysqld_exporter/
登录mysql创建一个监控用户
grant select,replication client,process ON *.* to 'mysql_monitor'@'localhost' identified by '123';(注意:授权ip为localhost,因为不是prometheus服务器来直接找mysql获取数据,而是prometheus服务器找mysql_exporter,mysql_exporter再找mysql。所以这个localhost是指的mysql_exporter的IP)
vim /usr/local/mysqld_exporter/.my.cnf
[client]
user=mysql_monitor
password=123

# 启动
nohup /usr/local/mysqld_exporter/mysqld_exporter  -config.my-cnf="/usr/local/mysqld_exporter/.my.cnf" &

确认端口
lsof -i:9104
回到prometheus服务器的配置文件里添加被监控的mysql的配置段
pkill prometheus
lsof -i:9090
vim /usr/local/prometheus/prometheus.yml
写入如下
- job_name: "agent_mysql"
# metrics_path defaults to '/metrics'
# scheme defaults to 'http'.
static_configs:
- targets: ["1.15.57.253:9104"]
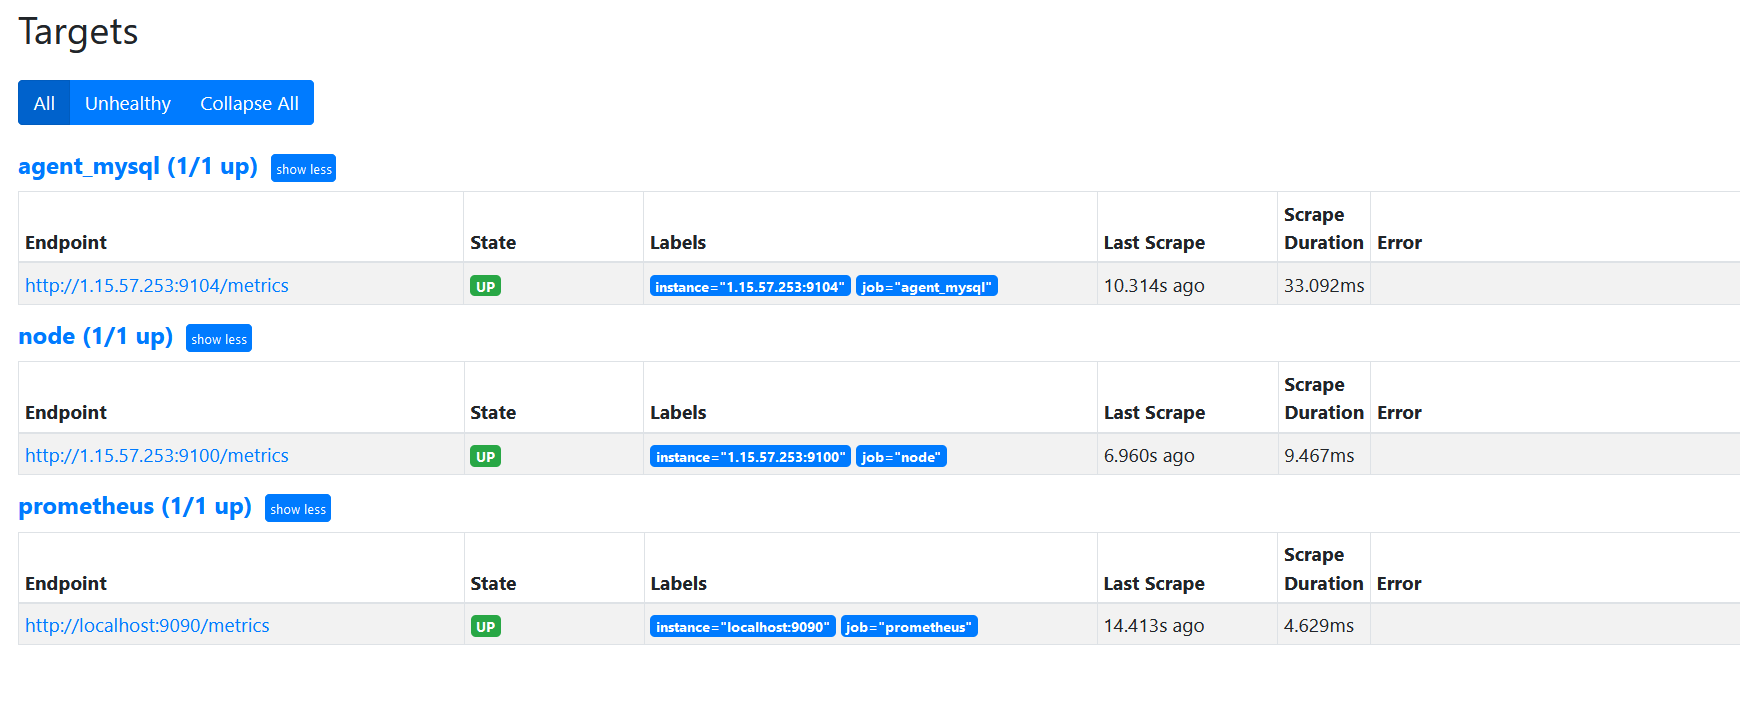
重启prometheus
/usr/local/prometheus/prometheus --config.file="/usr/local/prometheus/prometheus.yml" &回到web管理界面 --》点Status --》点Targets --》可以看到监控mysql了
(4)安装grafana
wget https://dl.grafana.com/enterprise/release/grafana-enterprise-8.2.5-1.x86_64.rpm
sudo yum install grafana-enterprise-8.2.5-1.x86_64.rpm

systemctl start grafana-server
systemctl enable grafana-server

查看是否启动
lsof -i:3000
通过浏览器访问 http:// grafana服务器IP:3000就到了登录界面,使用默认的admin用户,admin密码就可以登陆了
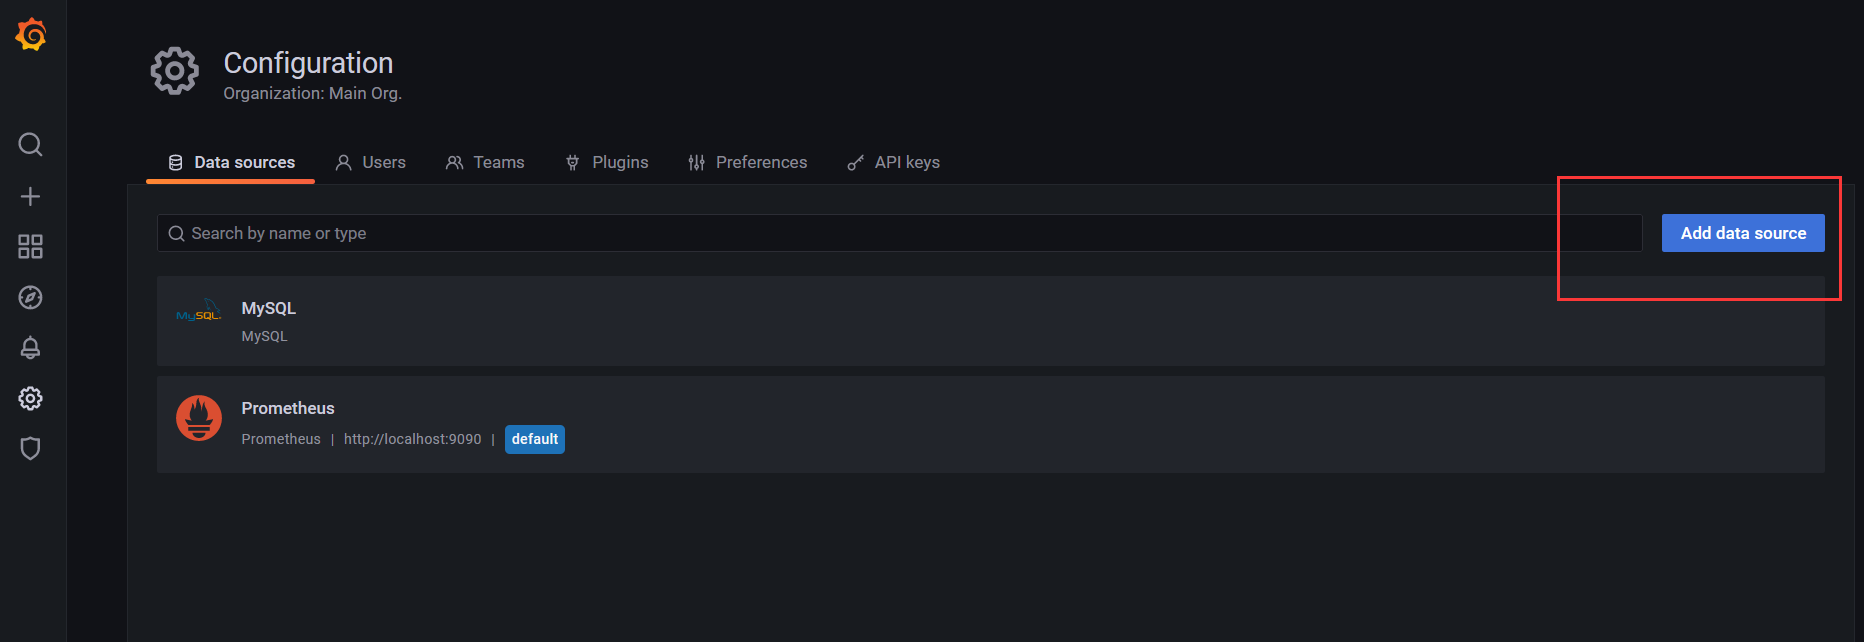
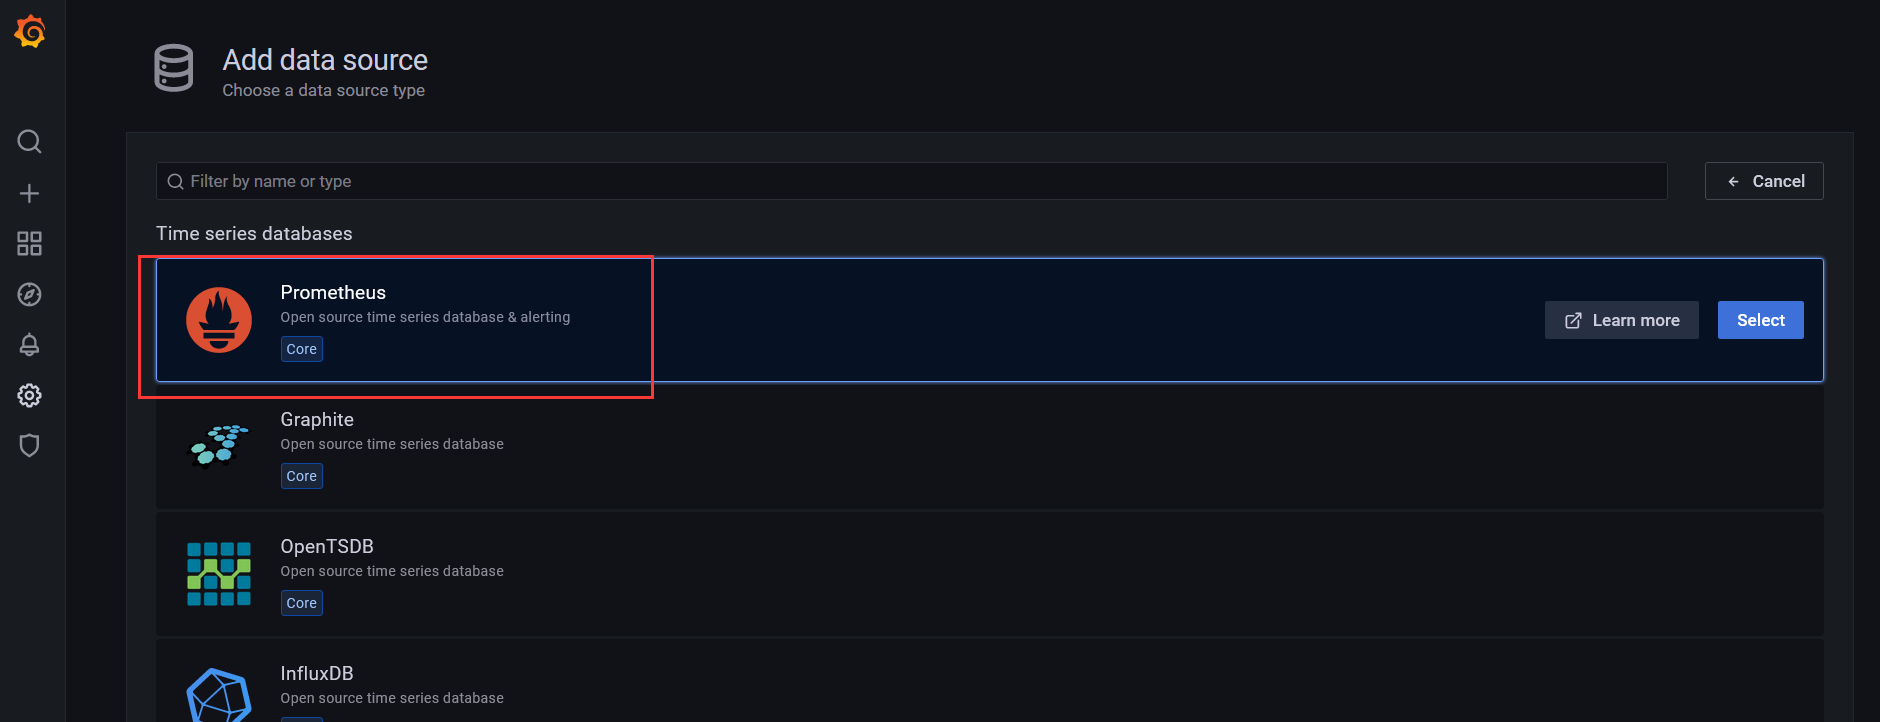
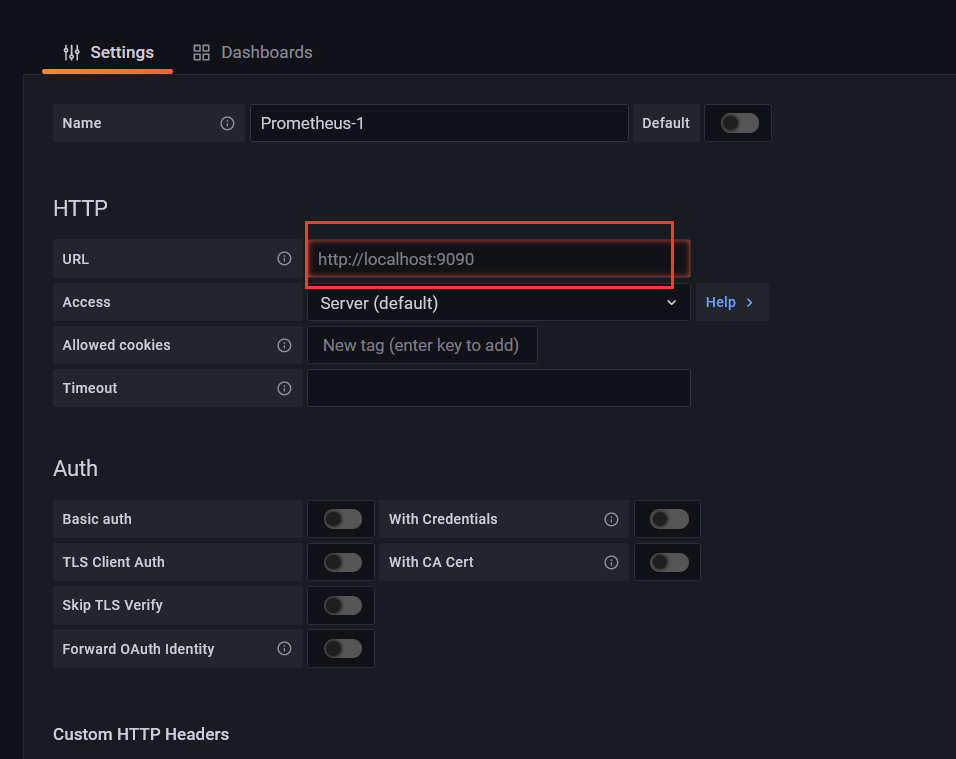
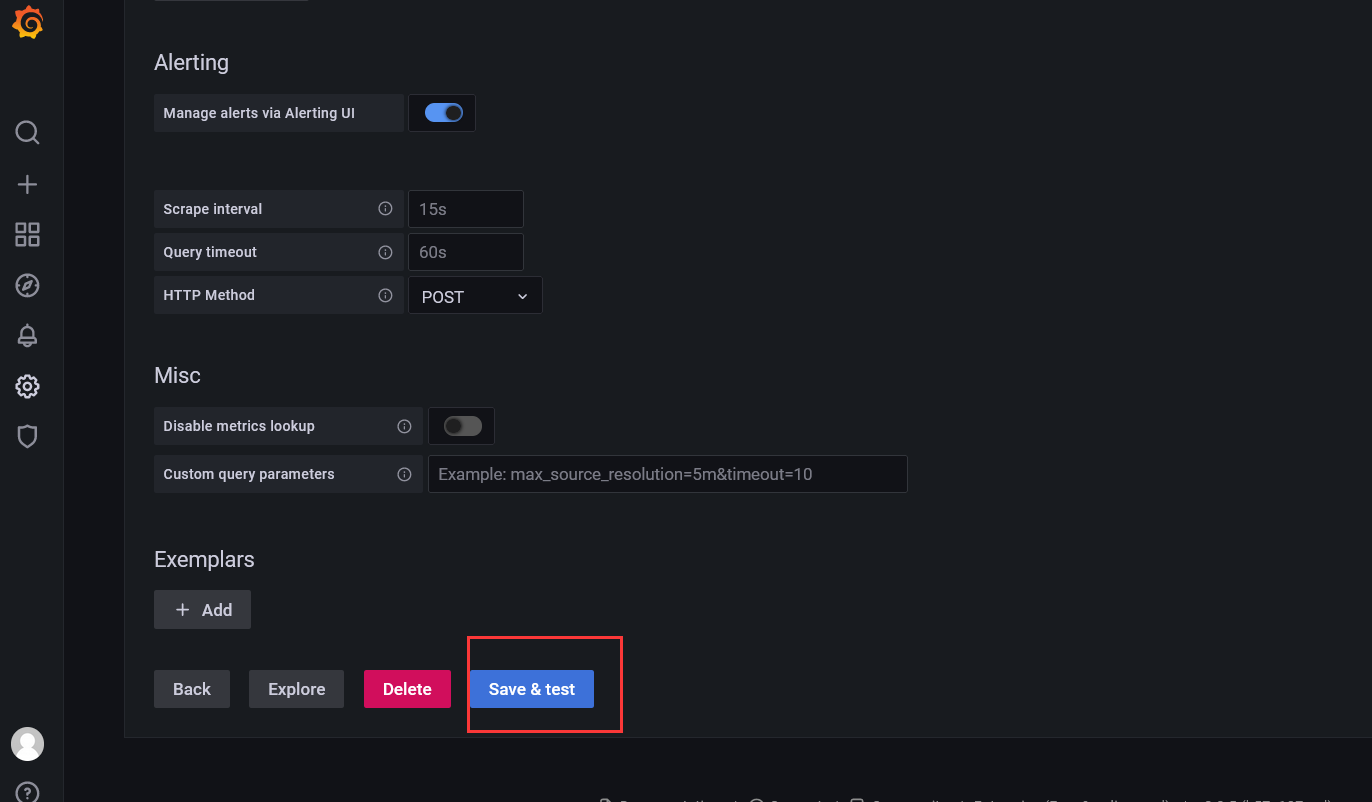
(5)在grafana添加prometheus数据源

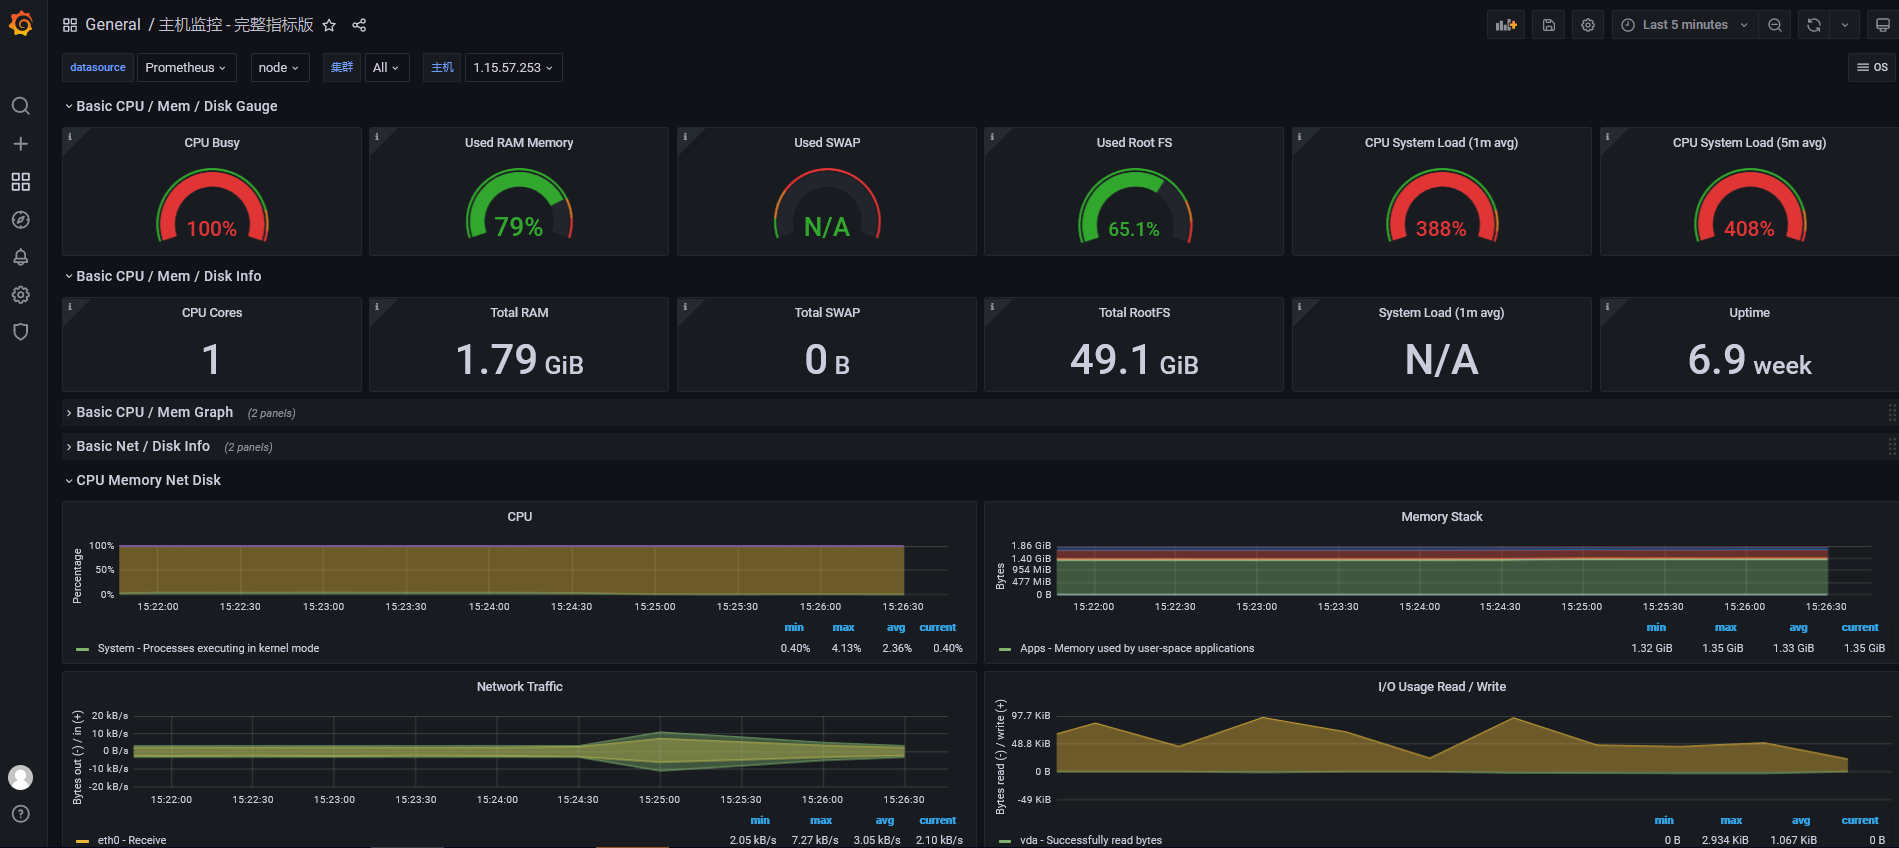
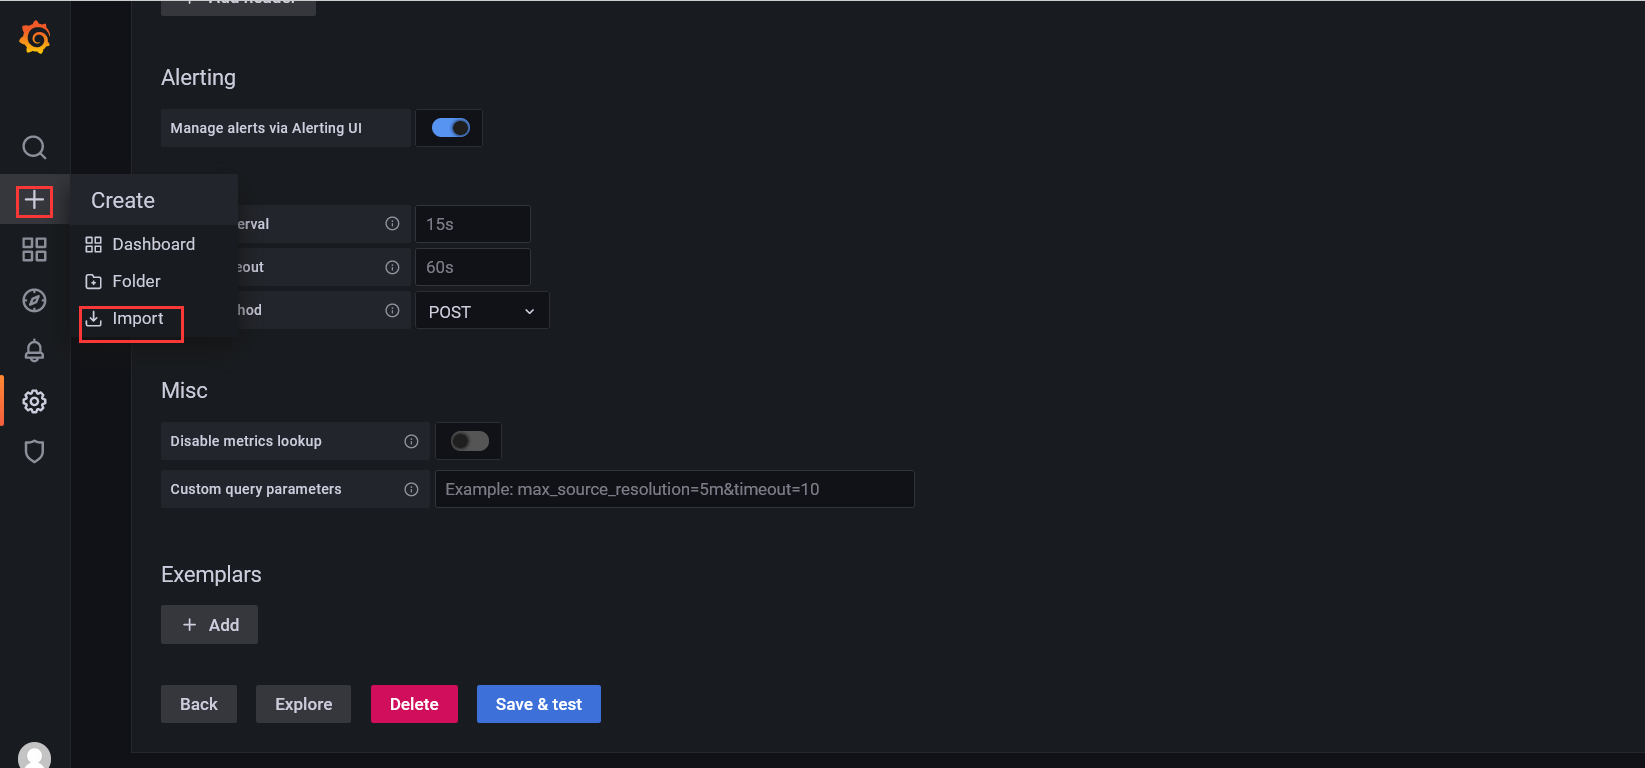
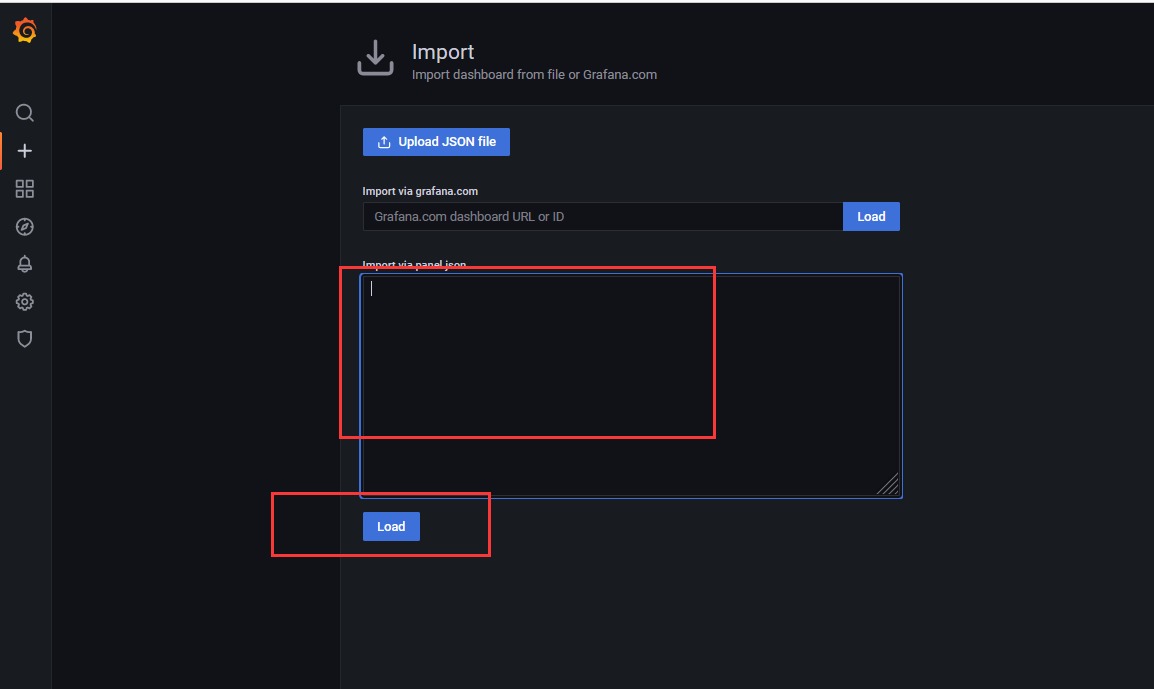
(6)在grafana展示监控数据
配置好数据源之后,分别导入一份主机json模板和一份mysql监控json模板即可
mysql监控
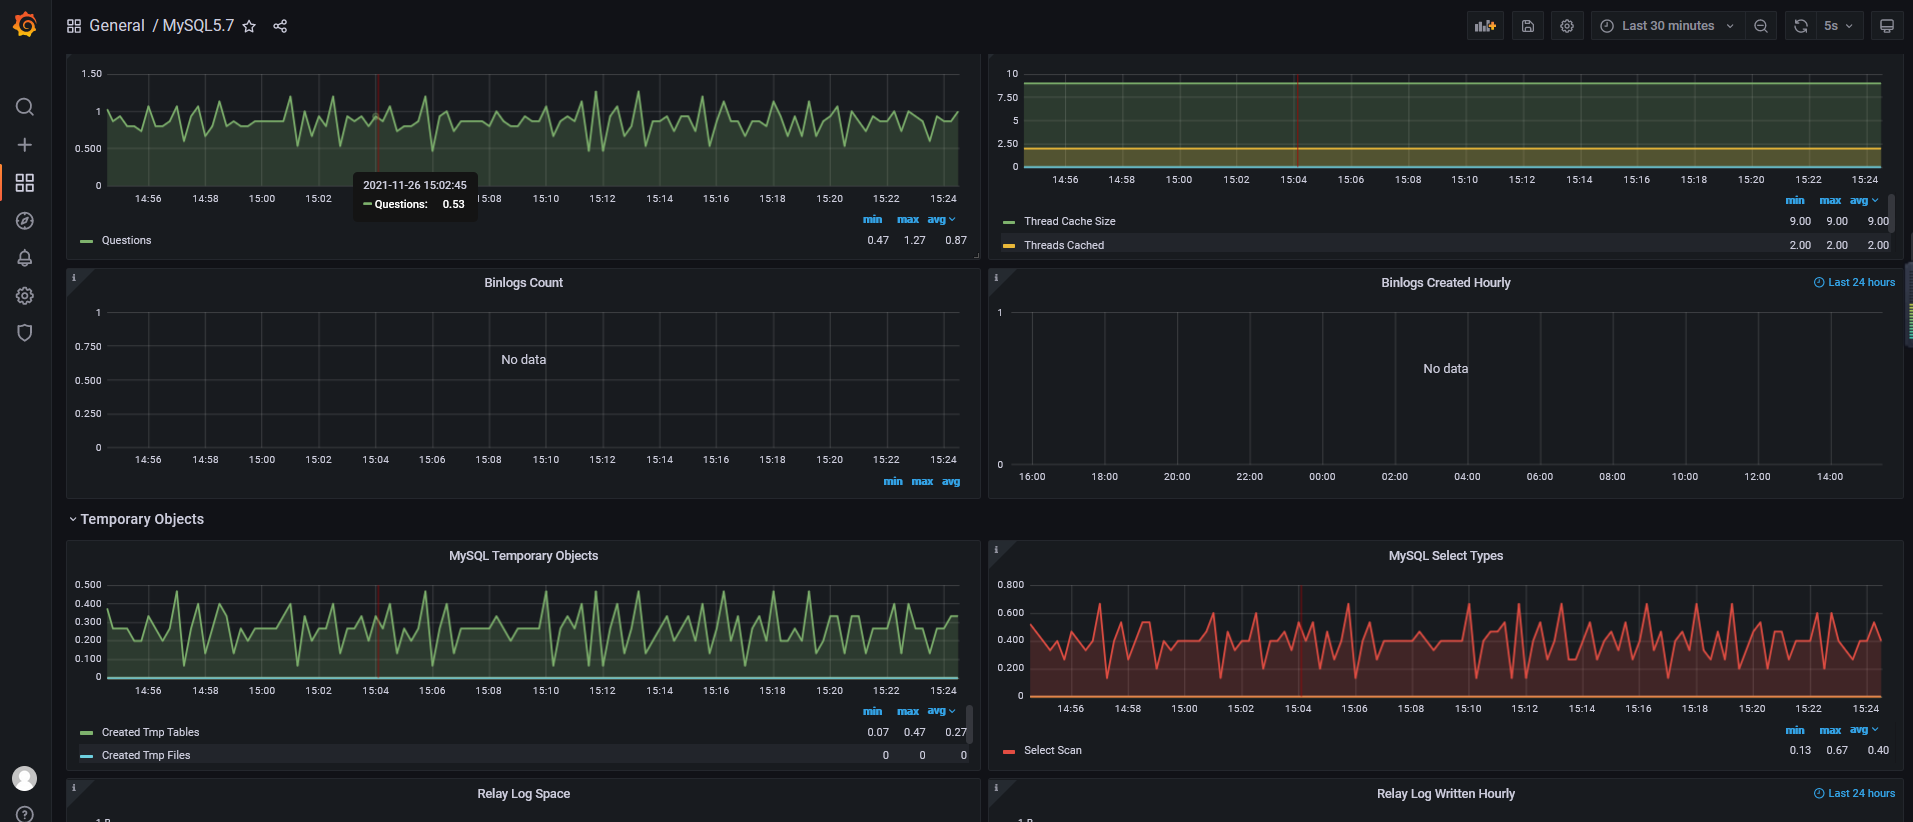
主机监控