



非常感谢宋少华老师在下班时间公益式给予远程并指导解决。
问题描述
现场同事反馈PG数据库无法访问,查看数据库进程发现主进程正常,归档进程失败,如下所示:
root@HKSZF-ZW-172-19-146-150:~# ps -ef | grep postgres
postgres   3076 148745  0 May07 ?        00:00:14 postgres: portal portal 172.19.146.145(46532) idle
postgres  19020 148745 19 May07 ?        5-10:07:08 postgres: portal portal 172.19.146.145(33138) idle
postgres  19049 148745 19 May07 ?        5-13:51:47 postgres: portal portal 172.19.146.145(33208) idle
postgres  20396 148745  0 Mar29 ?        00:01:35 postgres: portal portal 172.19.146.145(40368) idle
postgres  29972 148745  0 Apr23 ?        00:00:19 postgres: zyys zyys 172.19.146.145(42186) idle
postgres  61872 148745 20 Apr29 ?        7-08:28:27 postgres: portal portal 172.19.146.145(59100) idle
postgres  93664 148745 19 May09 ?        5-06:39:42 postgres: portal portal 172.19.146.145(50320) CREATE TABLE
root     131781 131741  0 15:46 pts/0    00:00:00 grep --color=auto postgres
postgres 148745      1  0 Mar04 ?        00:07:30 /topsoft/pgdb/pgsql/bin/postgres -D /topsoft/pgdb/data
postgres 148746 148745  3 Mar04 ?        3-07:08:08 postgres: logger
postgres 148749 148745  0 Mar04 ?        11:33:54 postgres: checkpointer
postgres 148750 148745  0 Mar04 ?        00:22:18 postgres: background writer
postgres 148751 148745  0 Mar04 ?        03:23:14 postgres: walwriter
postgres 148752 148745  0 Mar04 ?        00:41:41 postgres: autovacuum launcher
postgres 148753 148745  0 Mar04 ?        00:03:06 postgres: archiver failed on 00000001000005200000003D
postgres 148754 148745  0 Mar04 ?        01:10:57 postgres: stats collector
postgres 148755 148745  0 Mar04 ?        00:01:09 postgres: logical replication launcher
postgres 149038 148745  0 Mar04 ?        00:01:09 postgres: zyys zyys 172.19.146.145(36976) idle
分析过程
服务器上登录数据库
想着主进程正常,仅仅是归档失败,服务器上登录应该是没问题的,结果登录失败,提示:could not fork new process for connection: Cannot allocate memory。
root@HKSZF-ZW-172-19-146-150:~# su - postgres
postgres@HKSZF-ZW-172-19-146-150:~$ psql
psql: error: connection to server on socket "/tmp/.s.PGSQL.5432" failed: could not fork new process for connection: Cannot allocate memory
postgres@HKSZF-ZW-172-19-146-150:~$
分析服务器负载
按top进行内存从高到低排序,发现内存使用率也不高。
top - 15:49:04 up 127 days,  4:03,  1 user,  load average: 2.22, 2.05, 2.00
Tasks: 369 total,   2 running, 188 sleeping,   0 stopped,   0 zombie
%Cpu(s):  0.4 us,  3.3 sy,  0.0 ni, 96.1 id,  0.1 wa,  0.0 hi,  0.0 si,  0.0 st
KiB Mem : 65940888 total,   497100 free, 47014924 used, 18428864 buff/cache
KiB Swap:  4023292 total,  4015856 free,     7436 used. 15401704 avail Mem

   PID USER      PR  NI    VIRT    RES    SHR S  %CPU %MEM     TIME+ COMMAND
 61872 postgres  20   0 30.019g 0.015t 1.501g S   0.0 23.9  10588:27 postgres
 19020 postgres  20   0 27.109g 0.012t 1.659g S   0.0 19.6   7807:08 postgres
 19049 postgres  20   0 27.304g 0.012t 1.382g R  54.6 19.4   8033:21 postgres
 93664 postgres  20   0 24.960g 9.797g 1.305g D  55.3 15.6   7601:15 postgres
148749 postgres  20   0 16.540g 2.113g 2.051g S   0.7  3.4 693:56.35 postgres
148745 postgres  20   0 16.464g 397016 396412 S   0.0  0.6   7:30.09 postgres
148750 postgres  20   0 16.465g 155000 154396 S   0.0  0.2  22:18.63 postgres
 29972 postgres  20   0 16.468g  84572  81888 S   0.0  0.1   0:19.08 postgres
149038 postgres  20   0 16.467g  75324  73424 S   0.0  0.1   1:09.23 postgres
 20396 postgres  20   0 16.468g  43336  39812 S   0.0  0.1   1:35.37 postgres
  3076 postgres  20   0 16.468g  42488  39204 S   0.0  0.1   0:14.99 postgres
   619 root      19  -1  257000  32352  21480 S   0.3  0.0   4:04.13 systemd-journal
尝试关闭数据库
关库关不掉
postgres@HKSZF-ZW-172-19-146-150:~$ pg_ctl stop -D /topsoft/pgdb/data
waiting for server to shut down............................................................... failed
pg_ctl: server does not shut down
根据网上的办法,将DATA目录下的pid文件进行重命名。
root@HKSZF-ZW-172-19-146-150:/topsoft/pgdb/data# ls -l /topsoft/pgdb/data/postmaster.pid
-rw------- 1 postgres postgres 78 Jun  4 16:38 /topsoft/pgdb/data/postmaster.pid

root@HKSZF-ZW-172-19-146-150:/topsoft/pgdb/data#mv /topsoft/pgdb/data/postmaster.pid /topsoft/pgdb/data/postmaster.pid_bak_20240604
再次进行关库,依然关库失败
postgres@HKSZF-ZW-172-19-146-150:~$ pg_ctl stop -D /topsoft/pgdb/data
waiting for server to shut down............................................................... failed
pg_ctl: server does not shut down
查看数据库日志
发现日志在不停地输出接收连接,和现场沟通停止应用,由于现场同事对环境不熟悉,未停止完,于是手动进行后面的应用停止
2024-06-04 16:19:00.697 CST [133853] FATAL:  the database system is starting up
2024-06-04 16:19:10.844 CST [133859] LOG:  connection received: host=[local]
2024-06-04 16:19:10.844 CST [133859] FATAL:  the database system is starting up
2024-06-04 16:19:30.700 CST [133874] LOG:  connection received: host=172.19.146.145 port=34470
2024-06-04 16:19:30.701 CST [133874] FATAL:  the database system is starting up
2024-06-04 16:20:00.704 CST [133889] LOG:  connection received: host=172.19.146.145 port=34570
2024-06-04 16:20:00.705 CST [133889] FATAL:  the database system is starting up
停止应用
--查看应用进程
root@HKSZF-ZW-172-19-146-145:/topsoft/zhjg/apache-tomcat-9.0.84-topisp-10006/conf# ps -ef | grep java
root       6360      1  0 Jan29 ?        04:20:43 java -Xms4096m -Xmx6100m -server -jar knowledge.jar
root       8147      1  1 Jan29 ?        1-14:02:03 /topsoft/java/jdk1.8.0_291/bin/java -Djava.util.logging.config.file=/topsoft/zhjg/apache-tomcat-9.0.84-topisp-stm-10007/conf/logging.properties -Djava.util.logging.manager=org.apache.juli.ClassLoaderLogManager -server -XX:+UseConcMarkSweepGC -Xms8g -Xmx8g -Xss1024K -XX:MetaspaceSize=1324m -XX:MaxMetaspaceSize=1324m -XX:MaxNewSize=2048m -Dfile.encoding=UTF-8 -Djava.awt.headless=true -Djava.security.egd=file:/dev/./urandom -Dsecurerandom.source=file:/dev/./urandom -Djdk.tls.ephemeralDHKeySize=2048 -Djava.protocol.handler.pkgs=org.apache.catalina.webresources -Dorg.apache.catalina.security.SecurityListener.UMASK=0027 -Dignore.endorsed.dirs= -classpath /topsoft/zhjg/apache-tomcat-9.0.84-topisp-stm-10007/bin/bootstrap.jar:/topsoft/zhjg/apache-tomcat-9.0.84-topisp-stm-10007/bin/tomcat-juli.jar -Dcatalina.base=/topsoft/zhjg/apache-tomcat-9.0.84-topisp-stm-10007 -Dcatalina.home=/topsoft/zhjg/apache-tomcat-9.0.84-topisp-stm-10007 -Djava.io.tmpdir=/topsoft/zhjg/apache-tomcat-9.0.84-topisp-stm-10007/temp org.apache.catalina.startup.Bootstrap start
root      23707      1  0 Feb26 ?        02:00:02 /topsoft/java/jdk1.8.0_291/bin/java -Djava.util.logging.config.file=/topsoft/zhjg/apache-tomcat-9.0.84-topgpsm-10008/conf/logging.properties -Djava.util.logging.manager=org.apache.juli.ClassLoaderLogManager -server -XX:+UseConcMarkSweepGC -Xms8g -Xmx8g -Xss1024K -XX:MetaspaceSize=1324m -XX:MaxMetaspaceSize=1324m -XX:MaxNewSize=2048m -Dfile.encoding=UTF-8 -Djava.awt.headless=true -Djava.security.egd=file:/dev/./urandom -Dsecurerandom.source=file:/dev/./urandom -Djdk.tls.ephemeralDHKeySize=2048 -Djava.protocol.handler.pkgs=org.apache.catalina.webresources -Dorg.apache.catalina.security.SecurityListener.UMASK=0027 -Dignore.endorsed.dirs= -classpath /topsoft/zhjg/apache-tomcat-9.0.84-topgpsm-10008/bin/bootstrap.jar:/topsoft/zhjg/apache-tomcat-9.0.84-topgpsm-10008/bin/tomcat-juli.jar -Dcatalina.base=/topsoft/zhjg/apache-tomcat-9.0.84-topgpsm-10008 -Dcatalina.home=/topsoft/zhjg/apache-tomcat-9.0.84-topgpsm-10008 -Djava.io.tmpdir=/topsoft/zhjg/apache-tomcat-9.0.84-topgpsm-10008/temp org.apache.catalina.startup.Bootstrap start
root      24165      1  0 Feb26 ?        02:06:39 /topsoft/java/jdk1.8.0_291/bin/java -Djava.util.logging.config.file=/topsoft/zhjg/apache-tomcat-9.0.84-topisp-selftm-10009/conf/logging.properties -Djava.util.logging.manager=org.apache.juli.ClassLoaderLogManager -server -XX:+UseConcMarkSweepGC -Xms8g -Xmx8g -Xss1024K -XX:MetaspaceSize=1324m -XX:MaxMetaspaceSize=1324m -XX:MaxNewSize=2048m -Dfile.encoding=UTF-8 -Djava.awt.headless=true -Djava.security.egd=file:/dev/./urandom -Dsecurerandom.source=file:/dev/./urandom -Djdk.tls.ephemeralDHKeySize=2048 -Djava.protocol.handler.pkgs=org.apache.catalina.webresources -Dorg.apache.catalina.security.SecurityListener.UMASK=0027 -Dignore.endorsed.dirs= -classpath /topsoft/zhjg/apache-tomcat-9.0.84-topisp-selftm-10009/bin/bootstrap.jar:/topsoft/zhjg/apache-tomcat-9.0.84-topisp-selftm-10009/bin/tomcat-juli.jar -Dcatalina.base=/topsoft/zhjg/apache-tomcat-9.0.84-topisp-selftm-10009 -Dcatalina.home=/topsoft/zhjg/apache-tomcat-9.0.84-topisp-selftm-10009 -Djava.io.tmpdir=/topsoft/zhjg/apache-tomcat-9.0.84-topisp-selftm-10009/temp org.apache.catalina.startup.Bootstrap start

--停止应用
kill -9 6360
kill -9 8147
kill -9 23707
kill -9 24165
发现停止应用后,日志就停止输出了,没有了输出内容我就开始着急了,参考什么进行分析呢。
屏蔽外部访问
未避免有其他用户访问,更改了postgres.conf中的listern参数 ,更改了pg_hba.conf中的参数
进行了pg_ctl reload操作。
这样做是错误的,库未成功停止的情况下,这些操作反而起反作用。
尝试启动数据库
postgres@HKSZF-ZW-172-19-146-150:~$ pg_ctl start -D /topsoft/pgdb/data
waiting for server to start....2024-06-04 16:07:05.420 CST [132839] LOG:  redirecting log output to logging collector process
2024-06-04 16:07:05.420 CST [132839] HINT:  Future log output will appear in directory "log".
........................................................... stopped waiting
pg_ctl: server did not start in time
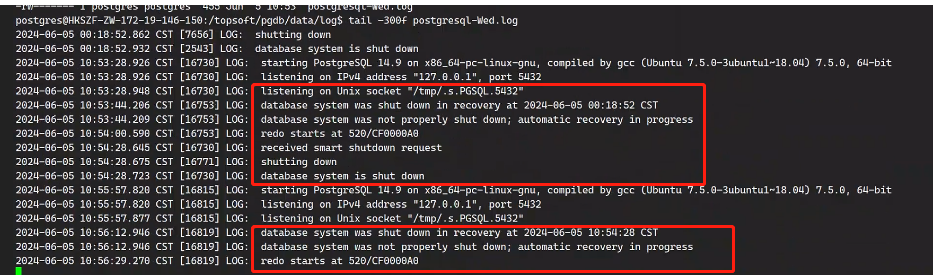
日志输出如下:
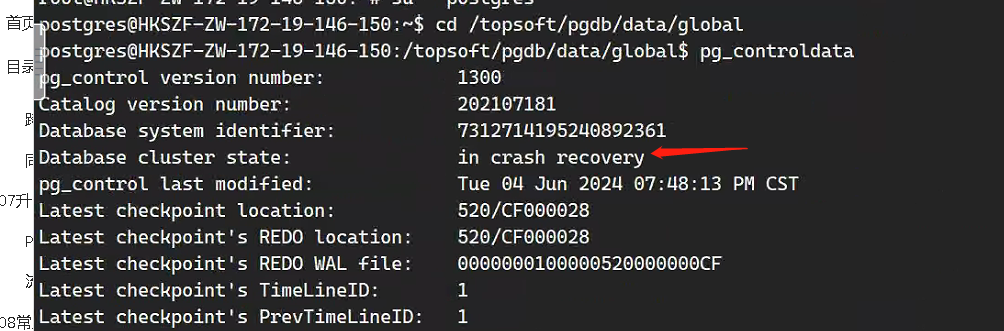
查看控制文件
查看进程

进程现在应该有对应的日志文件,所以显示defunct
查看控制文件信息
postgres@HKSZF-ZW-172-19-146-150:~$ pg_controldata -D /topsoft/pgdb/data/
pg_control version number:            1300
Catalog version number:               202107181
Database system identifier:           7312714195240892361
Database cluster state:               in production
pg_control last modified:             Tue 04 Jun 2024 04:10:56 PM CST
Latest checkpoint location:           520/CF000028
Latest checkpoint's REDO location:    520/CF000028
Latest checkpoint's REDO WAL file:    0000000100000520000000CF
Latest checkpoint's TimeLineID:       1
Latest checkpoint's PrevTimeLineID:   1
Latest checkpoint's full_page_writes: on
Latest checkpoint's NextXID:          0:229578104
Latest checkpoint's NextOID:          3430551289
Latest checkpoint's NextMultiXactId:  1
Latest checkpoint's NextMultiOffset:  0
Latest checkpoint's oldestXID:        42968328
Latest checkpoint's oldestXID's DB:   16385
Latest checkpoint's oldestActiveXID:  0
Latest checkpoint's oldestMultiXid:   1
Latest checkpoint's oldestMulti's DB: 16387
Latest checkpoint's oldestCommitTsXid:0
Latest checkpoint's newestCommitTsXid:0
Time of latest checkpoint:            Tue 04 Jun 2024 04:04:09 PM CST
Fake LSN counter for unlogged rels:   0/3E8
Minimum recovery ending location:     0/0
Min recovery ending loc's timeline:   0
Backup start location:                0/0
Backup end location:                  0/0
End-of-backup record required:        no
wal_level setting:                    replica
wal_log_hints setting:                off
max_connections setting:              1000
max_worker_processes setting:         8
max_wal_senders setting:              10
max_prepared_xacts setting:           500
max_locks_per_xact setting:           64
track_commit_timestamp setting:       off
Maximum data alignment:               8
Database block size:                  8192
Blocks per segment of large relation: 131072
WAL block size:                       8192
Bytes per WAL segment:                16777216
Maximum length of identifiers:        64
Maximum columns in an index:          32
Maximum size of a TOAST chunk:        1996
Size of a large-object chunk:         2048
Date/time type storage:               64-bit integers
Float8 argument passing:              by value
Data page checksum version:           0
Mock authentication nonce:            145757dff69909efc59b760fa10ed73fba1923ca1477f23ef91c115c386b18cc
解决办法
执行停止数据库操作并等待
--停止数据库
postgres@HKSZF-ZW-172-19-146-150:~$ pg_ctl stop -D /topsoft/pgdb/data
waiting for server to shut down............................................................... failed
pg_ctl: server does not shut down
查看日志
日志如此之大是异常的。
root@HKSZF-ZW-172-19-146-150:/topsoft/pgdb/data/log# ls -lhtr
total 358G
-rw------- 1 postgres postgres 3.4G May 30 00:00 postgresql-Wed.log
-rw------- 1 postgres postgres 6.5G May 31 00:00 postgresql-Thu.log
-rw------- 1 postgres postgres  76G Jun  1 00:00 postgresql-Fri.log
-rw------- 1 postgres postgres  78G Jun  2 00:00 postgresql-Sat.log
-rw------- 1 postgres postgres  77G Jun  3 00:00 postgresql-Sun.log
-rw------- 1 postgres postgres  70G Jun  4 00:00 postgresql-Mon.log
-rw------- 1 postgres postgres  48G Jun  4 16:07 postgresql-Tue.log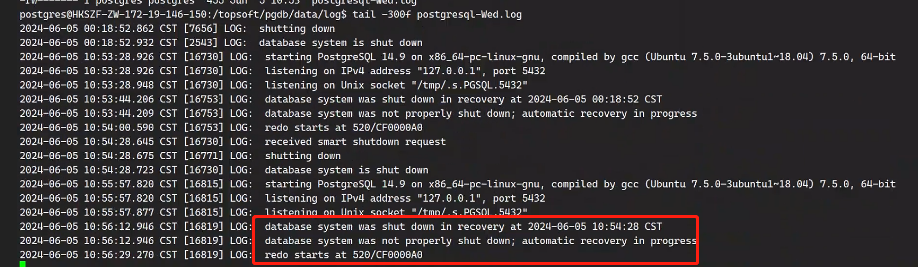
查看进程
postgres@HKSZF-ZW-172-19-146-150:~$ ps -ef | grep postgres
root     131788 131741  0 15:46 pts/0    00:00:00 su - postgres
postgres 131789 131788  0 15:46 pts/0    00:00:00 -su
postgres 133181      1  3 16:13 ?        00:00:15 /topsoft/pgdb/pgsql/bin/postgres -D /topsoft/pgdb/data
postgres 133182 133181  0 16:13 ?        00:00:00 postgres: logger
postgres 133188 133181 24 16:13 ?        00:01:45 postgres: startup
其他什么都不要操作静静的等待,该现象是正在关库的情况。最终从20240605下午17:53到20240606上午00:18关库成功。
root@HKSZF-ZW-172-19-146-150:/topsoft/pgdb/data/log# cat postgresql-Wed.log
2024-06-05 00:18:52.862 CST [7656] LOG:  shutting down
2024-06-05 00:18:52.932 CST [2543] LOG:  database system is shut down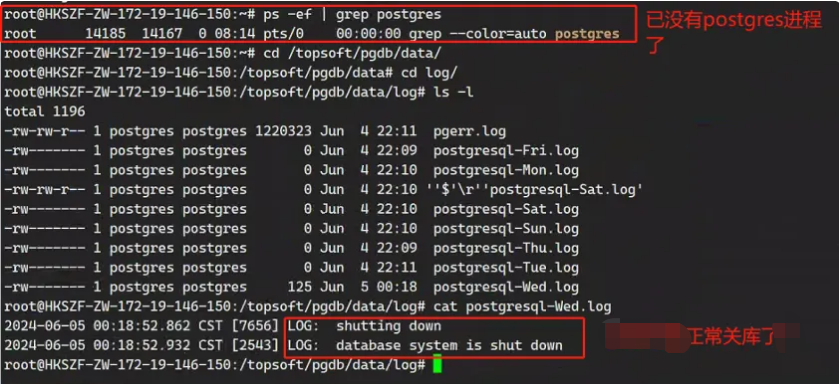
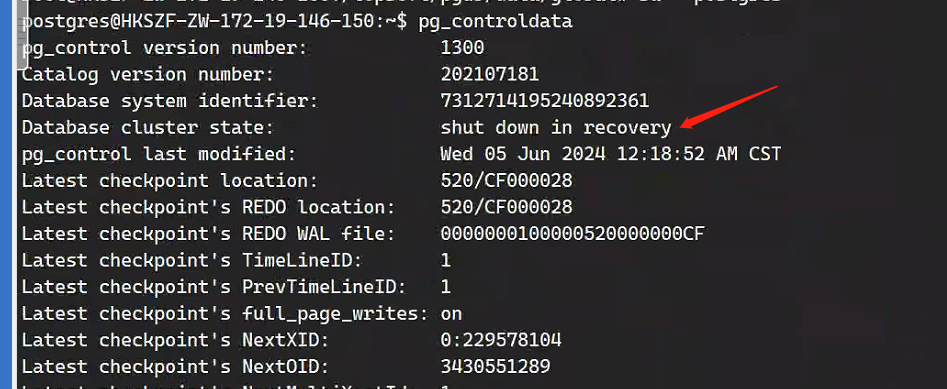
查看控制文件信息
启动数据库
pg_ctl start -D /topsoft/pgdb/data还没有这个恢复状态还是defunct,现在是日志名称且日志都连续了
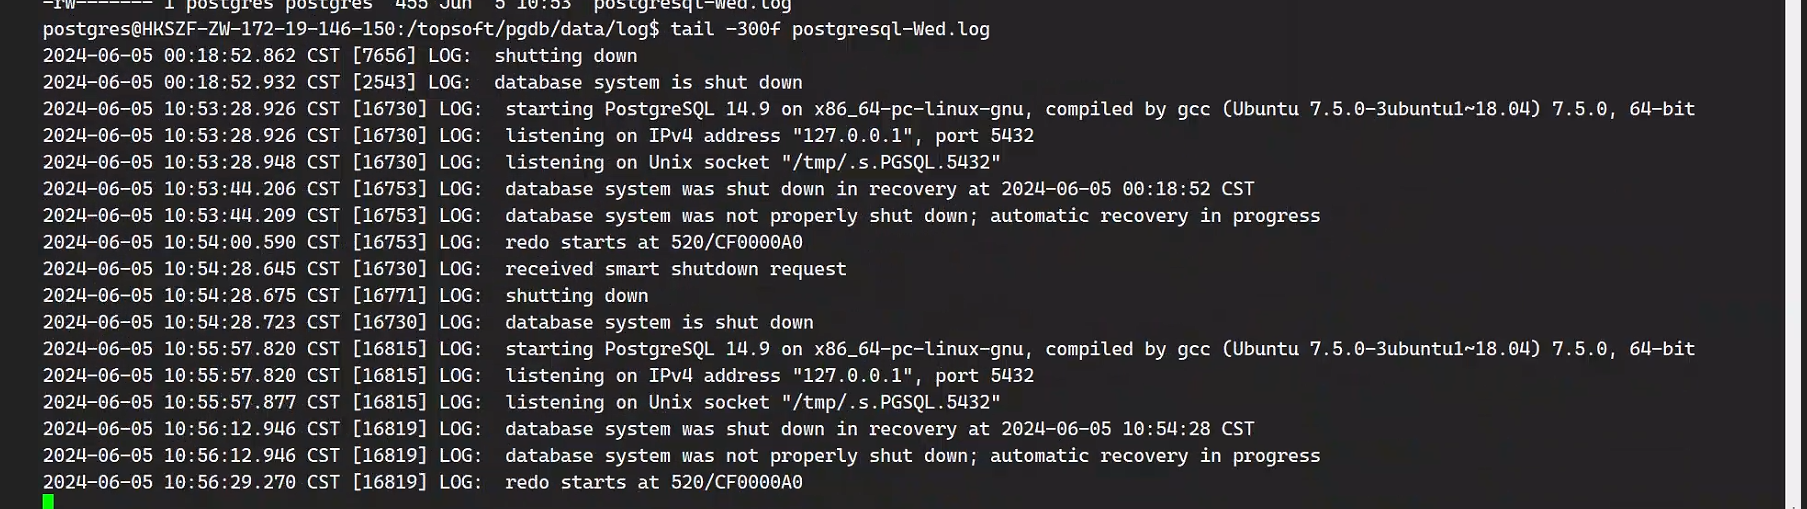

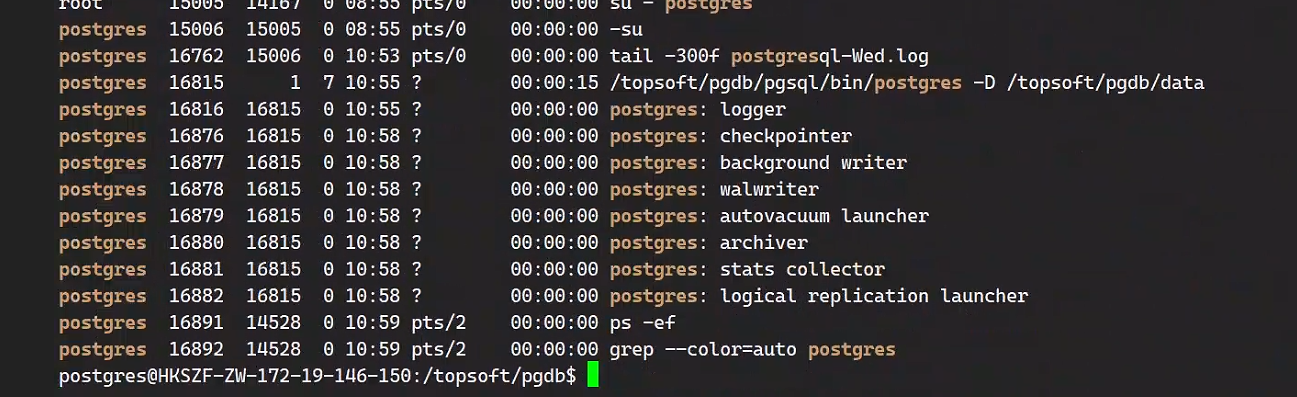
systemctl disable 先禁止对应 PostgreSQL 服务再说,吧启动的权限放到自己手上
总结
遇到库停止不成功的现象,不要着急,不要在非正常运行情况下更改postgres.conf中的listen参数尝试pg_ctl reload,不要删除或者重命名数据目录下的pid文件再次进行停库。
正确的停库步骤:
1、停应用、查进程
2、停库,同时观察数据库日志、进程
即使有如下显示,不要做其他操作继续等待
postgres@HKSZF-ZW-172-19-146-150:~$ pg_ctl start -D /topsoft/pgdb/data
waiting for server to start....2024-06-04 16:07:05.420 CST [132839] LOG:  redirecting log output to logging collector process
2024-06-04 16:07:05.420 CST [132839] HINT:  Future log output will appear in directory "log".
........................................................... stopped waiting
pg_ctl: server did not start in time
进程
postgres@HKSZF-ZW-172-19-146-150:~$ ps -ef | grep postgres
root     131788 131741  0 15:46 pts/0    00:00:00 su - postgres
postgres 131789 131788  0 15:46 pts/0    00:00:00 -su
postgres 133181      1  3 16:13 ?        00:00:15 /topsoft/pgdb/pgsql/bin/postgres -D /topsoft/pgdb/data
postgres 133182 133181  0 16:13 ?        00:00:00 postgres: logger
postgres 133188 133181 24 16:13 ?        00:01:45 postgres: startup
日志
2024-06-04 16:20:00.705 CST [133889] FATAL: the database system is starting up