


概述
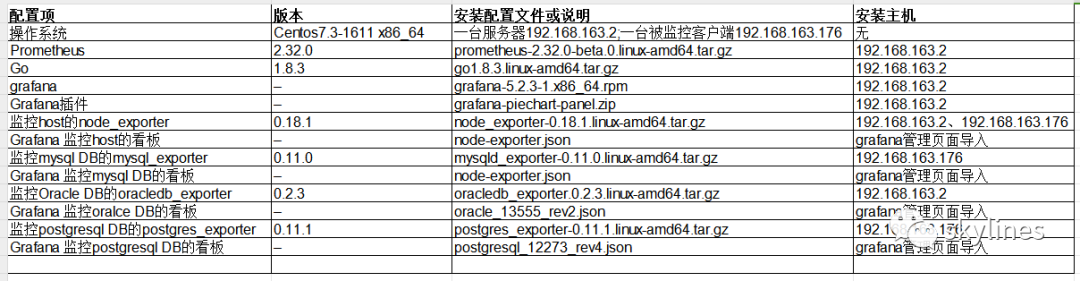
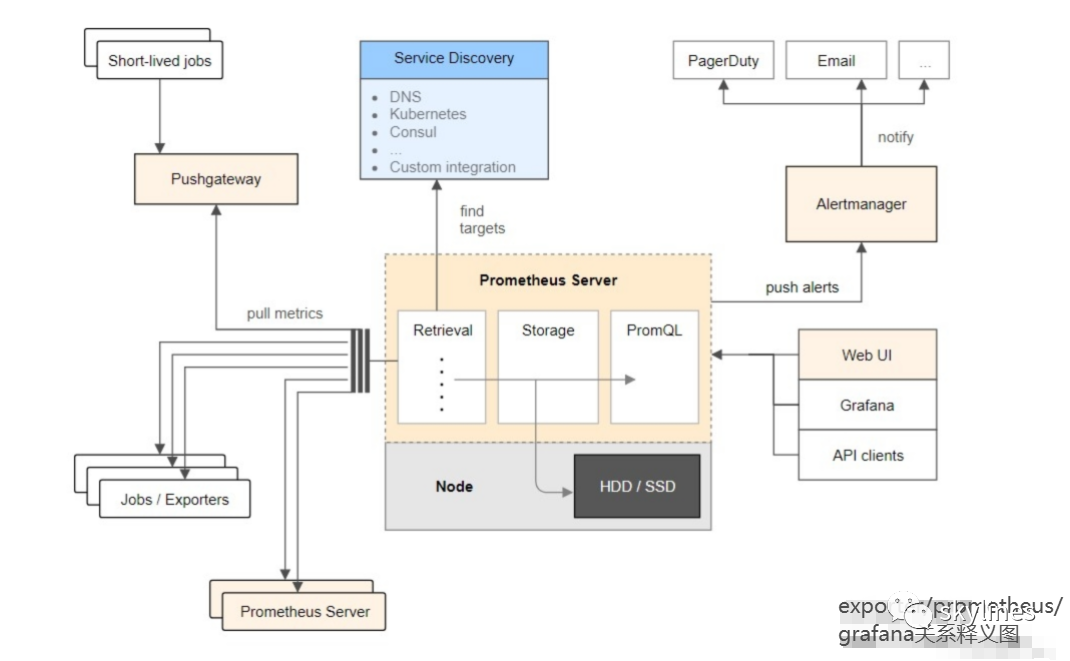
这次使用Prometheus做监控,开始只想着用它来监控host主机资源和MySQL数据库的,后面就是越加越多,加上了监控PostgreSQL数据库和Oracle数据库。由于Promethues+Grafana都是开源的,所以用到的安装包或者配置文件就比较容易得到。Promethues+Grafana可监控多种程序软件,包括网络、操作系统、数据库、中间件、k8s、docker和业务等等,功能十分强大,针对监控不同的软件对象,将采用不同的exporter进行数据采集,以及在Grafana展示监控信息的时候,使用不同看板的json文件进行展示。所用到的材料文件信息见下面列表,以及提供材 料文件的下载地址,方便大家下载使用。

材料信息列表
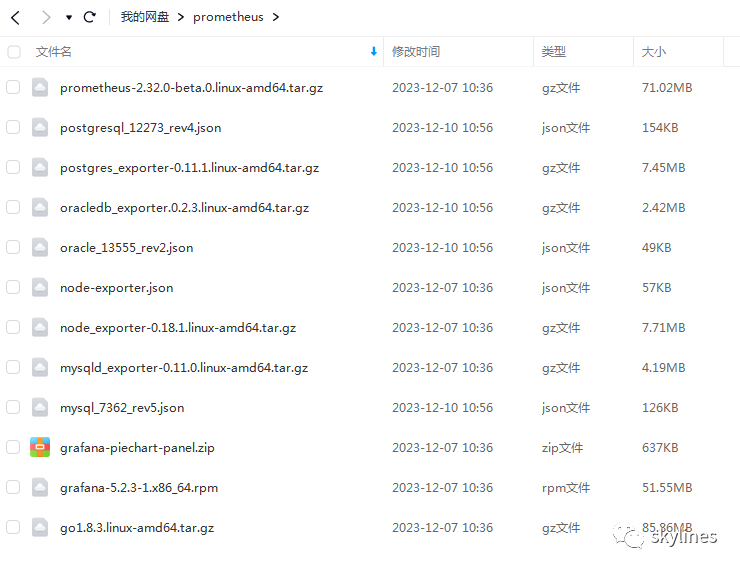
材料下载地址
链接:https://pan.baidu.com/s/1E0V-hv96gXpRh8-YPnswYA
提取码:3lxr
Grafana更多看板json文件下载地址
链接:https://grafana.com/grafana/dashboards/
以下是详细的安装与配置过程。
##监控服务端安装go
--解压安装包[root@susource local]# tar -zxvf go1.8.3.linux-amd64.tar.gzgo/go/AUTHORSgo/CONTRIBUTING.mdgo/CONTRIBUTORSgo/LICENSEgo/PATENTSgo/README.mdgo/VERSIONgo/api/go/api/READMEgo/api/except.txtgo/api/go1.1.txtgo/api/go1.2.txtgo/api/go1.3.txtgo/api/go1.4.txt... ...--编辑go的环境变量vi etc/profileexport PATH=$PATH:/usr/local/go/binsource etc/profile--查看go的版本[root@susource go]# go versiongo version go1.8.3 linux/amd64到此,go已经安装成功
##监控服务端安装prometheus
--解压安装包# tar -zxvf prometheus-2.32.0-beta.0.linux-amd64.tar.gzprometheus-2.32.0-beta.0.linux-amd64/prometheus-2.32.0-beta.0.linux-amd64/consoles/prometheus-2.32.0-beta.0.linux-amd64/consoles/index.html.exampleprometheus-2.32.0-beta.0.linux-amd64/consoles/node-cpu.htmlprometheus-2.32.0-beta.0.linux-amd64/consoles/node-disk.htmlprometheus-2.32.0-beta.0.linux-amd64/consoles/node-overview.htmlprometheus-2.32.0-beta.0.linux-amd64/consoles/node.htmlprometheus-2.32.0-beta.0.linux-amd64/consoles/prometheus-overview.htmlprometheus-2.32.0-beta.0.linux-amd64/consoles/prometheus.htmlprometheus-2.32.0-beta.0.linux-amd64/console_libraries/prometheus-2.32.0-beta.0.linux-amd64/console_libraries/menu.libprometheus-2.32.0-beta.0.linux-amd64/console_libraries/prom.libprometheus-2.32.0-beta.0.linux-amd64/prometheus.ymlprometheus-2.32.0-beta.0.linux-amd64/LICENSEprometheus-2.32.0-beta.0.linux-amd64/NOTICEprometheus-2.32.0-beta.0.linux-amd64/prometheusprometheus-2.32.0-beta.0.linux-amd64/promtool[root@susource local]#--查看安装的版本信息[root@susource local]# cd prometheus/[root@susource prometheus]#[root@susource prometheus]# lsconsole_libraries consoles LICENSE NOTICE prometheus prometheus.yml promtool[root@susource prometheus]# ls -lrttotal 191352-rwxr-xr-x 1 3434 3434 101986796 Nov 16 2021 prometheus-rwxr-xr-x 1 3434 3434 93929760 Nov 16 2021 promtool-rw-r--r-- 1 3434 3434 934 Nov 16 2021 prometheus.yml-rw-r--r-- 1 3434 3434 3646 Nov 16 2021 NOTICE-rw-r--r-- 1 3434 3434 11357 Nov 16 2021 LICENSEdrwxr-xr-x 2 3434 3434 173 Nov 16 2021 consolesdrwxr-xr-x 2 3434 3434 38 Nov 16 2021 console_libraries[root@susource prometheus]#[root@susource prometheus]#[root@susource prometheus]# ./prometheus --versionprometheus, version 2.32.0-beta.0 (branch: HEAD, revision: c32725ba7873dbaa39c223410043430ffa5a26c0)build user: root@da630543d231build date: 20211116-11:23:14go version: go1.17.3platform: linux/amd64[root@susource prometheus]#--给prometheus配置启停服务vim prometheus.service# 添加如下内容[Unit]Description=https://prometheus.io[Service]Restart=on-failureExecStart=/usr/local/prometheus/prometheus --config.file=/usr/local/prometheus/prometheus.yml[Install]WantedBy=multi-user.target
##监控服务端安装grafana
--使用rpm方式安装grafana[root@susource prometheus]# lsgrafana-5.2.3-1.x86_64.rpm[root@susource prometheus]# ls -lrttotal 52792-rw-r--r-- 1 root root 54057234 Dec 6 19:09 grafana-5.2.3-1.x86_64.rpm[root@susource prometheus]# yum -y install grafana-5.2.3-1.x86_64.rpmLoaded plugins: fastestmirror, langpacksRepodata is over 2 weeks old. Install yum-cron? Or run: yum makecache fastExamining grafana-5.2.3-1.x86_64.rpm: grafana-5.2.3-1.x86_64Marking grafana-5.2.3-1.x86_64.rpm to be installedResolving Dependencies--> Running transaction check---> Package grafana.x86_64 0:5.2.3-1 will be installed--> Finished Dependency Resolutionc7-media | 3.6 kB 00:00:00Dependencies Resolved============================================================================================================================================================================================================================================Package Arch Version Repository Size============================================================================================================================================================================================================================================Installing:grafana x86_64 5.2.3-1 grafana-5.2.3-1.x86_64 158 MTransaction Summary============================================================================================================================================================================================================================================Install 1 PackageTotal size: 158 MInstalled size: 158 MDownloading packages:Running transaction checkRunning transaction testTransaction test succeededRunning transactionInstalling : grafana-5.2.3-1.x86_64 1/1### NOT starting on installation, please execute the following statements to configure grafana to start automatically using systemdsudo bin/systemctl daemon-reloadsudo bin/systemctl enable grafana-server.service### You can start grafana-server by executingsudo bin/systemctl start grafana-server.servicePOSTTRANS: Running scriptVerifying : grafana-5.2.3-1.x86_64 1/1Installed:grafana.x86_64 0:5.2.3-1Complete![root@susource prometheus]#--把grafana加入系统服务,并将服务启动[root@susource prometheus]# sbin/chkconfig --add grafana-server[root@susource prometheus]# service grafana-server startStarting grafana-server (via systemctl): [ OK ][root@susource prometheus]#[root@susource prometheus]# ps -ef |grep grafanagrafana 9955 1 1 20:03 ? 00:00:00 usr/sbin/grafana-server --config=/etc/grafana/grafana.ini --pidfile=/var/run/grafana/grafana-server.pid cfg:default.paths.logs=/var/log/grafana cfg:default.paths.data=/var/lib/grafana cfg:default.paths.plugins=/var/lib/grafana/plugins cfg:default.paths.provisioning=/etc/grafana/provisioningroot 9989 7808 0 20:04 pts/0 00:00:00 grep --color=auto grafana[root@susource prometheus]#
##安装grafana服务的piechart插件
--直接把piechart插件的zip包放到/var/lib/grafana/目录解压[root@susource prometheus]# cd var/lib/grafana/[root@susource grafana]# lsgrafana.db plugins[root@susource grafana]# cd plugins/[root@susource plugins]#[root@susource plugins]# ls[root@susource plugins]# rzrz waiting to receive.zmodem trl+C ȡ100% 637 KB 637 KB/s 00:00:01 0 Errors.zip...[root@susource plugins]# ls -lrttotal 640-rw-r--r-- 1 root root 652481 Dec 6 19:08 grafana-piechart-panel.zip[root@susource plugins]# unzip grafana-piechart-panel.zipArchive: grafana-piechart-panel.zip5f249d5bc95050865f32e5cb1f6f265f3198adbccreating: grafana-piechart-panel-5f249d5/inflating: grafana-piechart-panel-5f249d5/.gitignoreinflating: grafana-piechart-panel-5f249d5/Gruntfile.jsinflating: grafana-piechart-panel-5f249d5/LICENSEinflating: grafana-piechart-panel-5f249d5/README.mdcreating: grafana-piechart-panel-5f249d5/dist/inflating: grafana-piechart-panel-5f249d5/dist/README.mdcreating: grafana-piechart-panel-5f249d5/dist/css/inflating: grafana-piechart-panel-5f249d5/dist/css/piechart.dark.cssinflating: grafana-piechart-panel-5f249d5/dist/css/piechart.light.cssinflating: grafana-piechart-panel-5f249d5/dist/editor.htmlcreating: grafana-piechart-panel-5f249d5/dist/img/inflating: grafana-piechart-panel-5f249d5/dist/img/piechart-donut.pnginflating: grafana-piechart-panel-5f249d5/dist/img/piechart-legend-on-graph.pnginflating: grafana-piechart-panel-5f249d5/dist/img/piechart-legend-rhs.pnginflating: grafana-piechart-panel-5f249d5/dist/img/piechart-legend-under.pnginflating: grafana-piechart-panel-5f249d5/dist/img/piechart-options.pngextracting: grafana-piechart-panel-5f249d5/dist/img/piechart_logo_large.pngextracting: grafana-piechart-panel-5f249d5/dist/img/piechart_logo_small.pnginflating: grafana-piechart-panel-5f249d5/dist/legend.jsinflating: grafana-piechart-panel-5f249d5/dist/legend.js.mapcreating: grafana-piechart-panel-5f249d5/dist/lib/inflating: grafana-piechart-panel-5f249d5/dist/lib/perfect-scrollbar.min.jsinflating: grafana-piechart-panel-5f249d5/dist/module.htmlinflating: grafana-piechart-panel-5f249d5/dist/module.jsinflating: grafana-piechart-panel-5f249d5/dist/module.js.mapinflating: grafana-piechart-panel-5f249d5/dist/piechart_ctrl.jsinflating: grafana-piechart-panel-5f249d5/dist/piechart_ctrl.js.mapinflating: grafana-piechart-panel-5f249d5/dist/plugin.jsoninflating: grafana-piechart-panel-5f249d5/dist/rendering.jsinflating: grafana-piechart-panel-5f249d5/dist/rendering.js.mapcreating: grafana-piechart-panel-5f249d5/dist/src/creating: grafana-piechart-panel-5f249d5/dist/src/img/inflating: grafana-piechart-panel-5f249d5/dist/src/img/piechart-donut.pnginflating: grafana-piechart-panel-5f249d5/dist/src/img/piechart-legend-on-graph.pnginflating: grafana-piechart-panel-5f249d5/dist/src/img/piechart-legend-rhs.pnginflating: grafana-piechart-panel-5f249d5/dist/src/img/piechart-legend-under.pnginflating: grafana-piechart-panel-5f249d5/dist/src/img/piechart-options.pngextracting: grafana-piechart-panel-5f249d5/dist/src/img/piechart_logo_large.pngextracting: grafana-piechart-panel-5f249d5/dist/src/img/piechart_logo_small.pnginflating: grafana-piechart-panel-5f249d5/package.jsoncreating: grafana-piechart-panel-5f249d5/src/creating: grafana-piechart-panel-5f249d5/src/css/inflating: grafana-piechart-panel-5f249d5/src/css/piechart.dark.cssinflating: grafana-piechart-panel-5f249d5/src/css/piechart.light.cssinflating: grafana-piechart-panel-5f249d5/src/editor.htmlcreating: grafana-piechart-panel-5f249d5/src/img/inflating: grafana-piechart-panel-5f249d5/src/img/piechart-donut.pnginflating: grafana-piechart-panel-5f249d5/src/img/piechart-legend-on-graph.pnginflating: grafana-piechart-panel-5f249d5/src/img/piechart-legend-rhs.pnginflating: grafana-piechart-panel-5f249d5/src/img/piechart-legend-under.pnginflating: grafana-piechart-panel-5f249d5/src/img/piechart-options.pngextracting: grafana-piechart-panel-5f249d5/src/img/piechart_logo_large.pngextracting: grafana-piechart-panel-5f249d5/src/img/piechart_logo_small.pnginflating: grafana-piechart-panel-5f249d5/src/legend.jscreating: grafana-piechart-panel-5f249d5/src/lib/inflating: grafana-piechart-panel-5f249d5/src/lib/perfect-scrollbar.min.jsinflating: grafana-piechart-panel-5f249d5/src/module.htmlinflating: grafana-piechart-panel-5f249d5/src/module.jsinflating: grafana-piechart-panel-5f249d5/src/piechart_ctrl.jsinflating: grafana-piechart-panel-5f249d5/src/plugin.jsoninflating: grafana-piechart-panel-5f249d5/src/rendering.js[root@susource plugins]#--启动grafana服务[root@susource plugins]# service grafana-server restartRestarting grafana-server (via systemctl): [ OK ]
##被监控端安装node_exporter(本次在192.168.163.2/176两台安装)
--解压node_exporter安装包[root@susource local]# tar -zxvf node_exporter-0.18.1.linux-amd64.tar.gznode_exporter-0.18.1.linux-amd64/node_exporter-0.18.1.linux-amd64/node_exporternode_exporter-0.18.1.linux-amd64/NOTICEnode_exporter-0.18.1.linux-amd64/LICENSE[root@susource local]#--启动node_exporter[root@susource local]# cd node_exporter-0.18.1.linux-amd64/[root@susource node_exporter-0.18.1.linux-amd64]#[root@susource node_exporter-0.18.1.linux-amd64]# lsLICENSE node_exporter NOTICE[root@susource node_exporter-0.18.1.linux-amd64]# ./node_exporter &[1] 8458[root@susource node_exporter-0.18.1.linux-amd64]# INFO[0000] Starting node_exporter (version=0.18.1, branch=HEAD, revision=3db77732e925c08f675d7404a8c46466b2ece83e) source="node_exporter.go:156"INFO[0000] Build context (go=go1.12.5, user=root@b50852a1acba, date=20190604-16:41:18) source="node_exporter.go:157"INFO[0000] Enabled collectors: source="node_exporter.go:97"INFO[0000] - arp source="node_exporter.go:104"INFO[0000] - bcache source="node_exporter.go:104"INFO[0000] - bonding source="node_exporter.go:104"INFO[0000] - conntrack source="node_exporter.go:104"INFO[0000] - cpu source="node_exporter.go:104"INFO[0000] - cpufreq source="node_exporter.go:104"INFO[0000] - diskstats source="node_exporter.go:104"INFO[0000] - edac source="node_exporter.go:104"INFO[0000] - entropy source="node_exporter.go:104"INFO[0000] - filefd source="node_exporter.go:104"INFO[0000] - filesystem source="node_exporter.go:104"INFO[0000] - hwmon source="node_exporter.go:104"INFO[0000] - infiniband source="node_exporter.go:104"INFO[0000] - ipvs source="node_exporter.go:104"INFO[0000] - loadavg source="node_exporter.go:104"INFO[0000] - mdadm source="node_exporter.go:104"INFO[0000] - meminfo source="node_exporter.go:104"INFO[0000] - netclass source="node_exporter.go:104"INFO[0000] - netdev source="node_exporter.go:104"INFO[0000] - netstat source="node_exporter.go:104"INFO[0000] - nfs source="node_exporter.go:104"INFO[0000] - nfsd source="node_exporter.go:104"INFO[0000] - pressure source="node_exporter.go:104"INFO[0000] - sockstat source="node_exporter.go:104"INFO[0000] - stat source="node_exporter.go:104"INFO[0000] - textfile source="node_exporter.go:104"INFO[0000] - time source="node_exporter.go:104"INFO[0000] - timex source="node_exporter.go:104"INFO[0000] - uname source="node_exporter.go:104"INFO[0000] - vmstat source="node_exporter.go:104"INFO[0000] - xfs source="node_exporter.go:104"INFO[0000] - zfs source="node_exporter.go:104"INFO[0000] Listening on :9100 source="node_exporter.go:170"[root@susource node_exporter-0.18.1.linux-amd64]#--配置node_exporter的启停服务cd etc/systemd/systemvi node_exporter.service[Unit]Description=Prometheus node_exporterAfter=network.target[Service]Type=simpleExecStart=/usr/local/node_exporter-0.18.1.linux-amd64[Install]WantedBy=multi-user.target
##在prometheus的配置文件prometheus.yml添加监控节点连接信息
--编辑prometheus.yml配置文件cd usr/local/prometheusvi prometheus.yml# my global configglobal:scrape_interval: 15s # Set the scrape interval to every 15 seconds. Default is every 1 minute.evaluation_interval: 15s # Evaluate rules every 15 seconds. The default is every 1 minute.# scrape_timeout is set to the global default (10s).# Alertmanager configurationalerting:alertmanagers:- static_configs:- targets:# - alertmanager:9093# Load rules once and periodically evaluate them according to the global 'evaluation_interval'.rule_files:# - "first_rules.yml"# - "second_rules.yml"# A scrape configuration containing exactly one endpoint to scrape:# Here it's Prometheus itself.scrape_configs:# The job name is added as a label `job=<job_name>` to any timeseries scraped from this config.- job_name: "prometheus"# metrics_path defaults to '/metrics'# scheme defaults to 'http'.static_configs:- targets: ["localhost:9090"]- job_name: "176_mysql8_host"static_configs:- targets: ["192.168.163.176:9100"]- job_name: "2_oracle11.2.0.4"static_configs:- targets: ["192.168.163.2:9100"]- job_name: "176_mysql8_database"static_configs:- targets: ["192.168.163.176:9104"]- job_name: "2_oracle_mysource"static_configs:- targets: ["192.168.163.2:9161"]labels:instance: '192.168.163.2'tags: 'oracle_mysource'- job_name: "176_postgresdb"static_configs:- targets: ["192.168.163.176:9187"]labels:instance: '192.168.163.176'tags: 'my_postgresql'[root@susource prometheus]#
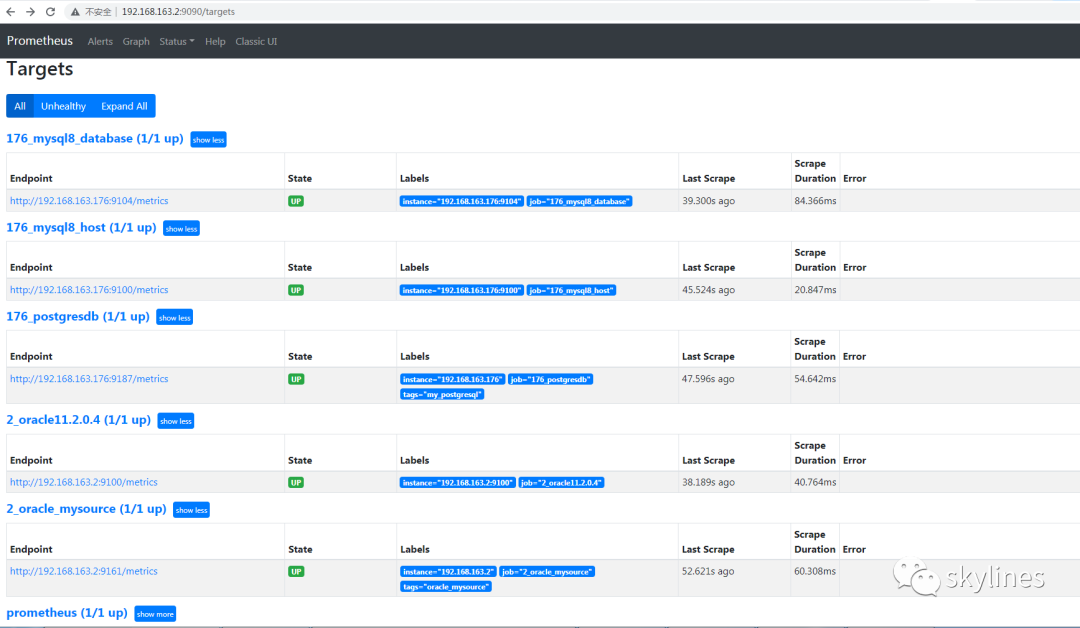
如上的job_name: "176_mysql8_host"与job_name: "2_oracle11.2.0.4"就是监控192.168.163.176/2这两台主机的连接信息。
node_exporter采集到的监控信息,通过固有的网络端口暴露给prometheus,让其捕获并存储,后期作为grafana的数据源,通过grafana展示出来。
##prometheus捕获的targets列表信息与状态
查看对应target的metrics信息
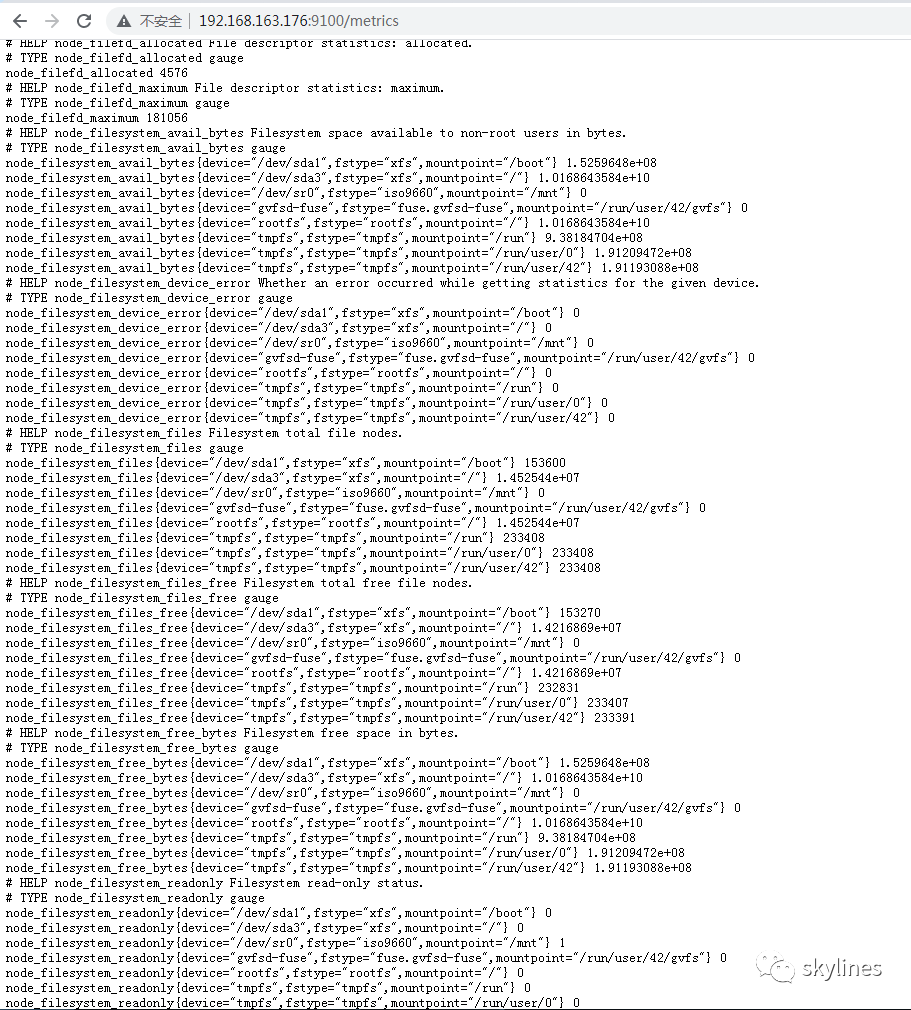
这部分就是采集主机资源的metrics内容。
##使用grafana
浏览器打开http://192.168.163.2:3000 (IP地址为服务器IP)默认密码admin/admin,进入后修改密码.
##连接prometheus到grafana
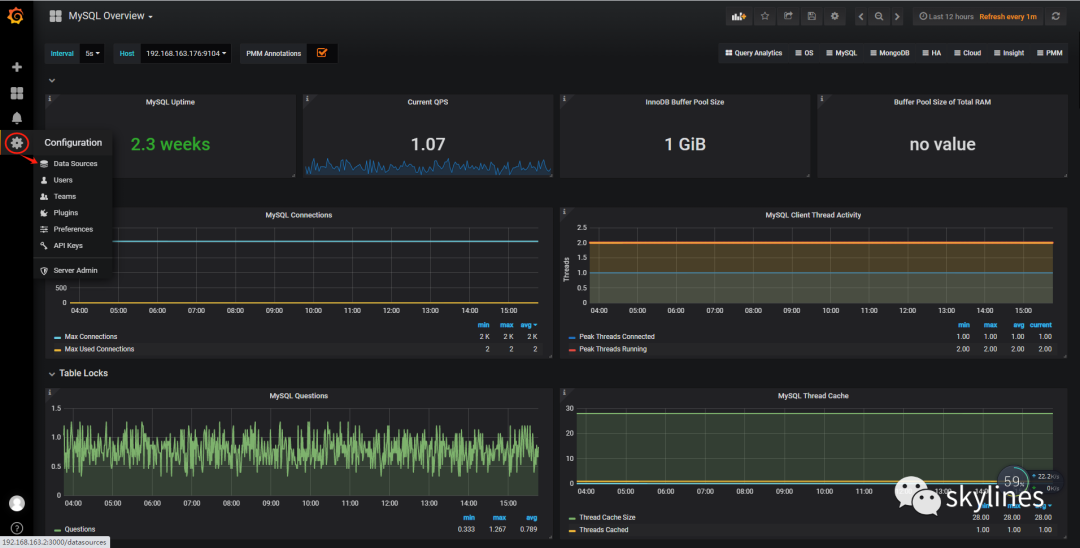
1、点击配置,添加数据源
2、添加prometheus数据源
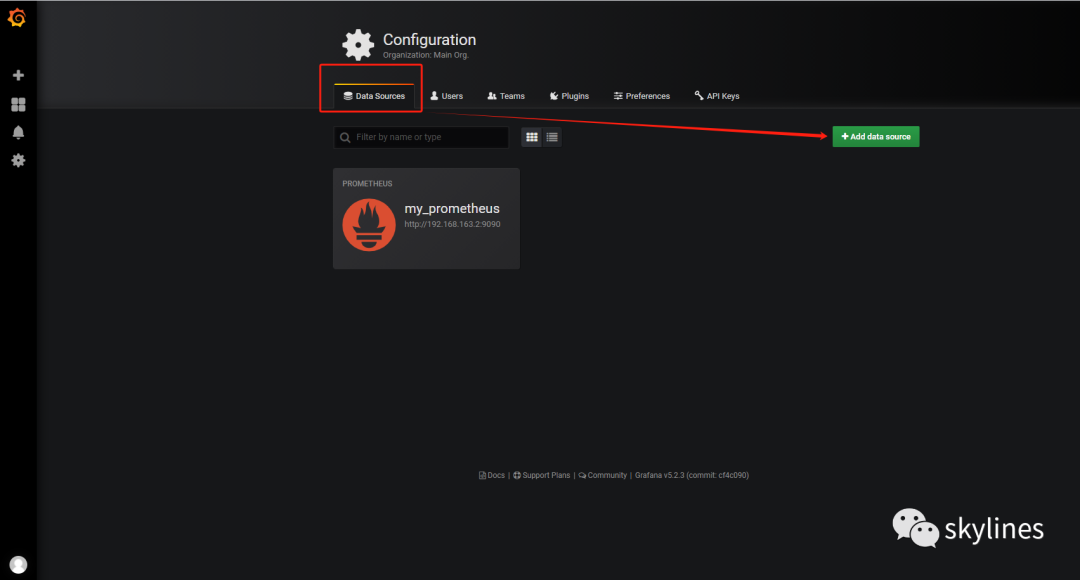
如图所示的my_prometheus是我已经添加的数据源。
3、填写数据源的配置信息
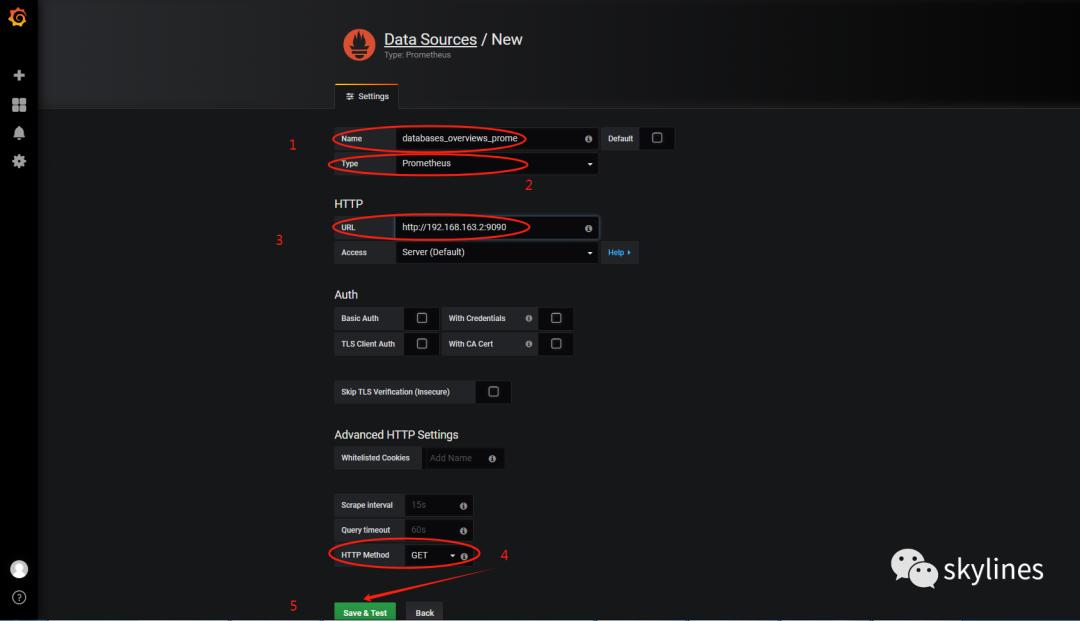
如上,可以自行命名数据源、选择数据源的类型(有prometheus/postgresql/mysql等多种类型)、填写数据源的URL(prometheus部署的服务器的IP和端口,默认端口为9090)、选择http method为“GET”,然后保存。
##grafana导入看盘的图表node-exporter.json
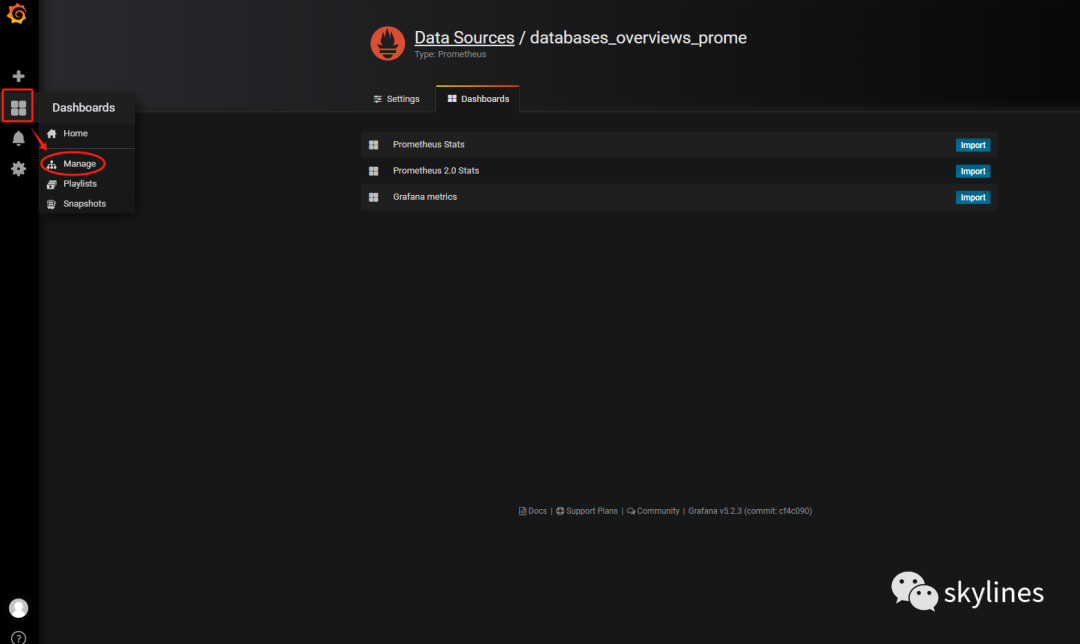
1、点解看板管理
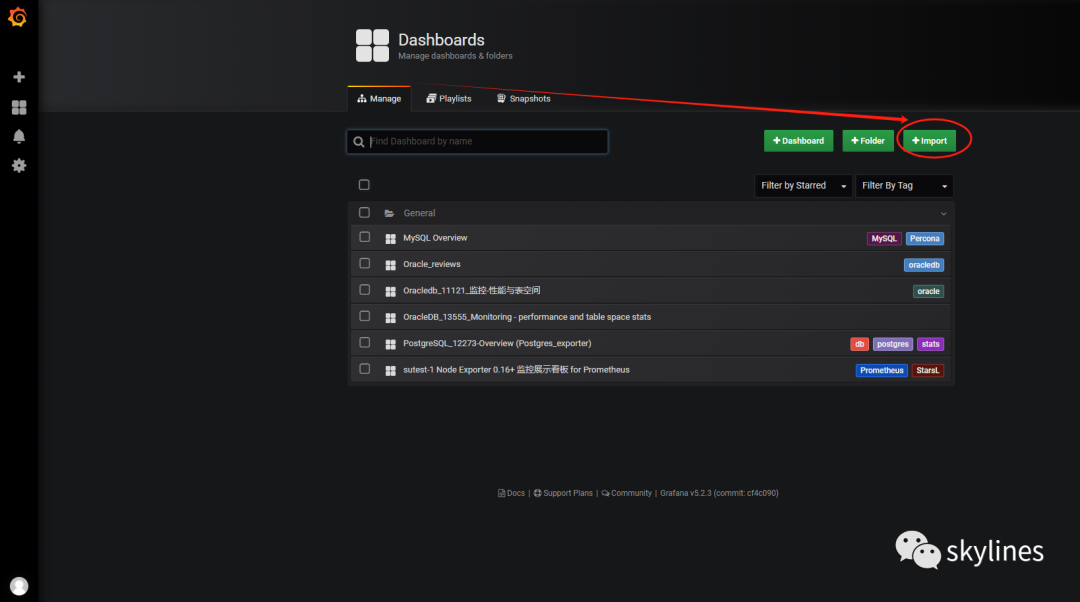
2、点击导入
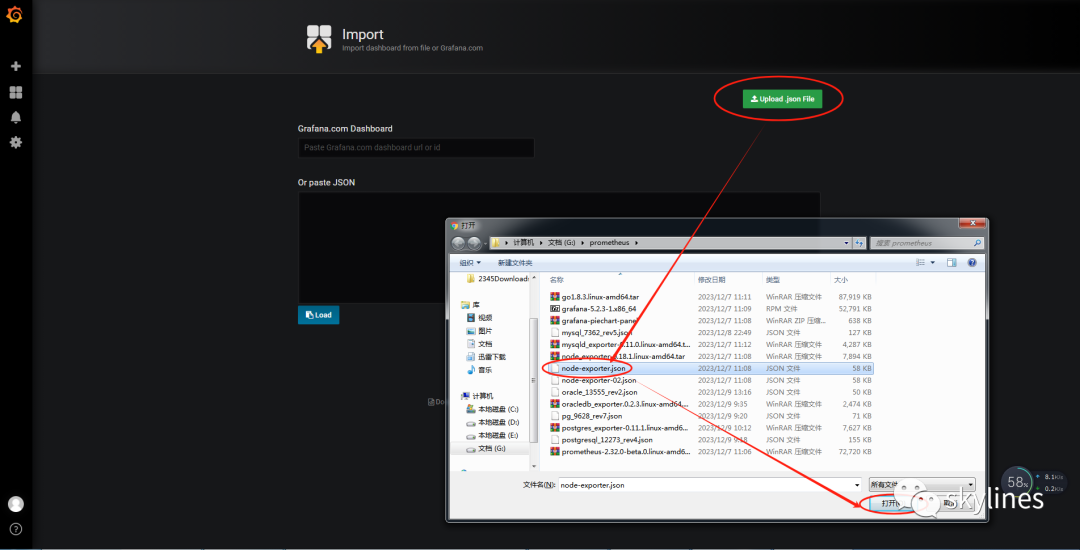
3、选择并上传对应的看板json文件
4、给选好的看板命名并选择数据源
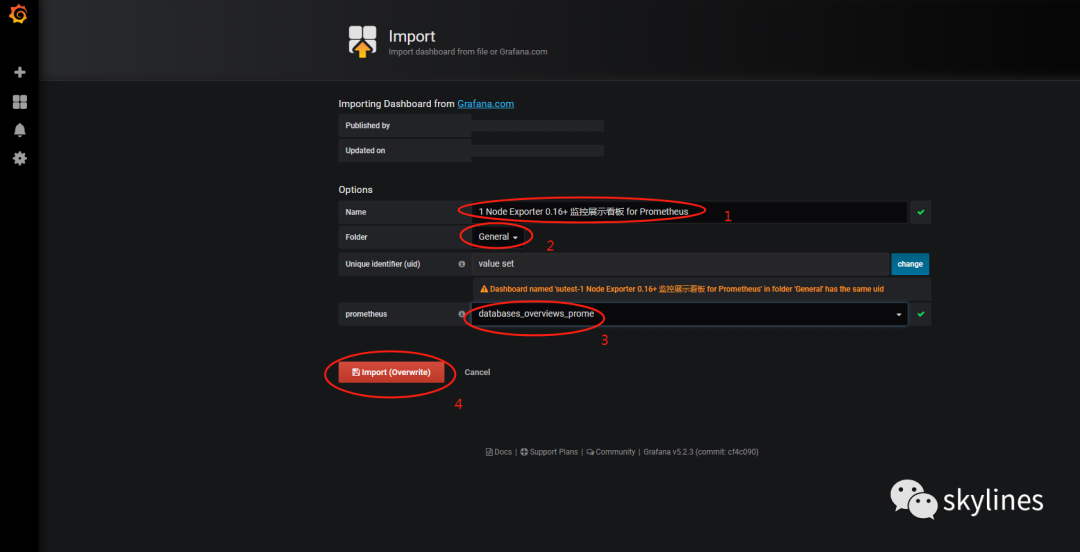
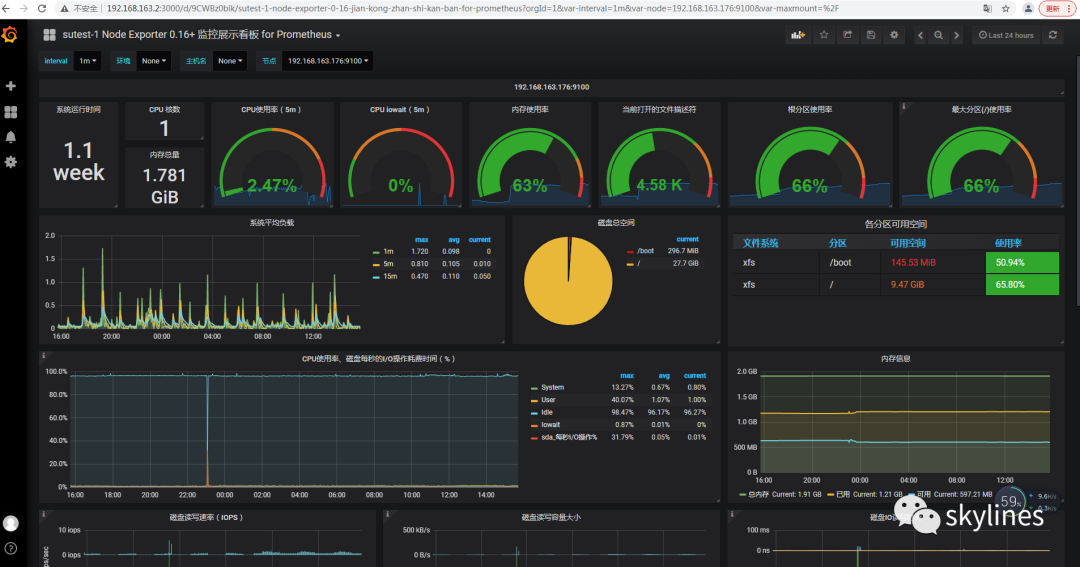
入以上,可以自行命名,选择上一步配置好的数据源(databases_overviews_prome),填写完好,就点击导入就可以,然后就跳转到监控的展示页面,如下图所示。
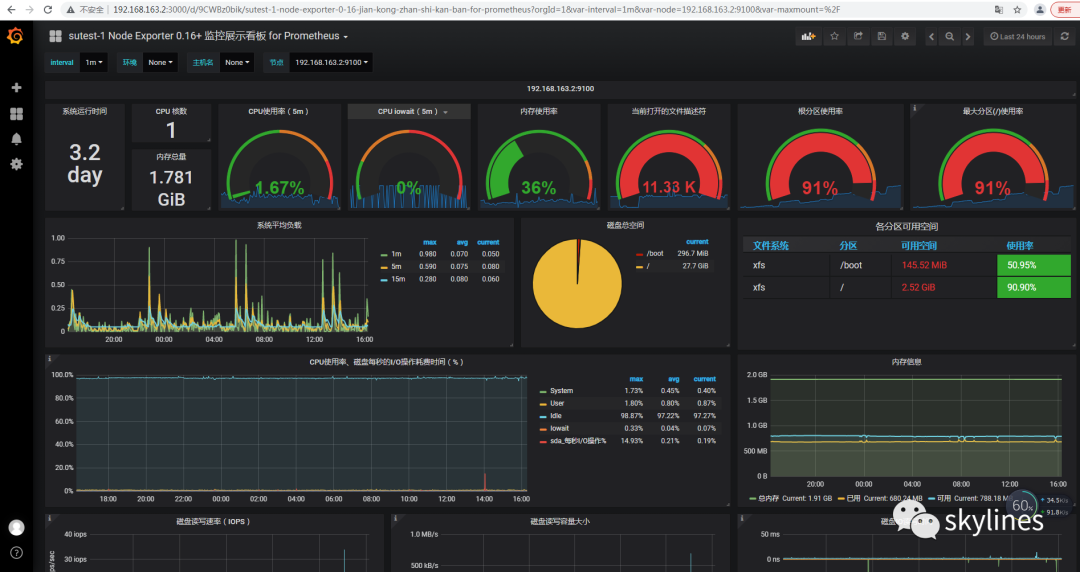
以上已经完成了prometheus+grafana监控主机操作系统资源的安装与配置。以下就是再讲述一下prometheus+grafana监控MySQL、Oracle和PostgreSQL的过程。同样适用以上prometheus作为服务与数据源,添加这三种数据库的监控配置,只需在被监控的机器上部署exporter,并在grafana前端页面上传并导入对应的看板json文件就可以。
一般exporter部署在被监控的数据库服务器上,如果异机部署exporter,则需要在部署的机器上安装一个数据库客户端。
##部署mysql_exporter监控MySQL数据库
--上传并解压mysql_exporter[root@mysqltest02 local]# tar -zxvf mysqld_exporter-0.11.0.linux-amd64.tar.gzmysqld_exporter-0.11.0.linux-amd64/mysqld_exporter-0.11.0.linux-amd64/NOTICEmysqld_exporter-0.11.0.linux-amd64/LICENSEmysqld_exporter-0.11.0.linux-amd64/mysqld_exporter[root@mysqltest02 local]#--编辑exporter连接MySQL数据库的参数文件vi my.cnf[client]user=mytestpassword=manager123host=192.168.163.176port=3306--启动/usr/local/mysqld_exporter-0.11.0.linux-amd64/mysqld_exporter --config.file=/usr/local/mysqld_exporter-0.11.0.linux-amd64/my.cnf--给mysql_exporter配置启停服务vi /etc/systemd/system/mysqld_exporter.service[Unit]Description=Prometheus mysqld_exporterAfter=network.target[Service]Type=simpleExecStart=/usr/local/mysqld_exporter-0.11.0.linux-amd64/mysqld_exporter --config.file=/usr/local/mysqld_exporter-0.11.0.linux-amd64/my.cnf[Install]WantedBy=multi-user.target--在prometheus.yml添加mysql_exporter连接信息cat >> /usr/local/prometheus/prometheus.yml- job_name: "176_mysql8_database"static_configs:- targets: ["192.168.163.176:9104"]
每修改完 prometheus.yml文件,保存并重启prometheus服务。
systemctl restart prometheus.service
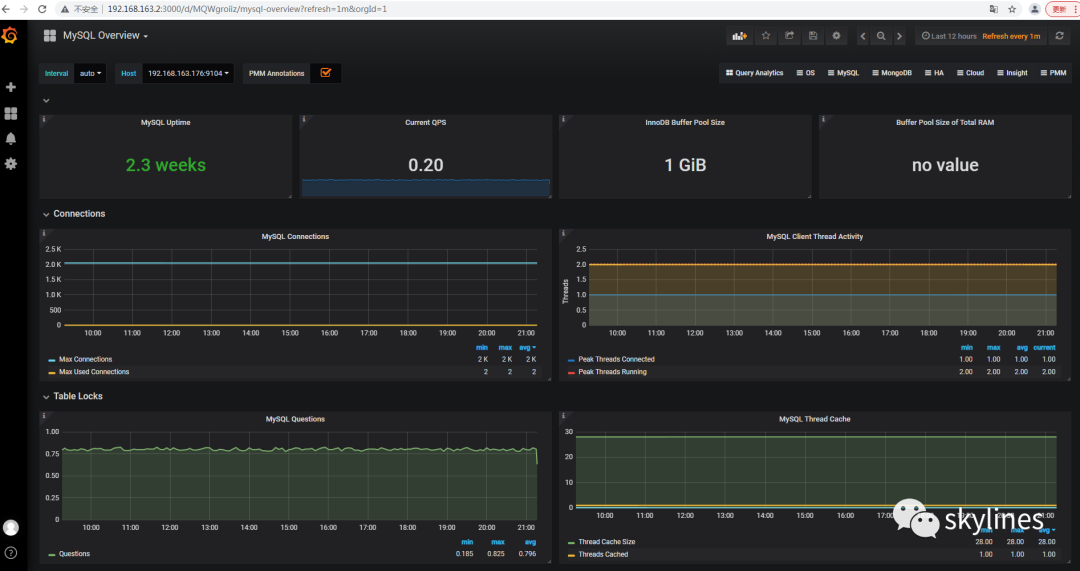
接着就是需要在grafana上添加监控MySQL数据库的看板json文件,添加过上参考以上添加监控主机看板的json文件一样。
##部署oracledb_exporter监控Oracle数据库
--上传并解压oracledb_exporter安装包[root@susource local]# tar -zxvf oracledb_exporter.0.2.3.linux-amd64.tar.gzoracledb_exporter.0.2.3.linux-amd64/oracledb_exporter.0.2.3.linux-amd64/oracledb_exporteroracledb_exporter.0.2.3.linux-amd64/default-metrics.toml#因为使用的是oracledb_exporter.0.2.3需要的是Oracle 18.0版本的客户端,本应该需要安装rpm -ivh oracle-instantclient18.5-basic-18.5.0.0.0-3.x86_64.rpmrpm -ivh oracle-instantclient18.5-sqlplus-18.5.0.0.0-3.x86_64.rpm,由于我的Oracle数据库是11.2.0.4版本的,18.0版本的客户端可以连接11.2版本的数据库,可以不需要安装客户端。--修改目录名[root@susource local]# mv oracledb_exporter.0.2.3.linux-amd64 oracledb_exporter--修改oracledb_exporter目录属性chown -R oracle:oinstall /usr/local/oracledb_exporterchmod -R 775 usr/local/oracledb_exporter--如果监听没有开启,需要开启监听lsnrctl start--向tnsnames.ora文件添加连接串cat>>/u01/app/oracle/product/11.2.0/dbhome_1/network/admin/tnsnames.oraMYSOURCE =(DESCRIPTION =(ADDRESS = (PROTOCOL = TCP)(HOST = susource)(PORT = 1521))(CONNECT_DATA =(SERVER = DEDICATED)(SERVICE_NAME = mysource)))--验证连接串的连通性$ tnsping mysource--向oracle用户下的~/.bash_profile文件添加以下环境变量cat>> ~/.bash_profileexport DATA_SOURCE_NAME=system/oracle@mysourceexport LD_LIBRARY_PATH=/u01/app/oracle/product/11.2.0/dbhome_1/lib--保存并生效source ~/.bash_profile--使用oracle用户启动oracledb_exporter$ /usr/local/oracledb_exporter/oracledb_exporter &#此时会报错:./oracledb_exporter: error while loading shared libraries: libclntsh.so.18.1: cannot open shared object file: No such file or directory由于我的数据库版本是11.2.0.4的,$ORACLE_HOME/lib下面没有libclntsh.so.18.1文件,只有libclntsh.so.11.1文件。--解决以上报错,创建libclntsh.so.18.1文件软连接指向libclntsh.so.11.1文件[oracle@susource lib]$ ls -lrt libclntsh.so.11.1-rwxr-xr-x. 1 oracle oinstall 53796056 Oct 9 2018 libclntsh.so.11.1[oracle@susource lib]$[oracle@susource lib]$ ln -s libclntsh.so.11.1 libclntsh.so.18.1[oracle@susource lib]$ ls -lrt libclntsh.so.18.1lrwxrwxrwx 1 oracle oinstall 17 Dec 8 20:02 libclntsh.so.18.1 -> libclntsh.so.11.1--再次使用oracle用户启动oracledb_exporter$ /usr/local/oracledb_exporter/oracledb_exporter &[oracle@susource oracledb_exporter]$ ./oracledb_exporter &[1] 36516[oracle@susource oracledb_exporter]$ INFO[0000] Starting oracledb_exporter 0.2.3 source=main.go:337INFO[0000] Listening on :9161 source=main.go:359[oracle@susource oracledb_exporter]$#此时,错误已经解决,成功启动oracledb_exporter。--在prometheus.yml添加oracledb_exporter连接信息cat >> /usr/local/prometheus/prometheus.yml- job_name: "2_oracle_mysource"static_configs:- targets: ["192.168.163.2:9161"]labels:instance: '192.168.163.2'tags: 'oracle_mysource'
每修改完 prometheus.yml文件,保存并重启prometheus服务。
systemctl restart prometheus.service
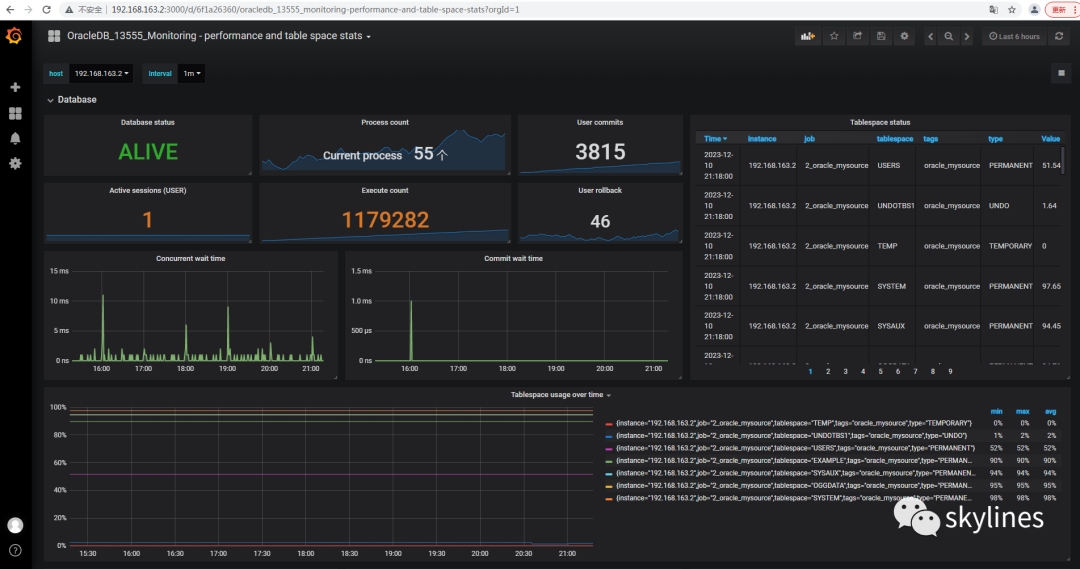
接着就是需要在grafana上添加监控Oracle数据库的看板json文件,添加过上参考以上添加监控主机看板的json文件一样。
##部署postgres_exporter监控PostgreSQL数据库
--上传并解压postgres_exporter安装包[root@mysqltest02 local]# tar -zxvf postgres_exporter-0.11.1.linux-amd64.tar.gzpostgres_exporter-0.11.1.linux-amd64/postgres_exporter-0.11.1.linux-amd64/LICENSEpostgres_exporter-0.11.1.linux-amd64/NOTICEpostgres_exporter-0.11.1.linux-amd64/postgres_exporter--修改目录名[root@mysqltest02 local]#[root@mysqltest02 local]# mv postgres_exporter-0.11.1.linux-amd64 postgres_exporter--修改postgres_exporter目录属性chown -R postgres:postgres user/local/postgres_exporterchmod -R 775 user/local/postgres_exporter--向postgres用户的~/.bash_profile文件添加环境变量cat>> ~/.bash_profileexport DATA_SOURCE_NAME=postgresql://postgres_exporter:mypassword@192.168.163.176:5433/postgres?sslmode=disable--保存并生效source ~/.bash_profile--创建监控用户CREATE user postgres_exporter WITH LOGIN PASSWORD 'mypassword';--向postgresql.conf参数文件添加参数cat >>postgresql.conf# Add settings for extensions hereshared_preload_libraries = 'pg_stat_statements'pg_stat_statements.max = 1000pg_stat_statements.track = all--编译添加pg_stat_statements插件[root@mysqltest02 ~]# cd home/postgres/postgresql-16.0/contrib[root@mysqltest02 contrib]# make & make install[1] 4496make -C ../src/backend generated-headersmake -C ../src/backend generated-headersmake[1]: Entering directory `/home/postgres/postgresql-16.0/src/backend'make -C catalog distprep generated-header-symlinksmake[1]: Entering directory `/home/postgres/postgresql-16.0/src/backend'make -C catalog distprep generated-header-symlinksmake[2]: Entering directory `/home/postgres/postgresql-16.0/src/backend/catalog'make[2]: Nothing to be done for `distprep'.make[2]: Nothing to be done for `generated-header-symlinks'.make[2]: Leaving directory `/home/postgres/postgresql-16.0/src/backend/catalog'make[2]: Entering directory `/home/postgres/postgresql-16.0/src/backend/catalog'make[2]: Nothing to be done for `distprep'.make[2]: Nothing to be done for `generated-header-symlinks'.make[2]: Leaving directory `/home/postgres/postgresql-16.0/src/backend/catalog'make -C nodes distprep generated-header-symlinksmake -C nodes distprep generated-header-symlinksmake[2]: Entering directory `/home/postgres/postgresql-16.0/src/backend/nodes'make[2]: Nothing to be done for `distprep'.make[2]: Nothing to be done for `generated-header-symlinks'.make[2]: Leaving directory `/home/postgres/postgresql-16.0/src/backend/nodes'make[2]: Entering directory `/home/postgres/postgresql-16.0/src/backend/nodes'make[2]: Nothing to be done for `distprep'.make[2]: Nothing to be done for `generated-header-symlinks'.make[2]: Leaving directory `/home/postgres/postgresql-16.0/src/backend/nodes'... ...make[1]: Leaving directory `/home/postgres/postgresql-16.0/contrib/unaccent'make -C vacuumlo allmake[1]: Entering directory `/home/postgres/postgresql-16.0/contrib/vacuumlo'gcc -std=gnu99 -Wall -Wmissing-prototypes -Wpointer-arith -Wdeclaration-after-statement -Werror=vla -Wendif-labels -Wmissing-format-attribute -Wformat-security -fno-strict-aliasing -fwrapv -fexcess-precision=standard -O2 -I../../src/interfaces/libpq -I. -I. -I../../src/include -D_GNU_SOURCE -c -o vacuumlo.o vacuumlo.cgcc -std=gnu99 -Wall -Wmissing-prototypes -Wpointer-arith -Wdeclaration-after-statement -Werror=vla -Wendif-labels -Wmissing-format-attribute -Wformat-security -fno-strict-aliasing -fwrapv -fexcess-precision=standard -O2 vacuumlo.o -L../../src/common -lpgcommon -L../../src/port -lpgport -L../../src/interfaces/libpq -lpq -L../../src/port -L../../src/common -Wl,--as-needed -Wl,-rpath,'/pgsql/postgresql/lib',--enable-new-dtags -lpgcommon -lpgport -lz -lreadline -lpthread -lrt -ldl -lm -o vacuumlomake[1]: Leaving directory `/home/postgres/postgresql-16.0/contrib/vacuumlo'[1]+ Done make--重启postgresql数据库/pgsql/postgresql/bin/pg_ctl -D pgbase/pgdata -l logfile restart--进入postgresql数据库创建扩展[postgres@mysqltest02 ~]$ psql -p5433psql (16.0)Type "help" for help.postgres=# create extension pg_stat_statements;CREATE EXTENSIONpostgres=# SELECT * FROM pg_extension;oid | extname | extowner | extnamespace | extrelocatable | extversion | extconfig | extcondition-------+--------------------+----------+--------------+----------------+------------+-----------+--------------13674 | plpgsql | 10 | 11 | f | 1.0 | |16518 | pg_stat_statements | 10 | 2200 | t | 1.10 | |(2 rows)#扩展已经创建。--pg 10.0以上版本,执行一下三段SQLCREATE OR REPLACE FUNCTION __tmp_create_user() returns void as $$BEGINIF NOT EXISTS (SELECT -- SELECT list can stay empty for thisFROM pg_catalog.pg_userWHERE usename = 'postgres_exporter') THENCREATE USER postgres_exporter;END IF;END;$$ language plpgsql;SELECT __tmp_create_user();DROP FUNCTION __tmp_create_user();ALTER USER postgres_exporter WITH PASSWORD 'mypassword';ALTER USER postgres_exporter SET SEARCH_PATH TO postgres_exporter,pg_catalog;GRANT CONNECT ON DATABASE postgres TO postgres_exporter;--创建queries.yaml文件#文件内容见以上材料包的queries.yaml.txt文件cd /usr/local/postgres_exporter; cat >>queries.yaml--启动postgres_exportercd /usr/local/postgres_exporter./postgres_exporter --extend.query-path=queries.yaml &--在prometheus.yml添加postgres_exporter连接信息cat >> /usr/local/prometheus/prometheus.yml- job_name: "176_postgresdb"static_configs:- targets: ["192.168.163.176:9187"]labels:instance: '192.168.163.176'tags: 'my_postgresql'
每修改完 prometheus.yml文件,保存并重启prometheus服务。
systemctl restart prometheus.service
接着就是需要在grafana上添加监控PostgreSQL数据库的看板json文件,添加过上参考以上添加监控主机看板的json文件一样。

以上是这次prometheus+grafana部署和配置的全过程。
如果感觉以上监控看板的模板内容不够丰富,还可以自己进行修改各看板对应的json文件内容,或者往各个exporter添加相应的采集信息内容。
(文毕)
