在PG中,一个简要的体系结构图可以大致画成下边的样子:
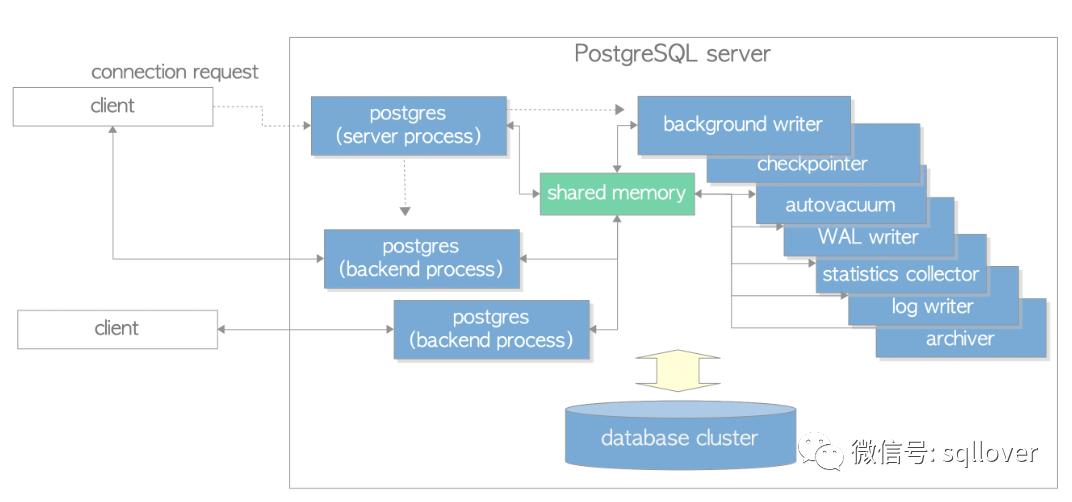
Server端基本上分成backend process和若干background process。这些process都是一个名为postmaster进程的子进程。而postmaster则是postgres进程的别名。
[14:42:08-postgres@centos1:/pgccc]$ ps -axjf | grep 23267 | grep -v grep
     1  23267  23267  23267 ?            -1 Ss      26   0:02 /usr/pgsql-14/bin/postgres
 23267  23268  23268  23268 ?            -1 Ss      26   0:00  \_ postgres: logger
 23267  23270  23270  23270 ?            -1 Ss      26   0:00  \_ postgres: checkpointer
 23267  23271  23271  23271 ?            -1 Ss      26   0:03  \_ postgres: background writer
 23267  23272  23272  23272 ?            -1 Ss      26   0:03  \_ postgres: walwriter
 23267  23273  23273  23273 ?            -1 Ss      26   0:02  \_ postgres: autovacuum launcher
 23267  23274  23274  23274 ?            -1 Ss      26   0:00  \_ postgres: archiver
 23267  23275  23275  23275 ?            -1 Ss      26   0:04  \_ postgres: stats collector
 23267  23276  23276  23276 ?            -1 Ss      26   0:00  \_ postgres: logical replication launcher
 23267  46791  46791  46791 ?            -1 Ss      26   0:00  \_ postgres: postgres mydb [local] idle
系统启动以后,我们会发现一个特殊的文件:postmaster.pid。它的内容有什么含义呢?
在PG成功启动完以后,postmaster父进程会生成一个postmaster.pid文件,其基本内容如下:
01   2360
02   /var/lib/pgsql/14/data
03   1659737868
04   5555
05   /var/run/postgresql
06   0.0.0.0
07    52527898         0
08   ready
总行8行:1. 行1:2360,就是父进程的进程号pid,可以通过ps -axjf | grep postgres来查询
2. 行2:/var/lib/pgsql/14/data PGDATA实例的数据目录
3. 行3:1659737868, 数据库的启动时间,需要转换 (转换后不是很准确)(自1970-01-01 00:00:00 UTC算起经历的秒数)
postgres=# select pg_postmaster_start_time();
  pg_postmaster_start_time
-----------------------------
 2022-08-06 06:17:49.0841+08
(1 row)

postgres=# select extract(epoch from  pg_postmaster_start_time());
      extract
-------------------
 1659737869.084100
(1 row)

postgres=# select to_timestamp(1659737869.084100);
        to_timestamp
-----------------------------
 2022-08-06 06:17:49.0841+08
(1 row)
4. 行4:实例运行监听的端口号: 5555
5. 行5:实例 运行时使用的Unix Socket缺省目录: var/run/postgresql
postgres=# show unix_socket_directories;
  unix_socket_directories
---------------------------
 /var/run/postgresql, /tmp
(1 row)
6. 行6:实例监听可接受的有效IP地址,这里是只接受IPv4: 0.0.0.0
postgres=# show listen_addresses ;
 listen_addresses
------------------
 0.0.0.0
(1 row)
7. 行7:52527898 0 记录着共享段的key和shmid值
[06:56:57-postgres@centos1:/var/lib/pgsql]$ ipcs -m

------ Shared Memory Segments --------
key        shmid      owner      perms      bytes      nattch     status
0x0321831a 0          postgres   600        56         7

postgres=# select x'0321831a'::bigint;
   int8
----------
 52527898
(1 row)

postgres=# select to_hex(52527898);
 to_hex
---------
 321831a
(1 row)
关于共享内存段,有趣的博文:
https://www.eygle.com/archives/2005/11/whats_mean_linux_shmmax.html
and:
Linux上shmmax参数的设置及含义: https://www.modb.pro/db/16511
另一个:samples:
[01:49:37-postgres@sean-rh4.openstack.eu-nl-1.cloud.sap:/var/lib/pgsql]$ ipcs -a

------ Message Queues --------

key        msqid      owner      perms      used-bytes   messages

------ Shared Memory Segments --------

key        shmid      owner      perms      bytes      nattch     status

0x0003e325 9          postgres   600        56         6

------ Semaphore Arrays --------

key        semid      owner      perms      nsems
8. 行8:ready 实例目前的状态, 表示server已经准备就绪
[06:22:30-postgres@centos1:/var/lib/pgsql]$ pg_isready
/var/run/postgresql:5555 - accepting connections




