


实时性能分析
首先介绍实时性能分析,分析内容涵盖主机、DB的常用性能指标,用于总览性能状态。
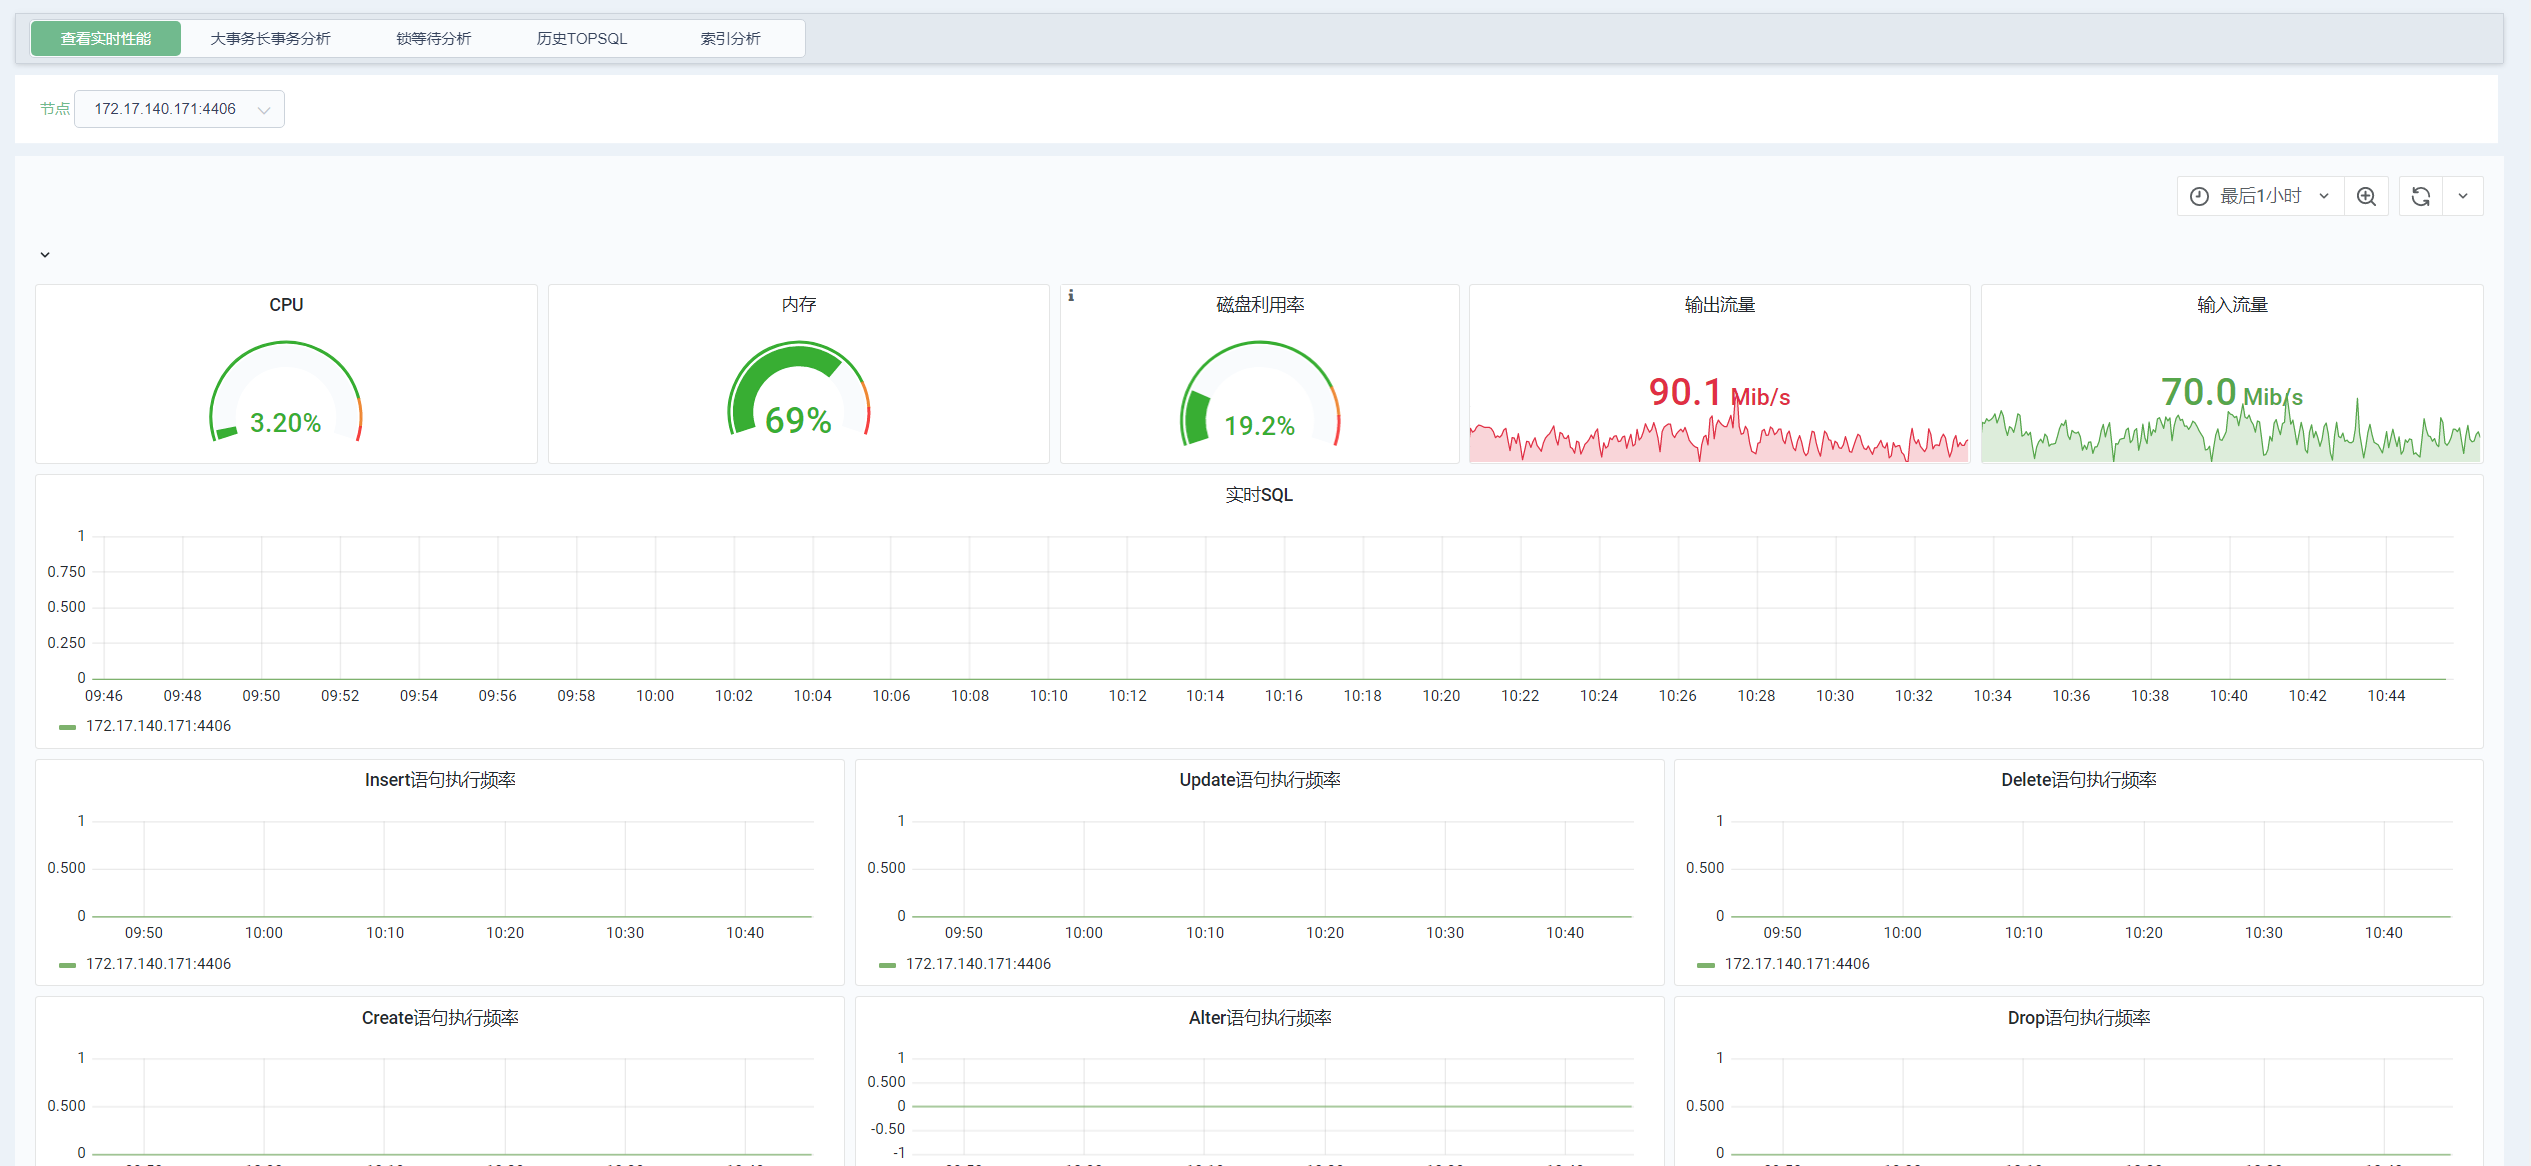
CPU
(((count(count(node_cpu_seconds_total{address="$address"}) by (cpu))) - avg(sum by (mode)(rate(node_cpu_seconds_total{mode='idle',address="$address"}[$interval])))) * 100) / count(count(node_cpu_seconds_total{address="$address"}) by (cpu))
内存
((node_memory_MemTotal_bytes{address="$address"} - node_memory_MemFree_bytes{address="$address"}) / (node_memory_MemTotal_bytes{address="$address"} )) * 100
100 - ((node_memory_MemAvailable_bytes{address="$address"} * 100) / node_memory_MemTotal_bytes{address="$address"})
磁盘利用率
100 - ((node_filesystem_avail_bytes{address="$address",mountpoint="/",fstype!="rootfs"} * 100) / node_filesystem_size_bytes{address="$address",mountpoint="/",fstype!="rootfs"})
输出流量
rate(node_netstat_IpExt_OutOctets{address="$address"}[30s])
输入流量
rate(node_netstat_IpExt_InOctets{address="$address"}[30s])
实时SQL
sum by(address, port, name)(database_execute_sql_num{cid="$cid", name="$member_name", option="total"})
数据库采集语句
select count(*) from information_schema.PROCESSLIST where info like "insert%" union all
select count(*) from information_schema.PROCESSLIST where info like "update%" union all
select count(*) from information_schema.PROCESSLIST where info like "delete%" union all
select count(*) from information_schema.PROCESSLIST where info like "create%" union all
select count(*) from information_schema.PROCESSLIST where info like "alter%" union all
select count(*) from information_schema.PROCESSLIST where info like "drop%";
insert语句执行频率
sum by(address, port, name)(database_execute_sql_num{cid="$cid", name="$member_name", option="insert"})
数据库采集语句
select count(*) from information_schema.PROCESSLIST where info like "insert%";
update语句执行频率
sum by(address, port, name)(database_execute_sql_num{cid="$cid", name="$member_name", option="update"})
数据库采集语句
select count(*) from information_schema.PROCESSLIST where info like "update%";
delete语句执行频率
sum by(address, port, name)(database_execute_sql_num{cid="$cid", name="$member_name", option="delete"})
数据库采集语句
select count(*) from information_schema.PROCESSLIST where info like "delete%";
create语句执行频率
sum by(address, port, name)(database_execute_sql_num{cid="$cid", name="$member_name", option="create"})
数据库采集语句
select count(*) from information_schema.PROCESSLIST where info like "create%";
alter语句执行频率
sum by(address, port, name)(database_execute_sql_num{cid="$cid", name="$member_name", option="alter"})
数据库采集语句
select count(*) from information_schema.PROCESSLIST where info like "alter%";
drop语句执行频率
sum by(address, port, name)(database_execute_sql_num{cid="$cid", name="$member_name", option="drop"})
数据库采集语句
select count(*) from information_schema.PROCESSLIST where info like "drop%";
MDL锁数量
sum by(address, port, name)(database_metadata_locks_num{cid="$cid", name="$member_name"})
数据库采集语句
select count(*) from performance_schema.metadata_locks where OBJECT_NAME is not null;
等待落盘的脏页数量
sum by(address, port, name)(database_engine_innodb_modified_db_pages{cid="$cid", name="$member_name"})
数据库采集语句
SHOW ENGINE INNODB STATUS;
活跃连接数使用率
sum by(address, port, name)(rate(database_global_status_threads_running{cid="$cid", name="$member_name"}[$__interval]))
数据库采集语句
SHOW GLOBAL STATUS;
日志缓存区状态
sum by(address, port, name)(rate(database_global_status_innodb_log_write_requests{cid="$cid", name="$member_name"}[30s]))
sum by(address, port, name)(rate(database_global_status_innodb_os_log_fsyncs{cid="$cid", name="$member_name"}[30s]))
长事务指标
sum by(address, port, name)(database_long_transaction{cid="$cid", name="$member_name"})
数据库采集语句
select count(*) from information_schema.innodb_trx where now()-trx_started > %d;
