


前言
之前我曾写过一篇关于日志的文章👉🏻 还不知道如何配置日志?拿捏!,这两天在③、④群中还是有几个老铁问到了日志相关的问题,看样子还需要再科普一下,这一期重点讲讲那几个比较绕的配置。
log_min_duration_statement vs log_duration
一些基础的配置不再描述,让我们再重点看看 log_duration、log_min_duration、log_statement 这几个参数。在上一期的文章中,我曾提过,log_min_duration_statement 和 log_duration 均可用于记录 SQL 的执行时长,但是一般用 log_min_duration_statement。
log_min_duration_statement 使用较多,此参数会将 SQL 与对应执行时长记录在一起,方便查找,对于使用 extend protocal 的客户端,解析、绑定和执行的时间会被分开记录。其次,当与 log_statement 一起使用时,已经被 log_statement 记录的查询不会被再次记录。
For clients using extended query protocol, durations of the Parse, Bind, and Execute steps are logged independently.
现在有个表包含 4 条数据,让我们验证一下,用 preparestatement 做个简单的查询,同时观察日志行为
postgres=# select * from test;
 id |   info
----+----------
  1 | hello
  2 | world
  3 | postgres
  4 | xiongcc
(4 rows)

postgres=# show log_min_duration_statement ;
 log_min_duration_statement
----------------------------
 0
(1 row)

[postgres@mypg ~]$ java -cp .:postgresql-42.7.2.jar PostgreSQLQueryExample
ID: 3, Info: postgres
可以看到,parse/bind/execute 分别进行了记录,其次,在 bind 和 execute 阶段还可以看到绑定变量的值。
2024-08-01 16:33:03.258 CST,"postgres","postgres",30244,"127.0.0.1:58590",66ab483f.7624,1,"PARSE",2024-08-01 16:33:03 CST,17/2,0,LOG,00000,"duration: 0.146 ms  parse <unnamed>: SET extra_float_digits = 3",,,,,,,,,"","client backend",,0
2024-08-01 16:33:03.258 CST,"postgres","postgres",30244,"127.0.0.1:58590",66ab483f.7624,2,"BIND",2024-08-01 16:33:03 CST,17/2,0,LOG,00000,"duration: 0.016 ms  bind <unnamed>: SET extra_float_digits = 3",,,,,,,,,"","client backend",,0
2024-08-01 16:33:03.258 CST,"postgres","postgres",30244,"127.0.0.1:58590",66ab483f.7624,3,"SET",2024-08-01 16:33:03 CST,17/2,0,LOG,00000,"duration: 0.025 ms  execute <unnamed>: SET extra_float_digits = 3",,,,,,,,,"","client backend",,0
2024-08-01 16:33:03.258 CST,"postgres","postgres",30244,"127.0.0.1:58590",66ab483f.7624,4,"PARSE",2024-08-01 16:33:03 CST,17/3,0,LOG,00000,"duration: 0.031 ms  parse <unnamed>: SET application_name = 'PostgreSQL JDBC Driver'",,,,,,,,,"","client backend",,0
2024-08-01 16:33:03.258 CST,"postgres","postgres",30244,"127.0.0.1:58590",66ab483f.7624,5,"BIND",2024-08-01 16:33:03 CST,17/3,0,LOG,00000,"duration: 0.005 ms  bind <unnamed>: SET application_name = 'PostgreSQL JDBC Driver'",,,,,,,,,"","client backend",,0
2024-08-01 16:33:03.258 CST,"postgres","postgres",30244,"127.0.0.1:58590",66ab483f.7624,6,"SET",2024-08-01 16:33:03 CST,17/3,0,LOG,00000,"duration: 0.010 ms  execute <unnamed>: SET application_name = 'PostgreSQL JDBC Driver'",,,,,,,,,"PostgreSQL JDBC Driver","client backend",,0
2024-08-01 16:33:03.278 CST,"postgres","postgres",30244,"127.0.0.1:58590",66ab483f.7624,7,"PARSE",2024-08-01 16:33:03 CST,17/4,0,LOG,00000,"duration: 0.703 ms  parse <unnamed>: SELECT id, info FROM test WHERE id = $1",,,,,,,,,"PostgreSQL JDBC Driver","client backend",,0
2024-08-01 16:33:03.278 CST,"postgres","postgres",30244,"127.0.0.1:58590",66ab483f.7624,8,"BIND",2024-08-01 16:33:03 CST,17/4,0,LOG,00000,"duration: 0.459 ms  bind <unnamed>: SELECT id, info FROM test WHERE id = $1","Parameters: $1 = '4'",,,,,,,,"PostgreSQL JDBC Driver","client backend",,0
2024-08-01 16:33:03.278 CST,"postgres","postgres",30244,"127.0.0.1:58590",66ab483f.7624,9,"SELECT",2024-08-01 16:33:03 CST,17/4,0,LOG,00000,"duration: 0.036 ms  execute <unnamed>: SELECT id, info FROM test WHERE id = $1","Parameters: $1 = '4'",,,,,,,,"PostgreSQL JDBC Driver","client backend",,0
另外,还有一个 log_duration 参数,让我们也打开看看是什么效果:
postgres=# show log_min_duration_statement ;
 log_min_duration_statement
----------------------------
 -1
(1 row)

postgres=# show log_duration ;
 log_duration
--------------
 on
(1 row)

[postgres@mypg ~]$ java -cp .:postgresql-42.7.2.jar PostgreSQLQueryExample
ID: 4, Info: xiongcc
日志如下:
2024-08-01 16:35:29.785 CST,"postgres","postgres",30412,"127.0.0.1:58602",66ab48d1.76cc,1,"PARSE",2024-08-01 16:35:29 CST,23/2,0,LOG,00000,"duration: 0.146 ms",,,,,,,,,"","client backend",,0
2024-08-01 16:35:29.785 CST,"postgres","postgres",30412,"127.0.0.1:58602",66ab48d1.76cc,2,"BIND",2024-08-01 16:35:29 CST,23/2,0,LOG,00000,"duration: 0.015 ms",,,,,,,,,"","client backend",,0
2024-08-01 16:35:29.785 CST,"postgres","postgres",30412,"127.0.0.1:58602",66ab48d1.76cc,3,"SET",2024-08-01 16:35:29 CST,23/2,0,LOG,00000,"duration: 0.026 ms",,,,,,,,,"","client backend",,0
2024-08-01 16:35:29.786 CST,"postgres","postgres",30412,"127.0.0.1:58602",66ab48d1.76cc,4,"PARSE",2024-08-01 16:35:29 CST,23/3,0,LOG,00000,"duration: 0.028 ms",,,,,,,,,"","client backend",,0
2024-08-01 16:35:29.786 CST,"postgres","postgres",30412,"127.0.0.1:58602",66ab48d1.76cc,5,"BIND",2024-08-01 16:35:29 CST,23/3,0,LOG,00000,"duration: 0.006 ms",,,,,,,,,"","client backend",,0
2024-08-01 16:35:29.786 CST,"postgres","postgres",30412,"127.0.0.1:58602",66ab48d1.76cc,6,"SET",2024-08-01 16:35:29 CST,23/3,0,LOG,00000,"duration: 0.010 ms",,,,,,,,,"PostgreSQL JDBC Driver","client backend",,0
2024-08-01 16:35:29.806 CST,"postgres","postgres",30412,"127.0.0.1:58602",66ab48d1.76cc,7,"PARSE",2024-08-01 16:35:29 CST,23/4,0,LOG,00000,"duration: 0.711 ms",,,,,,,,,"PostgreSQL JDBC Driver","client backend",,0
2024-08-01 16:35:29.806 CST,"postgres","postgres",30412,"127.0.0.1:58602",66ab48d1.76cc,8,"BIND",2024-08-01 16:35:29 CST,23/4,0,LOG,00000,"duration: 0.501 ms",,,,,,,,,"PostgreSQL JDBC Driver","client backend",,0
2024-08-01 16:35:29.806 CST,"postgres","postgres",30412,"127.0.0.1:58602",66ab48d1.76cc,9,"SELECT",2024-08-01 16:35:29 CST,23/4,0,LOG,00000,"duration: 0.042 ms",,,,,,,,,"PostgreSQL JDBC Driver","client backend",,0
可以看到,相较于 log_min_duration_statement,log_duration 打开之后,并没有记录 SQL 语句,只会记录时长,并且不会区分 SQL,一股脑全部记录下来
log_duration:Causes the duration of every completed statement to be logged
而 log_min_duration_statement 会记录对应的 SQL,并且只会记录超过指定时长的 SQL (此例中设为的是 0,因此会记录所有的 SQL)。

至于 log_duration 的用途,可能就如这里所说:
Allows you to gather stats on high-workload environments, without the added overhead of printing the full query
允许你收集高负载环境下的统计数据,而无需额外打印完整查询的开销
那么同时将 log_duration 和 log_min_duration_statement 都打开的话会如何?
postgres=# show log_min_duration_statement ;
 log_min_duration_statement
----------------------------
 0
(1 row)

postgres=# show log_duration ;
 log_duration
--------------
 on
(1 row)
经验证,如果都是 0 的话,log_duration 参数无效,以 log_min_duration_statement 为准
2024-08-01 16:45:51.318 CST,"postgres","postgres",30998,"127.0.0.1:58638",66ab4b3f.7916,1,"PARSE",2024-08-01 16:45:51 CST,30/2,0,LOG,00000,"duration: 0.152 ms  parse <unnamed>: SET extra_float_digits = 3",,,,,,,,,"","client backend",,0
2024-08-01 16:45:51.318 CST,"postgres","postgres",30998,"127.0.0.1:58638",66ab4b3f.7916,2,"BIND",2024-08-01 16:45:51 CST,30/2,0,LOG,00000,"duration: 0.015 ms  bind <unnamed>: SET extra_float_digits = 3",,,,,,,,,"","client backend",,0
2024-08-01 16:45:51.318 CST,"postgres","postgres",30998,"127.0.0.1:58638",66ab4b3f.7916,3,"SET",2024-08-01 16:45:51 CST,30/2,0,LOG,00000,"duration: 0.025 ms  execute <unnamed>: SET extra_float_digits = 3",,,,,,,,,"","client backend",,0
2024-08-01 16:45:51.319 CST,"postgres","postgres",30998,"127.0.0.1:58638",66ab4b3f.7916,4,"PARSE",2024-08-01 16:45:51 CST,30/3,0,LOG,00000,"duration: 0.028 ms  parse <unnamed>: SET application_name = 'PostgreSQL JDBC Driver'",,,,,,,,,"","client backend",,0
2024-08-01 16:45:51.319 CST,"postgres","postgres",30998,"127.0.0.1:58638",66ab4b3f.7916,5,"BIND",2024-08-01 16:45:51 CST,30/3,0,LOG,00000,"duration: 0.006 ms  bind <unnamed>: SET application_name = 'PostgreSQL JDBC Driver'",,,,,,,,,"","client backend",,0
2024-08-01 16:45:51.319 CST,"postgres","postgres",30998,"127.0.0.1:58638",66ab4b3f.7916,6,"SET",2024-08-01 16:45:51 CST,30/3,0,LOG,00000,"duration: 0.009 ms  execute <unnamed>: SET application_name = 'PostgreSQL JDBC Driver'",,,,,,,,,"PostgreSQL JDBC Driver","client backend",,0
2024-08-01 16:45:51.344 CST,"postgres","postgres",30998,"127.0.0.1:58638",66ab4b3f.7916,7,"PARSE",2024-08-01 16:45:51 CST,30/4,0,LOG,00000,"duration: 0.762 ms  parse <unnamed>: SELECT id, info FROM test WHERE id = $1",,,,,,,,,"PostgreSQL JDBC Driver","client backend",,0
2024-08-01 16:45:51.345 CST,"postgres","postgres",30998,"127.0.0.1:58638",66ab4b3f.7916,8,"BIND",2024-08-01 16:45:51 CST,30/4,0,LOG,00000,"duration: 0.839 ms  bind <unnamed>: SELECT id, info FROM test WHERE id = $1","Parameters: $1 = '1'",,,,,,,,"PostgreSQL JDBC Driver","client backend",,0
2024-08-01 16:45:51.347 CST,"postgres","postgres",30998,"127.0.0.1:58638",66ab4b3f.7916,9,"SELECT",2024-08-01 16:45:51 CST,30/4,0,LOG,00000,"duration: 2.274 ms  execute <unnamed>: SELECT id, info FROM test WHERE id = $1","Parameters: $1 = '1'",,,,,,,,"PostgreSQL JDBC Driver","client backend",,0
那如果配置了 log_min_duration_statement 为一个正数,又如何?(为了演示效果,我们往表里又插入了一万行)。
postgres=# show log_min_duration_statement ;
 log_min_duration_statement
----------------------------
 1ms
(1 row)

postgres=# show log_duration ;
 log_duration
--------------
 on
(1 row)
可以看到,所有的持续时间还是会被记录,但是仅记录超过阈值的 SQL 语句 (最后一个)。因此,这个机制对于收集高负载系统的统计数据十分有用。
Note
The difference between enabling
log_durationand setting log_min_duration_statement to zero is that exceedinglog_min_duration_statementforces the text of the query to be logged, but this option doesn't. Thus, iflog_durationisonandlog_min_duration_statementhas a positive value, all durations are logged but the query text is included only for statements exceeding the threshold. This behavior can be useful for gathering statistics in high-load installations.
2024-08-01 16:48:38.761 CST,"postgres","postgres",31169,"127.0.0.1:58648",66ab4be6.79c1,1,"PARSE",2024-08-01 16:48:38 CST,34/2,0,LOG,00000,"duration: 0.160 ms",,,,,,,,,"","client backend",,0
2024-08-01 16:48:38.761 CST,"postgres","postgres",31169,"127.0.0.1:58648",66ab4be6.79c1,2,"BIND",2024-08-01 16:48:38 CST,34/2,0,LOG,00000,"duration: 0.021 ms",,,,,,,,,"","client backend",,0
2024-08-01 16:48:38.761 CST,"postgres","postgres",31169,"127.0.0.1:58648",66ab4be6.79c1,3,"SET",2024-08-01 16:48:38 CST,34/2,0,LOG,00000,"duration: 0.033 ms",,,,,,,,,"","client backend",,0
2024-08-01 16:48:38.762 CST,"postgres","postgres",31169,"127.0.0.1:58648",66ab4be6.79c1,4,"PARSE",2024-08-01 16:48:38 CST,34/3,0,LOG,00000,"duration: 0.046 ms",,,,,,,,,"","client backend",,0
2024-08-01 16:48:38.762 CST,"postgres","postgres",31169,"127.0.0.1:58648",66ab4be6.79c1,5,"BIND",2024-08-01 16:48:38 CST,34/3,0,LOG,00000,"duration: 0.008 ms",,,,,,,,,"","client backend",,0
2024-08-01 16:48:38.762 CST,"postgres","postgres",31169,"127.0.0.1:58648",66ab4be6.79c1,6,"SET",2024-08-01 16:48:38 CST,34/3,0,LOG,00000,"duration: 0.013 ms",,,,,,,,,"PostgreSQL JDBC Driver","client backend",,0
2024-08-01 16:48:38.783 CST,"postgres","postgres",31169,"127.0.0.1:58648",66ab4be6.79c1,7,"PARSE",2024-08-01 16:48:38 CST,34/4,0,LOG,00000,"duration: 0.687 ms",,,,,,,,,"PostgreSQL JDBC Driver","client backend",,0
2024-08-01 16:48:38.784 CST,"postgres","postgres",31169,"127.0.0.1:58648",66ab4be6.79c1,8,"BIND",2024-08-01 16:48:38 CST,34/4,0,LOG,00000,"duration: 0.738 ms",,,,,,,,,"PostgreSQL JDBC Driver","client backend",,0
2024-08-01 16:48:38.786 CST,"postgres","postgres",31169,"127.0.0.1:58648",66ab4be6.79c1,9,"SELECT",2024-08-01 16:48:38 CST,34/4,0,LOG,00000,"duration: 2.154 ms  execute <unnamed>: SELECT id, info FROM test WHERE id = $1","Parameters: $1 = '3'",,,,,,,,"PostgreSQL JDBC Driver","client backend",,0
log_min_duration_statement vs log_statement
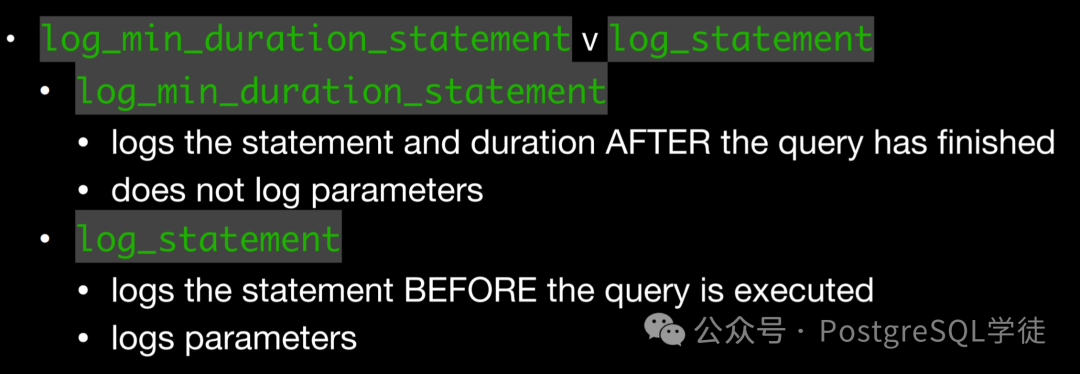
还有一对经常放在一起讨论的参数,那就是 log_statement 和 log_min_duration_statement。这个在上一期也有说过,记录日志的时机:
log_min_duration_statement 在语句执行完之后才会记录(毕竟需要记录执行时长) log_statement 在语句解析完毕,exector 阶段之前记录,并且会记录相关绑定变量。
让我们以简单查询协议为例,找到 SQL 入口函数 exec_simple_query
 /*
  * Switch to appropriate context for constructing parsetrees.
  */
 oldcontext = MemoryContextSwitchTo(MessageContext);

 /*
  * Do basic parsing of the query or queries (this should be safe even if
  * we are in aborted transaction state!)
  */
 parsetree_list = pg_parse_query(query_string);

 /* Log immediately if dictated by log_statement */
 if (check_log_statement(parsetree_list))
 {
  ereport(LOG,
    (errmsg("statement: %s", query_string),
     errhidestmt(true),
     errdetail_execute(parsetree_list)));
  was_logged = true;
 }
可以看到,当解析完成之后,然后调用 check_log_statement,判断是否需要记录,记录内容便是"statement: + 原始查询"
让我们验证一下,就用 psql 即可,psql 就是 simple query
postgres=# show log_min_duration_statement ;
 log_min_duration_statement
----------------------------
 1ms
(1 row)

postgres=# show log_statement;
 log_statement
---------------
 all
(1 row)

postgres=# show log_duration ;
 log_duration
--------------
 on
(1 row)

postgres=# select * from test where id = 3;
 id |               info
----+----------------------------------
  3 | postgres
  3 | e32c18e263713936b04e8dfd4960ee4c
(2 rows)
日志如下:
2024-08-01 17:16:43.272 CST,"postgres","postgres",32526,"[local]",66ab51fe.7f0e,7,"idle",2024-08-01 17:14:38 CST,38/5,0,LOG,00000,"statement: select * from test where id = 3;",,,,,,,,,"psql","client backend",,0
2024-08-01 17:16:43.275 CST,"postgres","postgres",32526,"[local]",66ab51fe.7f0e,8,"SELECT",2024-08-01 17:14:38 CST,38/0,0,LOG,00000,"duration: 3.257 ms",,,,,,,,,"psql","client backend",,0
另外还有一个注意点,当 log_min_duration_statement 与 log_statement 一起使用时,已经被 log_statement 记录的查询不会被再次记录,所以可以看到,第一条日志条目记录了查询语句之后,第二条没有对应的 SQL 了。因此这个行为,最好搭配上 log_line_prefix,以便找到源头。
When using this option together with log_statement, the text of statements that are logged because of
log_statementwill not be repeated in the duration log message. If you are not using syslog, it is recommended that you log the PID or session ID using log_line_prefix so that you can link the statement message to the later duration message using the process ID or session ID.
然后 exec_simple_query 函数一直往下拉, 就可以看到 check_log_duration,顾名思义记录时长
 /*
  * Emit duration logging if appropriate.
  */
 switch (check_log_duration(msec_str, was_logged))
 {
  case 1:
   ereport(LOG,
     (errmsg("duration: %s ms", msec_str),
      errhidestmt(true)));
   break;
  case 2:
   ereport(LOG,
     (errmsg("duration: %s ms  statement: %s",
       msec_str, query_string),
      errhidestmt(true),
      errdetail_execute(parsetree_list)));
   break;
 }

 if (save_log_statement_stats)
  ShowUsage("QUERY STATISTICS");

 TRACE_POSTGRESQL_QUERY_DONE(query_string);

 debug_query_string = NULL;
}
代码很简单,第一种情况就只记录 duration,第二种情况就全都记录,对应到上面的现象。逻辑有点绕,总之就记住上面的行为就行了。
当然,也有注意事项
Statements that contain simple syntax errors are not logged even by the
log_statement=allsetting, because the log message is emitted only after basic parsing has been done to determine the statement type. In the case of extended query protocol, this setting likewise does not log statements that fail before the Execute phase (i.e., during parse analysis or planning). Setlog_min_error_statementtoERROR(or lower) to log such statements.Logged statements might reveal sensitive data and even contain plaintext passwords.
即使使用 log_statement = all 设置,也不会记录包含简单语法错误的语句,因为仅在完成基本解析以确定语句类型后才会发出日志消息。在扩展查询协议的情况下,此设置同样不会记录在执行阶段之前 (即在解析分析或规划期间) 失败的语句。将 log_min_error_statement 设置为 ERROR (或更低) 以记录此类语句。
记录的语句可能会泄露敏感数据,甚至包含明文密码。
log_min_duration_sample
另外,各位可能还发现了这个参数 log_min_duration_sample,这又是什么鬼?其实这是 13 的一个新特性,主要是为了预防高负载情况下,记录所有语句导致性能衰减的情况,
Log sample of slow queries Instead of all of them Prevent overload of system due to logging instead of log_min_duration_statement
而 log_min_duration_statement 的优先级更高,只有持续时间超过 log_min_duration_sample 的语句才会考虑进行采样
log_min_duration_sample:所需的最短语句持续时间 log_statement_sample_rate :采样率 (0.0 ~ 1.0)
也就是说,当 log_min_duration_sample < log_min_duration_statement 的时候,进行采样记录,而不是记录所有内容。
举个栗子:
log_min_duration_sample =  100
log_statement_sample_rate =  0.5
如果是这样的配置,那么将记录 50% 超过 100 ms 的查询。
log_min_duration_sample =  100
log_statement_sample_rate =  0.1
log_min_duration_statement =  500
如果长这样,那么就记录所有超过 500 毫秒的查询,同时采样记录超过 100 毫秒以上查询的 10%。
小结
让我们小结一下:
一般推荐使用 log_min_duration_statement,不仅会记录 SQL 语句,还会记录 SQL 执行时长,同时绑定变量也会记录 (BIND/EXECUTE 分别记录),第一选择👍🏻 如果真有高负载场景,不关注具体跑了哪些 SQL,只想看整体统计数据的话,那么可以打开 log_duration,关闭 log_min_duration_statement,因为 log_duration 会一股脑记录所有语句,但是不包括原始 SQL 如果 log_duration 为 on,log_min_duration_statement 也为 0,以 log_min_duration_statement 为准 如果 log_duration 为 on,log_min_duration_statement 为正数,所有的持续时间还是会被记录,但是仅记录超过 log_min_duration_statement 阈值的 SQL 原始语句,对于高负载情况,是个很不错的手段 如果仅打开了 log_statement 为 all,log_min_duration_statement 为 -1,log_duration 为 off,也可以看到绑定变量的值 (只能看到 EXECUTE 阶段) log_min_duration_sample 和 log_statement_sample_rate 用于采样,优先级低于 log_min_duration_statement。
因此,建议生产中,配置 log_min_duration_statement,log_statement 为 mod (避免设为 all,同时又没有配置 log_line_prefix 导致找不到源头),如果负载较高,可以配置采样。
如果这两篇内容都看完之后,还不懂怎么配置 PostgreSQL 日志的话,那就洗洗睡吧。
