


在Linux系统运维中,对系统各项指标的监控是至关重要的。这不仅能帮助我们了解系统的运行状态,还能在出现问题时及时提供报警和定位问题的依据。本文将详细介绍如何使用node_exporter与Prometheus来监控Linux系统的各项指标。
1. 常见的监控指标和参数
为了确保系统的稳定运行,我们需要关注以下指标:
CPU利用率:监控CPU的使用率,以了解系统的负载情况。 内存使用率:监控内存的使用情况,防止内存溢出。 磁盘空间利用率:监控磁盘的使用情况,确保有足够的存储空间。 网络流量:监控网络接口的传入和传出流量,以确保网络带宽的合理使用。 进程和服务状态:监控进程和服务的运行状态,确保它们正常运行。 系统负载:监控系统负载,以了解系统的整体压力。 文件系统的I/O活动:监控文件系统的输入输出活动,以发现潜在的性能问题。 用户登录和会话情况:关注当前登录的用户和会话信息,确保系统的安全性。 日志和错误信息:检查系统日志和错误消息,以及其他关键日志文件,以寻找潜在的问题和异常情况。
以上这些指标都可以通过node_exporter
(一个用于Linux系统的监控工具)来获取。
2. 下载node_exporter
你可以从GitHub上的Prometheus项目页面下载node_exporter
:https://github.com/prometheus/node_exporter/releases。建议选择一个稳定但不是最新版本的node_exporter
进行下载,以避免潜在的问题。下载完成后,将其上传到服务器上。
3. 环境准备
假设你有两台服务器,它们的IP地址和别名如下:
| IP地址 | 别名 |
|---|---|
| 10.1.5.56 | test-01 |
| 10.1.5.58 | test-02 |
4. 解压并试运行node_exporter
以test-02
服务器为例,首先上传node_exporter
的压缩包到服务器上,然后解压并尝试前台启动:
[root@loaclhost ~]# cd /home/jier/
[root@loaclhost jier]# ls
node_exporter-1.8.0.linux-386.tar.gz
[root@loaclhost jier]# tar xf node_exporter-1.8.0.linux-386.tar.gz
[root@loaclhost jier]# cd node_exporter-1.8.0.linux-386
[root@loaclhost node_exporter-1.8.0.linux-386]# ./node_exporter
运行后,你可以看到没有任何报错信息,并且node_exporter
监听的端口号是9100
。之后,你可以按Ctrl+C
中止它的运行。
5. 使用systemctl管理node_exporter
为了更方便地管理node_exporter
,我们可以使用systemctl
来创建和管理它的服务。首先,在test-01
服务器上查看Prometheus的服务文件作为参考:
[root@test-01 ~]# systemctl cat prometheus
然后,在test-02
服务器上创建一个类似的服务文件来管理node_exporter
:
[root@loaclhost ~]# vim /usr/lib/systemd/system/node-exporter.service
文件内容如下:
[Unit]
Description=Node-exporter-prometheus
After=network-online.target

[Service]
Type=simple
ExecStart=/usr/local/node_exporter/node_exporter
Restart=on-failure
ExecStop=/usr/bin/kill -9 MAINPID

[Install]
WantedBy=multi-user.target
接下来,将node_exporter
移动到指定的目录下:
[root@loaclhost ~]# mv /home/jier/node_exporter-1.8.0.linux-386 /usr/local/node_exporter
然后,使用systemctl
命令来控制node_exporter
:
[root@loaclhost ~]# systemctl daemon-reload
[root@loaclhost ~]# systemctl start node-exporter
[root@loaclhost ~]# systemctl status node-exporter
此时,你可以看到node-exporter
服务已经成功启动并运行。
6. 配置Prometheus以监控node_exporter
在test-01
服务器上进行Prometheus的配置。首先,找到Prometheus的配置文件路径:
[root@test-01 ~]# ps -ef | grep prometheus
然后,编辑Prometheus的配置文件,添加对test-02
服务器上node_exporter
的监控:
[root@test-01 ~]# vim /usr/local/prometheus/prometheus.yml
在配置文件中添加以下内容:
- job_name: "test-02"
  static_configs:
    - targets: ["test-02:9100"]
接着,修改test-01
服务器的hosts
文件,添加对test-02
的别名解析:
[root@test-01 ~]# cat /etc/hosts
添加以下内容:
10.1.5.58 test-02
最后,重启Prometheus服务:
[root@test-01 ~]# systemctl restart prometheus
登录Prometheus的Web界面,你可以看到test-02
服务器已经成功上线,并且可以查看到由node_exporter
收集的详细监控数据。
登录页面进行查看;
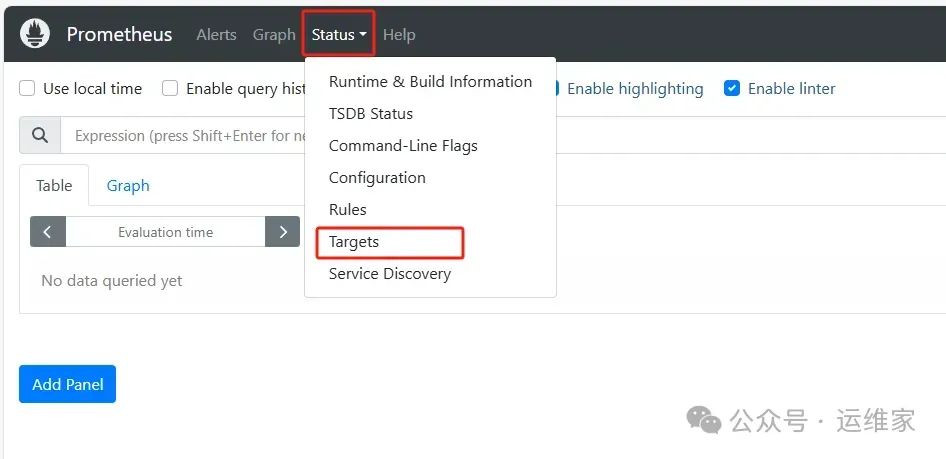
页面如下:
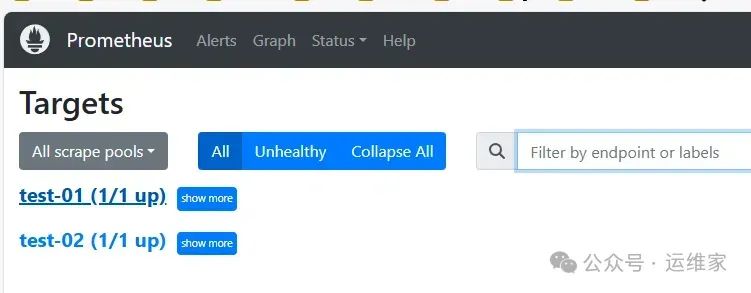
可以看到已经上线了,我们就可以点开看获取的详细内容了;
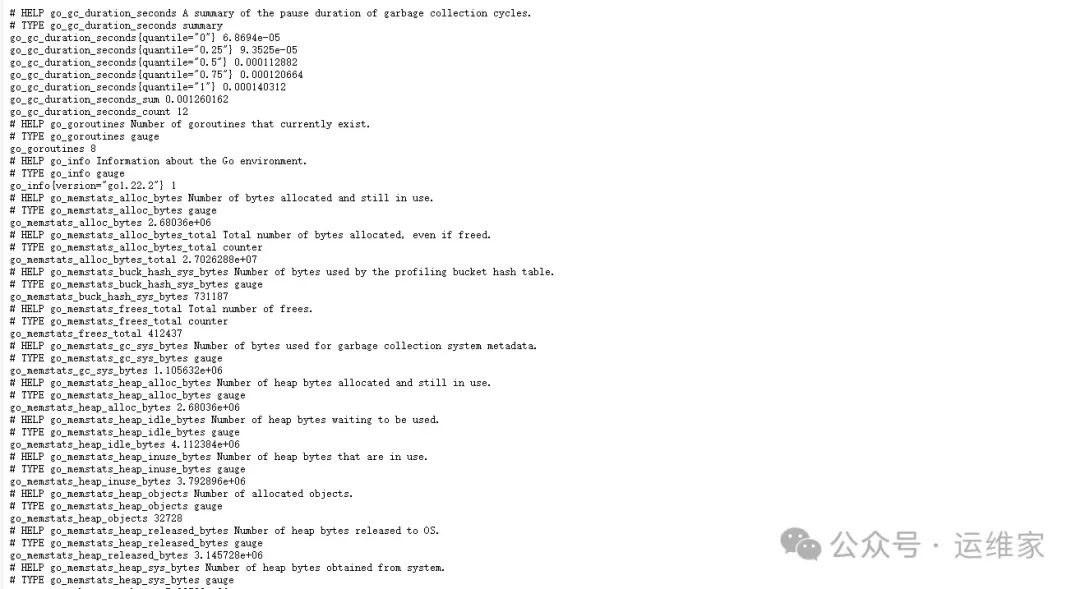
获取的监控数据如下:
这样,你就完成了对Linux系统的全面监控。
领取红包,能省则省
“🎉🎁 独家福利来啦!美团、饿了么、滴滴打车、菜鸟裹裹、电影票红包大放送!每天都有哦!🎁🎉
👀 快来瞅瞅,动动手指就能省下一笔!别错过,赶紧按照下方操作领取你的专属红包吧!👇

💬 如果你还有其他想要的红包类型,记得留言告诉我们哦,我们会尽力满足大家的需求!🎁💖”
