


0、报警信息
周末开发反馈数据库挂了,让我紧急处理。
1、定位原因
1.1、数据库报警
####这个报错意味着可能有大型事务,导致I/O太繁忙,或者根本没法写(磁盘有问题),一般是会有具体的信息在下边接着输出。
Fri Aug 16 22:39:07 2024
minact-scn: useg scan erroring out with error e:12751
Fri Aug 16 22:44:13 2024
minact-scn: useg scan erroring out with error e:12751

####ORA-00494表示获取不到资源,而且已经超过900秒了,需要查询他提供的trc日志
Fri Aug 16 22:46:12 2024
Errors in file /u01/app/oracle/diag/rdbms/cwtest1/cwtest1/trace/test1_ora_59865.trc  (incident=869788):
ORA-00494: enqueue [CF] held for too long (more than 900 seconds) by 'inst 1, osid 6072'
Incident details in: /u01/app/oracle/diag/rdbms/test1/test1/incident/incdir_869788/test1_ora_59865_i869788.trc
Fri Aug 16 22:46:27 2024
Errors in file /u01/app/oracle/diag/rdbms/test1/test1/trace/test1_ora_59929.trc  (incident=869780):
ORA-00494: enqueue [CF] held for too long (more than 900 seconds) by 'inst 1, osid 6072'
Incident details in: /u01/app/oracle/diag/rdbms/test1/test1/incident/incdir_869780/test1_ora_59929_i869780.trc
Fri Aug 16 22:46:42 2024
Errors in file /u01/app/oracle/diag/rdbms/test1/test1/trace/test1_ora_59967.trc  (incident=869804):
ORA-00494: enqueue [CF] held for too long (more than 900 seconds) by 'inst 1, osid 6072'
Incident details in: /u01/app/oracle/diag/rdbms/test1/test1/incident/incdir_869804/test1_ora_59967_i869804.trc

####6072进程被干掉了
Fri Aug 16 22:46:42 2024
Killing enqueue blocker (pid=6072) on resource CF-00000000-00000000 by (pid=59865)
 by killing session 3390.1
Killing enqueue blocker (pid=6072) on resource CF-00000000-00000000 by (pid=59865)
 by terminating the process
USER (ospid: 59865): terminating the instance due to error 2103
Fri Aug 16 22:46:42 2024
System state dump requested by (instance=1, osid=59865), summary=[abnormal instance termination].
System State dumped to trace file /u01/app/oracle/diag/rdbms/test1/test1/trace/test1_diag_6060_20240816224642.trc

##大量的这个报错直到数据库干掉
Fri Aug 16 22:46:43 2024
ORA-1092 : opitsk aborting process
Fri Aug 16 22:46:45 2024
ORA-1092 : opitsk aborting process
Termination issued to instance processes. Waiting for the processes to exit
Fri Aug 16 22:46:52 2024
ORA-1092 : opitsk aborting process
Fri Aug 16 22:46:52 2024
ORA-1092 : opitsk aborting process

##直到数据库自己也挂了
Fri Aug 16 22:46:57 2024
Instance termination failed to kill one or more processes
Instance terminated by USER, pid = 59865
alert日志报警
Unable to get enqueue on resource CF-00000000-00000000 (ges mode req=3 held=6)
Possible local blocker ospid=6072 sid=3390 sser=1 time_held=906 secs (ges mode req=6 held=4)
DUMP LOCAL BLOCKER: initiate state dump for KILL BLOCKER
  possible owner[12.6072] on resource CF-00000000-00000000
Dumping process info of pid[12.6072] requested by pid[272.59865]
Incident 869788 created, dump file: /u01/app/oracle/diag/rdbms/test1/test1/incident/incdir_869788/test1_ora_59
865_i869788.trc
ORA-00494: enqueue [CF] held for too long (more than 900 seconds) by 'inst 1, osid 6072'
ORA-32516: cannot wait for process 'Unix process pid: 6072, image: oracle@test1 (CKPT)' to finish executing ORADEB
UG command 'SHORT_STACK'; wait time exceeds 29820 ms
alert日志里提到的trace日志,提取了一些重复的关键报警日志
*** 2024-08-16 22:46:42.491
  ----------------------------------------
  SO: 0x8db25dd48, type: 2, owner: (nil), flag: INIT/-/-/0x00 if: 0x3 c: 0x3
   proc=0x8db25dd48, name=process, file=ksu.h LINE:12721, pg=0
  (process) Oracle pid:12, ser:1, calls cur/top: 0x8de4032e0/0x8de4032e0
            flags : (0x6) SYSTEM
            flags2: (0x100),  flags3: (0x10)
            intr error: 0, call error: 0, sess error: 0, txn error 0
            intr queue: empty
    ksudlp FALSE at location: 0
  (post info) last post received: 0 0 152
              last post received-location: kcbb.h LINE:2261 ID:kcbbza
              last process to post me: 0x8db25cc90 1 6
              last post sent: 0 0 9
              last post sent-location: ksq.h LINE:2015 ID:ksqrcl
              last process posted by me: 0x8db2e4a00 90 2
    (latch info) wait_event=0 bits=0x0
    Process Group: DEFAULT, pseudo proc: 0x8c3c13898
    O/S info: user: oracle, term: UNKNOWN, ospid: 6072
    OSD pid info: Unix process pid: 6072, image: oracle@cwtest1 (CKPT)
    ----------------------------------------
    SO: 0x8a006e8d0, type: 10, owner: 0x8db25dd48, flag: INIT/-/-/0x00 if: 0x1 c: 0x1
     proc=0x8db25dd48, name=FileOpenBlock, file=ksfd.h LINE:6688, pg=0
    (FOB) 0x8a006e8d0 flags=2050 fib=0x8bd8d09d0 incno=0 pending i/o cnt=0
     fname=/oradata/DATA15_01.dbf   ####这个路径下的数据文件据出现这个报警
     fno=15 lblksz=8192 fsiz=1966080
也提到了数据文件的异常,可惜看不懂什么意思,只看到提到了数据文件。
1.2、服务器报警
Aug 16 22:34:39 cwtest1 kernel: INFO: task jbd2/dm-2-8:4479 blocked for more than 120 seconds.
Aug 16 22:34:39 cwtest1 kernel: "echo 0 > /proc/sys/kernel/hung_task_timeout_secs" disables this message.
Aug 16 22:34:39 cwtest1 kernel: jbd2/dm-2-8     D ffff95b1fab4c100     0  4479      2 0x00000000
Aug 16 22:34:39 cwtest1 kernel: Call Trace:
Aug 16 22:34:39 cwtest1 kernel: [<ffffffff95d65ce0>] ? bit_wait+0x50/0x50
Aug 16 22:34:39 cwtest1 kernel: [<ffffffff95d67bc9>] schedule+0x29/0x70
Aug 16 22:34:39 cwtest1 kernel: [<ffffffff95d656a1>] schedule_timeout+0x221/0x2d0
Aug 16 22:34:39 cwtest1 kernel: [<ffffffff9566a0ce>] ? kvm_clock_get_cycles+0x1e/0x20
Aug 16 22:34:39 cwtest1 kernel: [<ffffffff95700f72>] ? ktime_get_ts64+0x52/0xf0
Aug 16 22:34:39 cwtest1 kernel: [<ffffffff9566a0ce>] ? kvm_clock_get_cycles+0x1e/0x20
Aug 16 22:34:39 cwtest1 kernel: [<ffffffff95d65ce0>] ? bit_wait+0x50/0x50
Aug 16 22:34:39 cwtest1 kernel: [<ffffffff95d6726d>] io_schedule_timeout+0xad/0x130
Aug 16 22:34:39 cwtest1 kernel: [<ffffffff95d67308>] io_schedule+0x18/0x20
Aug 16 22:34:39 cwtest1 kernel: [<ffffffff95d65cf1>] bit_wait_io+0x11/0x50
Aug 16 22:34:39 cwtest1 kernel: [<ffffffff95d65817>] __wait_on_bit+0x67/0x90
Aug 16 22:34:39 cwtest1 kernel: [<ffffffff95d65ce0>] ? bit_wait+0x50/0x50
Aug 16 22:34:39 cwtest1 kernel: [<ffffffff95d65981>] out_of_line_wait_on_bit+0x81/0xb0
Aug 16 22:34:39 cwtest1 kernel: [<ffffffff956c2dc0>] ? wake_bit_function+0x40/0x40
Aug 16 22:34:39 cwtest1 kernel: [<ffffffff95878c9a>] __wait_on_buffer+0x2a/0x30
Aug 16 22:34:39 cwtest1 kernel: [<ffffffffc0461801>] jbd2_journal_commit_transaction+0x1781/0x19b0 [jbd2]
Aug 16 22:34:39 cwtest1 kernel: [<ffffffff956d0880>] ? finish_task_switch+0x50/0x1c0
Aug 16 22:34:39 cwtest1 kernel: [<ffffffffc0466e89>] kjournald2+0xc9/0x260 [jbd2]
Aug 16 22:34:39 cwtest1 kernel: [<ffffffff956c2d00>] ? wake_up_atomic_t+0x30/0x30
Aug 16 22:34:39 cwtest1 kernel: [<ffffffffc0466dc0>] ? commit_timeout+0x10/0x10 [jbd2]
Aug 16 22:34:39 cwtest1 kernel: [<ffffffff956c1c31>] kthread+0xd1/0xe0
Aug 16 22:34:39 cwtest1 kernel: [<ffffffff956c1b60>] ? insert_kthread_work+0x40/0x40
Aug 16 22:34:39 cwtest1 kernel: [<ffffffff95d74c1d>] ret_from_fork_nospec_begin+0x7/0x21
Aug 16 22:34:39 cwtest1 kernel: [<ffffffff956c1b60>] ? insert_kthread_work+0x40/0x40
可以查到的是有块磁盘dm-2被堵塞超过120秒
[root@cwtest1 trace]# ll /dev/mapper/
total 0
crw-------. 1 root root 10, 236 Jun 24 09:30 control
lrwxrwxrwx. 1 root root       7 Jun 24 09:30 vg_backup-lv_backup -> ../dm-1
lrwxrwxrwx. 1 root root       7 Jun 24 09:30 vg_oradata-lv_oradata -> ../dm-0
lrwxrwxrwx. 1 root root       7 Jun 24 09:30 vg_u01-lv_u01 -> ../dm-2
可以查到设备的映射是数据库安装目录 /u01
1.3、数据库报告定位
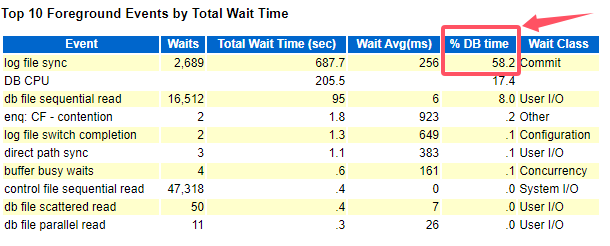
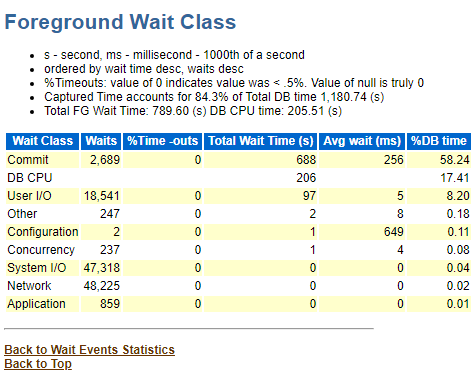
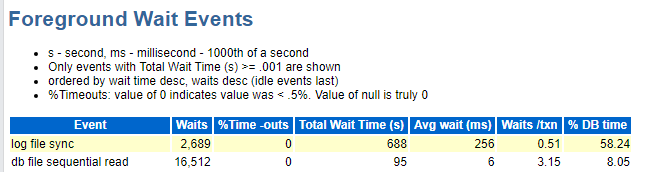
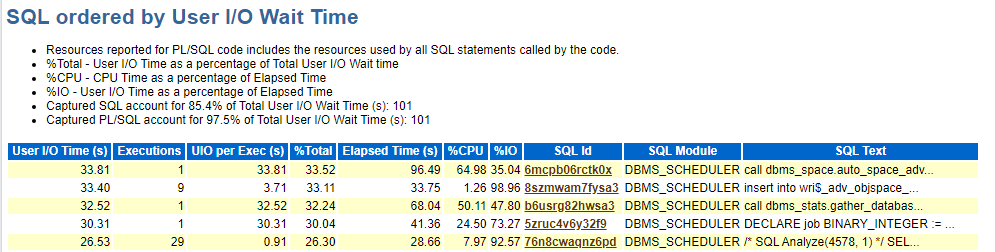
这个log file sync等待事件在 《DBA攻坚指南,左手Oracle,右手MySQL》有专门的一个章节
主要划分为以下几种可能:
1、事务过度提交,及应用程序过度提交或者回滚
SELECT TO_CHAR(FIRST_TIME, 'YYYY-MM-DD') DAY,
       TO_CHAR(SUM(DECODE(TO_CHAR(FIRST_TIME, 'HH24'), '00', 1, 0)), '999') "00",
       TO_CHAR(SUM(DECODE(TO_CHAR(FIRST_TIME, 'HH24'), '01', 1, 0)), '999') "01",
       TO_CHAR(SUM(DECODE(TO_CHAR(FIRST_TIME, 'HH24'), '02', 1, 0)), '999') "02",
       TO_CHAR(SUM(DECODE(TO_CHAR(FIRST_TIME, 'HH24'), '03', 1, 0)), '999') "03",
       TO_CHAR(SUM(DECODE(TO_CHAR(FIRST_TIME, 'HH24'), '04', 1, 0)), '999') "04",
       TO_CHAR(SUM(DECODE(TO_CHAR(FIRST_TIME, 'HH24'), '05', 1, 0)), '999') "05",
       TO_CHAR(SUM(DECODE(TO_CHAR(FIRST_TIME, 'HH24'), '06', 1, 0)), '999') "06",
       TO_CHAR(SUM(DECODE(TO_CHAR(FIRST_TIME, 'HH24'), '07', 1, 0)), '999') "07",
       TO_CHAR(SUM(DECODE(TO_CHAR(FIRST_TIME, 'HH24'), '08', 1, 0)), '999') "08",
       TO_CHAR(SUM(DECODE(TO_CHAR(FIRST_TIME, 'HH24'), '09', 1, 0)), '999') "09",
       TO_CHAR(SUM(DECODE(TO_CHAR(FIRST_TIME, 'HH24'), '10', 1, 0)), '999') "10",
       TO_CHAR(SUM(DECODE(TO_CHAR(FIRST_TIME, 'HH24'), '11', 1, 0)), '999') "11",
       TO_CHAR(SUM(DECODE(TO_CHAR(FIRST_TIME, 'HH24'), '12', 1, 0)), '999') "12",
       TO_CHAR(SUM(DECODE(TO_CHAR(FIRST_TIME, 'HH24'), '13', 1, 0)), '999') "13",
       TO_CHAR(SUM(DECODE(TO_CHAR(FIRST_TIME, 'HH24'), '14', 1, 0)), '999') "14",
       TO_CHAR(SUM(DECODE(TO_CHAR(FIRST_TIME, 'HH24'), '15', 1, 0)), '999') "15",
       TO_CHAR(SUM(DECODE(TO_CHAR(FIRST_TIME, 'HH24'), '16', 1, 0)), '999') "16",
       TO_CHAR(SUM(DECODE(TO_CHAR(FIRST_TIME, 'HH24'), '17', 1, 0)), '999') "17",
       TO_CHAR(SUM(DECODE(TO_CHAR(FIRST_TIME, 'HH24'), '18', 1, 0)), '999') "18",
       TO_CHAR(SUM(DECODE(TO_CHAR(FIRST_TIME, 'HH24'), '19', 1, 0)), '999') "19",
       TO_CHAR(SUM(DECODE(TO_CHAR(FIRST_TIME, 'HH24'), '20', 1, 0)), '999') "20",
       TO_CHAR(SUM(DECODE(TO_CHAR(FIRST_TIME, 'HH24'), '21', 1, 0)), '999') "21",
       TO_CHAR(SUM(DECODE(TO_CHAR(FIRST_TIME, 'HH24'), '22', 1, 0)), '999') "22",
       TO_CHAR(SUM(DECODE(TO_CHAR(FIRST_TIME, 'HH24'), '23', 1, 0)), '999') "23"
  FROM V$LOG_HISTORY
GROUP BY TO_CHAR(FIRST_TIME, 'YYYY-MM-DD')
ORDER BY 1 DESC;
2、存储IO资源紧张,导致LGWR进程写速度缓慢
sar
或者
iostat -x 3
3、CPU资源紧张,LGWR进程无法获得相应的CPU时间片
top
Shift + P
4、RAC节点之间的SCN同步
我这个是单机。
5、RAC节点之间CR(Consistent Read,读一致性)块传递
我这个是单机。
6、控制文件争用
与RMAN操作有关,可是我没开归档,或者多个会话更新控制文档。
7、LGWR提交方式
alter system set "_use_adaptive_log_file_sync"=TRUE scope=both;1.4、初步结论
数据库负载超低,磁盘异常,无法读写数据,数据库无法获取所需的资源,所以挂掉。
询问云平台的人:那天存储集群坏了一块盘,自动迁移到好的上面了,时间差不多正好能对上。
2、解决报警
2.1、尝试创建txt并读取
su - oracle
cd $ORACLE_BASE
touch aa.txt
cat aa.txt
2.2、开启监听
lsnrctl start
lsnrctl startus
2.3、开启数据库
sqlplus / as sysdba
startup;
select status from v$instance;
3、遗漏
这次推断还是用似是而非的方法推断,主要是还是询问云平台的人进行最终的判断。
trace日志看不懂,部分特定事件触发的单词不理解意思,还需要特有的10046或者oradebug收集错误信息。
关键是10046或者oradebug也不太熟练。
4、总结
不是我的锅!又是混日子的一天!欧耶!
「喜欢这篇文章,您的关注和赞赏是给作者最好的鼓励」
关注作者
【版权声明】本文为墨天轮用户原创内容,转载时必须标注文章的来源(墨天轮),文章链接,文章作者等基本信息,否则作者和墨天轮有权追究责任。如果您发现墨天轮中有涉嫌抄袭或者侵权的内容,欢迎发送邮件至:contact@modb.pro进行举报,并提供相关证据,一经查实,墨天轮将立刻删除相关内容。
