


这是性能调优三步曲包含以下文章,本文为第二篇:
第 1 部分:如何阅读 Vertica 的执行计划
第 2 部分:使用系统表排除 Vertica 查询性能故障
第 3 部分:重新设计查询优化投影
在对SQL进行优化时,第一步是分析执行计划,如[[Vertica 性能调优 - 1 如何阅读执行计划]]中所述。执行计划说明 Vertica 计划如何处理查询。执行计划描述了优化器根据查询访问的 Projection 和表统计信息计算出的成本最低计划。
但执行计划不提供有关查询实际执行过程中的任何信息。
您可以通过多种不同的方式分析 Vertica 查询性能。本文通过介绍与查询性能相关的系统表,帮助您进行 SQL 性能优化。
当您执行查询时,Vertica 会将信息存储在系统表中。这些信息告诉您在查询执行期间发生了什么?
- 正在执行哪些任务
- 正在使用哪些资源
- 可能存在的瓶颈
本文阐述了 Vertica 与查询执行信息相关的系统表,以及使用这些信息分析查询性能的方法。每个SQL、场景的性能调优的方法都不同,因此请根据具体的SQL、场景使用本文所提供的方法。
1、关于本文档
1.1 在管理控制台中分析查询
除了系统表之外,Vertica 管理控制台 (MC) 也提供了一个用户界面,进行查询性能分析。本文不讨论 MC。本文主要在 vsql 中使用 SQL 语句来检索查询性能信息。
有关管理控制台的详细信息,请参阅 Vertica 文档中的在 MC 中管理查询。
1.2 使用 vsql 变量进行查询示例
本文包含许多查询 Vertica 系统表的 SQL 语句示例。
这些系统表可帮助您找出性能瓶颈。主要是通过Transaction_id 和 statement_id来确定具体的 SQL 在系统表中的信息。
一旦确定了性能差的SQL的Transaction_id 和 statement_id ,将这些值分配给变量并将它们插入本文档示例中的查询中。这样,就不必在每个查询过滤条件中输入这些值。
将这些值分配给变量,如本例所示:
\set t_id 45035996274879950
\set s_id 1
2、识别长时间运行的查询
尝试优化 Vertica 数据库中的查询性能时,有两种策略:
- 优化系统中最慢的查询。
- 尝试优化特定查询。
本节介绍如何识别您感兴趣的查询。获得该 SQL 的Transaction_id和statement_id后,本文后续部分将解释如何使用这些 ID 获取更详细的信息。
2.1 QUERY_PROFILES 系统表
通过查询 QUERY_PROFILES 系统表,即可获取到长时间运行的查询。
2.2 示例查询
根据以下步骤获取长时间运行的查询
1、要获取19点-22点三个小时的时间段内 store_sales_fact 表上最慢的查询,可在 QUERY_PROFILES 表上运行如下查询:
SELECT DATE_TRUNC('second',query_start::TIMESTAMP),
       session_id,
       transaction_id,
       statement_id,
       node_name,
       LEFT(query,100),
       ROUND((query_duration_us/1000000)::NUMERIC(10,3),3) duration_sec
  FROM query_profiles
 WHERE query ILIKE '% store_sales_fact %'
   AND query_start BETWEEN '2024-08-24 19:00:00' AND '2024-08-24 22:00:00'
 ORDER BY duration_sec DESC;
2、如果您有 session_id,请缩小这些结果的范围。
查询 QUERY_PROFILES 表以返回该会话期间执行的所有查询,并确定它们执行所需的时间:
SELECT DATE_TRUNC('second',query_start::TIMESTAMP),
       session_id,
       transaction_id,
       statement_id,
       node_name,
       LEFT(query,100),
       ROUND((query_duration_us/1000000)::NUMERIC(10,3),3) duration_sec
  FROM query_profiles
  WHERE session_id = :s_id
  ORDER BY duration_sec DESC;
3、要获取指定时间段内最慢的查询,请尝试以下查询:
SELECT (query_duration_us/1000000)::NUMERIC(10,3) duration_sec,
       session_id,
       transaction_id,
       statement_id,
       node_name,
       LEFT(query,100)
  FROM query_profiles
 WHERE query_start BETWEEN '2024-08-24 19:00:00' AND '2024-08-24 22:00:00'
 ORDER BY duration_sec DESC;
2.3 结果分析
一旦确定了要分析的查询,请使用该查询的transaction_id和statement_id来提取完整的查询语句,以便您可以分析该查询:
SELECT query
  FROM query_profiles
 WHERE transaction_id = :t_id
   and statement_id = :s_id;
             query
----------------------------------
 SELECT * FROM online_sales_fact;
确定查询后,使用 PROFILE 关键字执行查询。
PROFILE 语句将所有查询执行信息保存在 EXECUTION_ENGINE_PROFILES 系统表中:
PROFILE SELECT * FROM online_sales.online_sales_fact;
NOTICE 4788: Statement is being profiled
HINT: Select * from execution_engine_profiles WHERE transaction_id=:t_id and statement_id=s_id;
NOTICE 3557: Initiator memory for query: [on pool general: 69620 KB, minimum: 69620 KB]
-[ RECORD 1 ]--------------+---------
sale_date_key              | 1730
ship_date_key              | 1735
product_key                | 7285
product_version            | 3
customer_key               | 23378
call_center_key            | 61
online_page_key            | 447
shipping_key               | 66
warehouse_key              | 66
promotion_key              | 629
pos_transaction_number     | 4730816
sales_quantity             | 5
sales_dollar_amount        | 292
3、分析查询执行以进行性能优化
现在您已经确定了运行缓慢的查询,您需要获取有关这些查询的更多信息,以确定导致性能问题的原因。
本文的其余部分使用查询示例数据库 VMart 的 SQL 语句。
3.1 分析查询执行
使用实时分析,您可以在执行长时间运行的查询时对其进行监控。所有语句在执行时都可以使用实时分析计数器。
可以在特定 SQL 语句上添加 PROFILE 关键字进行分析。如果不使用 PROFILE ,数据库不会在系统表 EXECUTION_ENGINE_PROFILES 中记录相关信息。
3.1.1 EXECUTION_ENGINE_PROFILES 系统表
EXECUTION_ENGINE_PROFILES 系统表包含有关查询执行的分析信息。
3.1.2 示例查询
在使用 PROFILE 关键字执行查询前,可以进行如下设置:
\timing--> 记录并在执行完成后返回执行时间\o /dev/null--> 不显示 SQL 的查询结果profile--> 将 SQL 执行过程相关信息存储在execution_engine_profiles系统表中,方便后续分析
\timing
\o /dev/null
profile
SELECT DISTINCT s.product_key,
       p.product_description
  FROM store.store_sales_fact s, public.product_dimension p
 WHERE s.product_key = p.product_key
   AND s.product_version = p.product_version
   AND s.store_key IN
     (SELECT store_k ey FROM store.store_dimension WHERE store_state = 'MA')
 ORDER BY s.product_key;
 \o
3.1.3 结果分析
上述查询返回以下信息,并将分析信息存储在 EXECUTION_ENGINE_PROFILES 系统表中。
NOTICE 4788: Statement is being profiled
HINT: Select * from v_monitor.execution_engine_profiles where transaction_ id=45035996274879950 and statement_id=1;
NOTICE 3557: Initiator memory for query: [on pool general: 1548488 KB, minimum: 1209481 KB]
<== 本 SQL 是在 general 资源池中执行

NOTICE 5077: Total memory required by query: [1548488 KB]
<== 查询所需的内存,受 SQL 执行所在的资源池限制

Time: First fetch (1000 rows): 718.507 ms. All rows formatted: 832.033 ms
<= 执行时间所需时间
PROFILE信息会告诉您资源池提供的内存是否足以执行查询。如果内存不足,请使用其他资源池进行配置文件分析。要使用其他资源池,需要具有使用该资源池的使用权限。
=> SET SESSION RESOURCE_POOL = <desired_pool>;
=> profile select ...
3.2 识别查询事件
每执行一次查询,都会包含两种类型的事件:
- 优化器事件:发生在优化器准备查询计划期间。
- 执行事件:发生在查询执行期间。
查询事件可以是正事件(可能有助于性能提升),也可以是负事件(可能会导致性能下降)。下表列出了一些查询事件的示例。
3.2.1 负优化器事件
| 负优化器事件 | 描述 |
|---|---|
| DELETE_WITH_NON_OPTIMIZED_PROJECTION | The Optimizer had to use a slower path to delete rows in a projection. 优化器必须使用较慢的路径来删除投影中的行。 |
| MEMORY_LIMIT_HIT | The Optimizer used all of its allocated memory while planning. 优化器在生成执行计划时使用了所有分配的内存。 |
| NO_HISTOGRAM | The Optimizer encountered a predicate on a column for which it does not have a histogram. 优化器在没有直方图的列上进行谓词过滤。 |
3.2.2 积极的优化器事件
| 积极的优化器事件 | 描述 |
|---|---|
| GROUPBY_PUSHDOWN | The Optimizer pushed a GroupBy past a join. 优化器将 GroupBy 推到了 join 之后。 |
| NO_GROUPBY_PUSHDOWN | The Optimizer couldn’t push a GroupBy past a join. 优化器无法将 GroupBy 推到了 join 之后。 |
| NODE_PRUNING | The Optimizer pruned a certain number of Vertica nodes from projection access. 优化器在访问 projection 时裁剪了一定数量的 Vertica 节点。 |
| TRANSITIVE_PREDICATE | The Optimizer created a transitive predicate due to a Join condition. 优化器根据关联条件对谓词过滤条件进行了传递。 |
3.2.3 负面执行引擎事件
| 负面执行引擎事件 | 描述 |
|---|---|
| GROUP_BY_SPILLED | GROUP BY key set did not fit in memory; using external sort grouping. GROUP BY 键集无法放入内存;使用外部排序分组。 |
| JOIN_SPILLED | Inner join did not fit in memory; using external sort merge join. 内连接表无法放入内存;使用外部排序合并连接。 |
| RESEGMENTED_MANY_ROWS | Many rows were resegmented during plan execution. 计划执行期间许多行被重新分段。 |
| WOS_SPILL | WOS is full. Data is spilling to a new ROS container. WOS 已满。数据正在溢出到新的 ROS 容器。 |
3.2.4 积极的执行引擎事件
| 积极的执行引擎事件 | 描述 |
|---|---|
| GROUP_BY_PREPASS_FALLBACK | In-memory prepass was disabled due to ineffectiveness. 由于无效,内存预处理已被禁用。 |
| MERGE_CONVERTED_TO_UNION | MERGE converted to UNION, followed by SORT. MERGE 转换为 UNION,然后进行 SORT。 |
| PARTITIONS_ELIMINATED | Some storage containers will not be processed because they contain no relevant data. 部分存储容器因不包含相关数据而被忽略不处理。 |
| RLE_OVERRIDDEN | Compressed execution will not be used on some columns, because the average run counts are not large enough. 部分列因访问次数较低而不会被压缩。 |
| SEQUENCE CACHE REFILLED | Session cache for a sequence has been used up. Taking a GLOBAL CATALOG X Lock to replenish the cache. 序列的会话缓存已用完。获取 GLOBAL CATALOG X 锁来补充缓存。 |
| SIP_FALLBACK | Sidewise Information Passing (SIPs) filter was disabled due to ineffectiveness. 侧向信息传递 (SIPs) 过滤器由于无效而被禁用。 |
| SMALL_MERGE_REPLACED | Small StorageMerge was replaced with StorageUnion for efficiency. 为了提高效率,小型 StorageMerge 已被 StorageUnion 取代。 |
3.2.5 QUERY_EVENTS 系统表
QUERY_EVENTS 系统表告诉您在查询执行期间发生了哪些事件。
3.2.5.1 示例
使用以下查询查看特定事务和语句的所有查询事件:
SELECT event_type, event_category,
       COUNT(DISTINCT node_name), COUNT(*)
  FROM query_events
 WHERE transaction_id = :t_id
   AND statement_id = :s_id
 GROUP BY 1,2
 ORDER BY 2;
        event_type       | event_category | count | count
-------------------------+----------------+-------+-------
MERGE_CONVERTED_TO_UNION | EXECUTION      |     3 |    3
SMALL_MERGE_REPLACED     | EXECUTION      |     3 |    9
(2 rows)
使用以下查询查看事件发生时的路径详细信息。
SELECT node_name,
       event_type,
       event_description,
       operator_name,
       path_id,
       event_details,
       suggested_action
  FROM query_events
 WHERE transaction_id = :t_id
   AND statement_id = :s_id
 ORDER BY node_name;

-[ RECORD 1 ]-----+-------------------------------------------------------------
node_name         | v_vmart_node0001
event_type        | MERGE_CONVERTED_TO_UNION
event_description | Merge converted to union, followed by sort.
operator_name     | Sort
path_id           | -1
event_details     | Projection: public.result_table_b0
suggested_action  |
-[ RECORD 2 ]-----+-------------------------------------------------------------
node_name         | v_vmart_node0001
event_type        | SMALL_MERGE_REPLACED
event_description | Small StorageMerge replaced with StorageUnion for efficiency
operator_name     | StorageMerge
path_id           | 4
event_details     | Projection: public.new_addresses_b0
suggested_action  |
-[ RECORD 3 ]-----+-------------------------------------------------------------
node_name         | v_vmart_node0001
event_type        | GROUP_BY_SPILLED
event_description | GROUP BY key set did not fit in memory, using external sort grouping.
operator_name     | GroupByHash
path_id           | 4
event_details     |
suggested_action  | Consider a sorted projection. Increase memory available to the plan.
-[ RECORD 4 ]-----+------------------------------------------------------------
node_name         | v_vmart_node0001
event_type        | RESEGMENTED_MANY_ROWS
event_description | Many rows were resegmented during plan execution.
operator_name     | NetworkSend
path_id           | 2
event_details     |
suggested_action  | Consider different projection segmentation.
-[ RECORD 5 ]-----+-------------------------------------------------------------
...
-[ RECORD 11 ]-----+-------------------------------------------------------------
node_name          | v_vmart_node0003
event_type         | SMALL_MERGE_REPLACED
event_description  | Small StorageMerge replaced with StorageUnion for efficiency
operator_name      | StorageMerge
path_id            | 4
event_details      | Projection: public.new_addresses_b0
suggested_action   |
...
3.2.5.2 结果分析
对于所有负面事件,可根据 suggested_action 字段所提供的建议,看看是否能提高该查询的性能。
3.3 确定查询阶段执行时间
在正常情况下,查询执行所需时间大部分发生在 ExecutePlan 阶段。但有时情况并非如此。在查询执行的其他阶段花费大量时间可能表示系统存在问题,需要进一步分析。
3.3.1 DC_QUERY_EXECUTIONS 系统表
可通过查询 DC_QUERY_EXECUTIONS 表,获取每个查询阶段所用的时间,
初始化节点上的执行时间与非初始化节点上的执行时间不同,因为初始化节点必须执行额外的任务。
3.3.1.1 案例
在以下查询中,v_vmartdb_node0001(本地节点)是初始化节点。正如预期的那样,ExecutePlan 阶段比其他阶段长得多。
SELECT dc_query_executions.node_name,
       dc_query_executions.transaction_id,
       dc_query_executions.statement_id,
       dc_query_executions.execution_step,
       ((dc_query_executions.completion_time - dc_query_executions."time")) AS duration
 FROM v_internal.dc_query_executions
WHERE transaction_id = :t_id
  AND statement_id = :s_id
  AND node_name = ( SELECT local_node_name())
ORDER BY dc_query_executions."time";

     node_name     |   transaction_id  | statement_id |        execution_step        | duration
-------------------+-------------------+--------------+------------------------------+-----------------
v_vmartdb_node0001 | 45035996274879950 |            1 | Plan                         | 00:00:00.020269
v_vmartdb_node0001 | 45035996274879950 |            1 | InitPlan                     | 00:00:00.001941
v_vmartdb_node0001 | 45035996274879950 |            1 | SerializePlan                | 00:00:00.001025
v_vmartdb_node0001 | 45035996274879950 |            1 | PreparePlan                  | 00:00:00.01296
v_vmartdb_node0001 | 45035996274879950 |            1 | PreparePlan:TakeTableLocks   | 00:00:00.000005
v_vmartdb_node0001 | 45035996274879950 |            1 | PreparePlan:DistPlanner      | 00:00:00.000565
v_vmartdb_node0001 | 45035996274879950 |            1 | PreparePlan:LocalPlan        | 00:00:00.001329
v_vmartdb_node0001 | 45035996274879950 |            1 | PreparePlan:EEcompile        | 00:00:00.00162
v_vmartdb_node0001 | 45035996274879950 |            1 | CompilePlan                  | 00:00:00.009477
v_vmartdb_node0001 | 45035996274879950 |            1 | CompilePlan:ReserveResources | 00:00:00.000046
v_vmartdb_node0001 | 45035996274879950 |            1 | CompilePlan:EEpreexecute     | 00:00:00.005646
v_vmartdb_node0001 | 45035996274879950 |            1 | ExecutePlan                  | 00:00:00.756467
v_vmartdb_node0001 | 45035996274879950 |            1 | AbandonPlan                  | 00:00:00.004101
(13 rows)
检查执行节点 v_vmartdb_node0002 :
SELECT dc_query_executions.node_name,
       dc_query_executions.transaction_id,
       dc_query_executions.statement_id,
       dc_query_executions.execution_step,
       ((dc_query_executions.completion_time - dc_query_executions."time")) AS duration
 FROM v_internal.dc_query_executions
WHERE transaction_id = :t_id
  AND statement_id = :s_id
  AND node_name = 'v_test_db_node0002'
ORDER BY dc_query_executions."time";
     node_name     |   transaction_id  | statement_id |        execution_step        | duration
-------------------+-------------------+--------------+------------------------------+-----------------
v_vmartdb_node0002 | 45035996274879950 |            1 | PreparePlan:DeserializePlan  | 00:00:00.009016
v_vmartdb_node0002 | 45035996274879950 |            1 | PreparePlan:TakeTableLocks   | 00:00:00.000009
v_vmartdb_node0002 | 45035996274879950 |            1 | PreparePlan:DistPlanner      | 00:00:00.000168
v_vmartdb_node0002 | 45035996274879950 |            1 | PreparePlan:LocalPlan        | 00:00:00.002264
v_vmartdb_node0002 | 45035996274879950 |            1 | PreparePlan:EEcompile        | 00:00:00.009847
v_vmartdb_node0002 | 45035996274879950 |            1 | CompilePlan:ReserveResources | 00:00:00.000116
v_vmartdb_node0002 | 45035996274879950 |            1 | CompilePlan:EEpreexecute     | 00:00:00.019912
3.3.1.2 结果分析
要理解这些结果,您需要了解每个查询执行阶段发生的情况。下表描述了每个阶段以及该阶段可能发生的、影响查询性能的情况。
| Phase(s) | 描述 | 性能问题的可能原因 |
|---|---|---|
| Plan InitPlan SerializePlan AbandonPlan |
这些阶段仅发生在初始化节点上。 | 这些阶段中出现的任何性能问题都意味着优化器生成执行计划所花的时间比预期的要长。 这些阶段的缓慢通常与并发有关。 优化器在生成执行计划时需要申请 catalog 锁。 其次,当 UDP 存在问题时,也会导致 Vertica 使用 spread将要执行的计划发送到其他节点或将 AbandonPlan 消息发送到其他节点时性能慢。 |
| ExecutePlan | 此阶段是查询的实际执行过程。 Vertica 将有关查询执行的详细信息存储在 EXECUTION_ENGINE_PROFILES 中。 |
如果查询缓慢发生在 ExecutePlan 阶段,请使用 EXECUTION_ENGINE_PROFILES 表上的接下来的几个示例查询来找出缓慢的根本原因。 |
| CompilePlan | 此阶段在所有节点上执行,分为以下两个部分: 第一部分:ReserveResources 阶段,显示 Vertica 进程预留资源所用的时间。 第二部分:EEpreexecute 阶段。EEpreexecute 阶段准备系统执行特定操作符。 |
EEPrexecute 时间的长度取决于 operator,可能包括分配内存、启动线程和打开网络连接等任务。 |
3.4 确定顶级运算符的使用情况
运算符是处理数据然后将数据移动到下一个运算符的执行引擎组件。
3.4.1 EXECUTION_ENGINE_PROFILES 系统表
EXECUTION_ENGINE_PROFILES 表存储每个操作符所花费的时间,可以在 EXECUTION_ENGINE_PROFILES 表中每个操作符counter_name = 'initialization time (us)'值中看到。
如果查询在 ExecutePlan 阶段很慢,您可以在 EXECUTION_ENGINE_PROFILES 系统表中找到有关该阶段的更多信息。
EXECUTION_ENGINE_PROFILES 表可能包含数千行,因此您需要对此表数据进行适当的汇总。
为了获得最佳结果,请按OPERATOR_NAME,PATH_ID和NODE_NAME进行汇总分析。
以下运算符可能会出现在查询计划中。
| Operators | 描述 | 注意 |
|---|---|---|
| COPY | During load, makes a copy of the data for buddy projections. 在数据加载期间,复制数据生成 buddy projections 。 |
|
| DataTarget | During load, writers data to the WOS or ROS. 在加载期间,将数据写入 WOS 或 ROS。 |
|
| ExprEval | Evaluations expressions, for example C1+C2. 评估表达式,例如 C1+C2。 |
Select only the columns that you need to evaluate the expression. 仅选择需要评估表达式的列。 |
| Filter | Filters tuples to the next operator. 过滤数据到下一个运算符。 |
|
| GroupByHash | Aggregates tuples in a hash in memory. 在内存中以哈希形式汇总数据。 |
This operator uses all available memory. If the operator doesn’t have enough memory, data spills to disk. This operator must complete before the next operator starts. 此运算符使用所有可用内存。 如果运算符没有足够的可用内存,数据会溢出到磁盘。 此运算符完成后才能开始下一步运算符。 |
| GroupByPipe | Aggregates tuples that are sorted in order to stream data to the next operator. 聚合已排序的数据以便将数据传输到下一个运算符。 |
Uses less memory than a hash join. 比哈希关联使用更少的内存。 |
| JoinMerge | Joins pre-sorted tuples. 关联预先排序的数据。 |
Uses less memory than a hash join. 比哈希关联使用更少的内存。 |
| JoinHash | Joins tuples that are not presorted by loading the inner side of a join in memory. 通过将 inner 表加载到内存来关联无序的数据。 |
If the inner join is large and does not fit in memory, the query fails. If the inner join is small, JoinHash can be faster than JoinMerge 如果inner表过大无法放进内存,则查询失败。 如果inner表是小表,则JoinHash会比JoinMerge快。 |
| Load | Loads data from disk and parses the input. 从存储加载数据并解析。 |
|
| Merge | Merges data streams in one sorted stream. 将数据流合并到一个已排序的流中。 |
|
| NetworkRecv NetworkSend |
Amount of data that is sent to or received from other nodes. 通过网络发送到其他节点或从其他节点接收到的数据量。 |
Try to design your projections so that this operator doesn’t occur in the middle of your query plan. Data is streamed in a single thread. For each pair of network operators (send/receive), more memory is required so more memory is reserved for the query. Memory requests for data buffers increase proportionally with the number of nodes. 对projection进行优化,以避免此运算符出现在执行计划中。 数据是单线程传输。 对于每对网络运算符(发送/接收)都需要更多内存,因此查询也会使用更多内存。 数据缓冲区的内存请求与节点数量成比例增加。 |
| ParallelMerge | Combines sorted data streams. 合并已排序的数据流。 |
|
| ParallelUnion | Combines data streams, not necessarily sorted. 组合数据流,不一定需要排序。 |
|
| Root | The first operator. 执行计划的第一步。 |
|
| Scan | Reads data from disk and applies filter. 从磁盘中读取数据并应用过滤器(谓词条件过滤)。 |
|
| Sort | Sorts a data stream. 对数据进行排序。 |
|
| StorageMerge | Combines storage, retaining the sort order. 合并存储,保留排序顺序。 |
|
| StorageUnion | Combines storage without retaining the sort order. 合并存储但不保留排序顺序。 |
|
| TopK | Analytic function that returns the top N tuples. 返回前 N 条数据的分析函数。 |
|
| Val | Evaluates expressions in joins such as tableA.C1=tableB.C2. 评估关联中的表达式,例如 tableA.C1=tableB.C2。 |
3.4.2 示例查询:获取最慢的路径和运算符
以下查询有助于获取最慢的路径以及在该路径上执行的执行引擎运算符。
对于具有许多路径和运算符的慢速查询,请将分析重点放在可能存在性能问题的路径和运算符上。
注意:
此查询中的聚合可能会产生误导,因为它会计算每个运算符的总数,而不考虑有多少个节点或线程在并行执行。
SELECT operator_name,
	   path_id,
	   SUM(counter_value)
  FROM execution_engine_profiles
 WHERE transaction_id = :t_id
   AND statement_id = :s_id
   AND counter_name ILIKE 'execution%'
 GROUP BY operator_name, path_id
 ORDER BY 3 DESC
 LIMIT 20;
 operator_name | path_id | sum
---------------+---------+---------
 Scan          |       5 | 1501914
 Join          |       4 |  659055
 GroupByHash   |       2 |  307442
 StorageUnion  |       2 |  120715
 Join          |       3 |  111232
 Root          |      -1 |   34964
 ExprEval      |       3 |   31785
 NetworkSend   |       2 |   27947
 ParallelUnion |       2 |   13525
 GroupByPipe   |       2 |    7594
 NetworkRecv   |       2 |    6775
 Scan          |       6 |    6292
 NetworkSend   |       6 |    5328
 NetworkRecv   |       6 |    3683
 GroupByPipe   |       8 |    1865
 StorageUnion  |       6 |    1312
 NetworkRecv   |       8 |    1118
 NewEENode     |      -1 |     955
 Scan          |       8 |     879
 ParallelMerge |       2 |     715
(20 rows)
3.4.3 示例查询:按节点获取最慢的路径和运算符
要按节点查看最慢的路径和运算符,请按 node_name 进行汇总,如下一个查询所示。
如果一个节点的执行时间比其他节点长,则可能存在数据倾斜的问题,或者最慢的节点可能由于其他原因而变慢。
例如,
如果 SCAN 运算符很慢,并且一个节点比其他节点慢,则该节点的磁盘IO性能可能比其他节点慢。如果是这种情况,请使用 vioperf 查看节点的 I/O 吞吐量。
如果 NetworkSend 运算符很慢,则可能存在网络问题。使用 netstat 查看是否存在任何 TPC 包问题或者使用 vnetperf 检查每个节点的网络性能。
SELECT node_name,
       operator_name,
       path_id,
       SUM(counter_value) sum_time,
       COUNT(DISTINCT operator_id) num_operators
  FROM dc_execution_engine_profiles
 WHERE transaction_id = :t_id
   AND statement_id = :s_id
   AND counter_name ILIKE 'execution%'
 GROUP BY node_name, operator_name, path_id
 ORDER BY 4 DESC
 LIMIT 20;
     node_name      | operator_name | path_id | sum_time | num_operators
--------------------+---------------+---------+----------+---------------
 v_vmartdb_node0001 | Scan          |       5 |   544160 |             2
 v_vmartdb_node0003 | Scan          |       5 |   498164 |             2
 v_vmartdb_node0002 | Scan          |       5 |   459590 |             2
 v_vmartdb_node0001 | Join          |       4 |   225466 |             2
 v_vmartdb_node0002 | Join          |       4 |   223134 |             2
 v_vmartdb_node0003 | Join          |       4 |   210455 |             2
 v_vmartdb_node0002 | GroupByHash   |       2 |   106011 |             4
 v_vmartdb_node0001 | GroupByHash   |       2 |   105288 |             4
 v_vmartdb_node0003 | GroupByHash   |       2 |    96143 |             4
 v_vmartdb_node0001 | StorageUnion  |       2 |    40551 |             2
 v_vmartdb_node0002 | StorageUnion  |       2 |    40251 |             2
 v_vmartdb_node0003 | StorageUnion  |       2 |    39913 |             2
 v_vmartdb_node0001 | Join          |       3 |    37540 |             2
 v_vmartdb_node0003 | Join          |       3 |    37466 |             2
 v_vmartdb_node0002 | Join          |       3 |    36226 |             2
 v_vmartdb_node0001 | Root          |      -1 |    34964 |             1
 v_vmartdb_node0001 | ExprEval      |       3 |    10858 |             2
 v_vmartdb_node0001 | NetworkSend   |       2 |    10780 |             2
 v_vmartdb_node0003 | ExprEval      |       3 |    10543 |             2
 v_vmartdb_node0002 | ExprEval      |       3 |    10384 |             2
(20 rows)
num_operators列显示有多少个运算符并行运行以计算查询结果。此计数通常由 EXECUTIONPARALLELISM 资源池管理。但是,根据其他条件(例如 ROS 容器的数量),并发运算符的数量可能小于资源池配置指定的值。
3.4.4 示例查询:查看计数器详细信息
确定最慢的路径后,从该路径中每个运算符的计数器获取更多详细信息。
每个运算符都有不同的计数器。下表描述了可能提供有关查询性能的一些见解的计数器。
| Counter | 描述 |
|---|---|
| execution time (us) | CPU time spent by thread, excluding wait time. 线程花费的 CPU 时间,不包括等待时间。 |
| clock time (us) | Time intervals of an operator, including wait time 操作员的时间间隔,包括等待时间 |
| initialization time (us) | Time spent initializing an operator. This time can include tasks such as allocating memory, starting threads, and opening network connections. Each operator performs different tasks. 初始化操作符所花费的时间。 此时间可能包括分配内存、启动线程和打开网络连接等任务。 每个操作符执行不同的任务。 |
| start time end time (us) |
Start/stop time of a single operator 单个操作符的起止时间 |
| rows processed | Data rows processed by the operator. 经过操作符处理的数据行数。 |
| input queue wait (us) | Time spent by the Execution Engine waiting for upstream operators. 执行引擎等待上游操作符所花费的时间。 |
| memory reserved (bytes) | Memory requested by the Optimizer to the Resource Manager. The Optimizer uses statistics to estimate how much memory will be needed. 优化器向资源管理器请求的内存。 优化器使用统计信息来估计需要多少内存。 |
| memory allocated (bytes) | Memory allocated by the Execution Engine operators when executing the query. When the query startsm, the memory is reserved, but the memory is not allocated until the operators need it. 执行引擎操作符在执行查询时分配的内存。 查询启动时,会保留内存,但直到操作符需要时才会分配内存。 |
| file handles | The number of files that need to be opened. This number depends on the number of columns and ROS containers that need to be opened to read the needed information. 需要打开的文件数。 此数量取决于读取所需信息需要打开的列数和 ROS 容器数。 |
| bytes received bytes sen |
Number of bytes received or sent by the query. 查询接收或发送的字节数。 |
| rows received rows sent |
Number of data rows received and sent by the query. 查询接收和发送的数据行数。 |
| RLE rows produces | Number of tuples produced by the operator that are still in RLE format as stored on disk. Shows that Vertica has not materialized the column and the operator was able to work with compressed data. 操作符生成的数据量,这些数据在磁盘上存储时仍为 RLE 格式。 表明 Vertica 尚未具体化列,并且操作符能够处理压缩数据。 |
| rows produced | Number of logical rows produced by the operator. 操作符生成的逻辑行数。 |
| consumer stall (us) | Amount of time that the operator is waiting to get data from the previous operator. 操作符等待从前一个操作符获取数据的时间。 |
| size of raw temp data (bytes) |
The size of the data that spilled to disk. 溢出到磁盘的数据的大小。 |
以下查询返回本地节点上本地路径中所有计数器的详细信息和平均值。
如果所有节点上的执行时间都相似,则仅在本地节点上过滤数据,以便您的分析查询执行得更快并使用更少的资源。要将分析过滤到本地节点,请使用函数 LOCAL_NODE_NAME。如果一个节点比其他节点慢,请在最慢的节点上执行分析。
count 列表示每个操作符的并行执行实例数。
avg 列表示所有节点上每个计数器的平均值。
=> \set path_id 5
=> SELECT operator_name,
          counter_name,
          path_id,
          COUNT(DISTINCT operator_id),
          AVG(counter_value)
     FROM execution_engine_profiles
    WHERE transaction_id = :t_id
      AND statement_id = :s_id
      AND path_id = :path_id
      AND node_name = ( SELECT LOCAL_NODE_NAME())
    GROUP BY 1,2,3
   HAVING SUM(counter_value) > 0
    ORDER BY 1;
 operator_name |                  counter_name                 | path_id | count | avg
---------------+-----------------------------------------------+---------+-------+-----
 Scan          | blocks analyzed by SIPs expression            |       5 |     2 | 40636
 Scan          | bytes read from cache                         |       5 |     2 | 23560280
 Scan          | bytes read from disk                          |       5 |     2 | 7970589
 Scan          | clock time (us)                               |       5 |     2 | 647620
 Scan          | current memory padding (bytes)                |       5 |     2 | 2592620
 Scan          | current unbalanced memory allocations (count) |       5 |     2 | 330
 Scan          | current unbalanced memory capacity (bytes)    |       5 |     2 | 4210688
 Scan          | current unbalanced memory overhead (bytes)    |       5 |     2 | 6720
 Scan          | current unbalanced memory padding (bytes)     |       5 |     2 | 996
 Scan          | current unbalanced memory requested (bytes)   |       5 |     2 | 2026748
 Scan          | end time                                      |       5 |     2 | 2914941832314339
 Scan          | estimated rows produced                       |       5 |     2 | 60000000
 Scan          | execution time (us)                           |       5 |     2 | 544160
 Scan          | initialization time (us)                      |       5 |     2 | 430
 Scan          | memory allocated (bytes)                      |       5 |     2 | 4488072
 Scan          | number of cancel requests received            |       5 |     2 | 12
 Scan          | peak file handles                             |       5 |     2 | 12
 Scan          | peak memory allocations (count)               |       5 |     2 | 54
 Scan          | peak memory padding (bytes)                   |       5 |     2 | 2592620
 Scan          | peak memory requested (bytes)                 |       5 |     2 | 1693456
 Scan          | peak unbalanced memory allocations (count)    |       5 |     2 | 332
 Scan          | peak unbalanced memory capacity (bytes)       |       5 |     2 | 4210688
 Scan          | peak unbalanced memory overhead (bytes)       |       5 |     2 | 6720
 Scan          | peak unbalanced memory padding (bytes)        |       5 |     2 | 996
 Scan          | peak unbalanced memory requested (bytes)      |       5 |     2 | 2092284
 Scan          | rle rows produced                             |       5 |     2 | 404250
 Scan          | rows filtered by SIPs expression              |       5 |     2 | 9595008
 Scan          | rows processed                                |       5 |     2 | 9999258
 Scan          | rows processed by SIPs expression             |       5 |     2 | 10060698
 Scan          | rows produced                                 |       5 |     2 | 404250
 Scan          | start time                                    |       5 |     2 | 291494183123736
以下查询将特定计数器值标识为转置值,以便您轻松比较路径和操作符。您的具体用例决定了您感兴趣的计数器。
=> SELECT path_id,
          operator_name,
          COUNT(DISTINCT operator_id) num_operators,
          COUNT(DISTINCT node_name) num_nodes ,
          SUM(DECODE(counter_name, 'bytes received', counter_value, NULL)) AS 'bytes_received' ,
          SUM(DECODE(counter_name, 'bytes sent', counter_value, NULL)) AS 'bytes_sent' ,
          SUM(DECODE(counter_name, 'execution time (us)', counter_value, NULL)) AS 'execution_time_us' ,
          SUM(DECODE(counter_name, 'rows received', counter_value, NULL)) AS 'rows_received' ,
          SUM(DECODE(counter_name, 'rle rows produced', counter_value, NULL)) AS 'rle_rows_produced' ,
          SUM(DECODE(counter_name, 'rows produced', counter_value, NULL)) AS 'rows_prod' ,
          SUM(DECODE(counter_name, 'consumer stall (us)', counter_value, NULL)) AS 'cons_stall' ,
          SUM(DECODE(counter_name, 'producer stall (us)', counter_value, NULL)) AS 'prod_stall' ,
          SUM(DECODE(counter_name, 'cumulative size of raw temp data (bytes)', counter_value, NULL)) AS 'temp_data'
     FROM execution_engine_profiles
    WHERE transaction_id= :t_id
      AND statement_id= :s_id
      AND node_name = (SELECT LOCAL_NODE_NAME())
    GROUP BY 1, 2
    ORDER BY 1, 2;
 path_id | operator_name | num_operators | num_nodes | bytes_received | bytes_sent | execution_time_us | rows_received | rle_rows_produced | rows_produced | consumer_stall | producer_stall | cumulative size of raw temp data
---------+---------------+---------------+-----------+----------------+------------+-------------------+---------------+-------------------+---------------+----------------+----------------+----------------------------------
      -1 | NewEENode     |             1 |         1 |                |            |               907 |               |             55619 |         55619 |                |                |
      -1 | Root          |             1 |         1 |                |            |             34964 |               |                   |         55619 |                |                |
       2 | GroupByHash   |             4 |         1 |                |            |            105288 |               |             56086 |         56086 |                |                |                                0
       2 | GroupByPipe   |             2 |         1 |                |            |              2356 |               |            404250 |        404250 |                |                |
       2 | NetworkRecv   |             2 |         1 |        1659961 |            |              4353 |         93335 |             93335 |         93335 |                |                |
       2 | NetworkSend   |             2 |         1 |                |     673086 |             10780 |               |             31144 |         31144 |         2539735|          67437 |
       2 | ParallelMerge |             1 |         1 |                |            |               239 |               |             18621 |         18621 |                |                |
       2 | ParallelUnion |             3 |         1 |                |            |              4138 |               |             75181 |         75181 |                |                |
       2 | StorageUnion  |             2 |         1 |                |            |             40551 |               |            404250 |        404250 |                |                |
       3 | ExprEval      |             2 |         1 |                |            |             10858 |               |            404250 |        404250 |                |                |
       3 | Join          |             2 |         1 |                |            |             37540 |               |            404250 |        404250 |                |                |                                0
       4 | Join          |             2 |         1 |                |            |            225466 |               |            404250 |        404250 |                |                |                                0
       5 | Scan          |             2 |         1 |                |            |            544160 |               |            404250 |        404250 |                |                |
       6 | NetworkRecv   |             1 |         1 |        1073992 |            |               635 |         60000 |             60000 |         60000 |                |                |
       6 | NetworkSend   |             1 |         1 |                |    1075688 |              2887 |               |             20045 |         20045 |           34962|              0 |
       6 | Scan          |             1 |         1 |                |            |              2550 |               |             20045 |         20045 |                |                |
       6 | StorageUnion  |             1 |         1 |                |            |               428 |               |             20045 |         20045 |                |                |
       8 | GroupByHash   |             1 |         1 |                |            |                21 |               |                 4 |             4 |                |                |                                0
       8 | GroupByPipe   |             1 |         1 |                |            |               612 |               |                 8 |             8 |                |                |
       8 | NetworkRecv   |             1 |         1 |            100 |            |               417 |            10 |                10 |            10 |                |                |
       8 | NetworkSend   |             1 |         1 |                |        102 |                11 |               |                 4 |             4 |           15432|              0 |
       8 | Scan          |             1 |         1 |                |            |               354 |               |                 4 |             8 |                |                |
       8 | StorageUnion  |             1 |         1 |                |            |               165 |               |                 8 |             8 |                |                |
(23 rows)
以下查询将特定计数器值标识为转置值,以便您可以轻松地比较不同路径和操作符中的计数器值。您的特定用例决定了您需要评估的计数器。
=> SELECT path_id,
          operator_name,
          count(distinct operator_id) num_operators,
          count(distinct node_name) num_nodes ,
          sum(DECODE(counter_name, 'bytes received', counter_value, NULL)) AS 'bytes_received' ,
          sum(DECODE(counter_name, 'bytes sent', counter_value, NULL)) AS 'bytes_sent' ,
          sum(DECODE(counter_name, 'execution time (us)', counter_value, NULL)) AS 'execution_time_us' ,
          sum(DECODE(counter_name, 'rows received', counter_value, NULL)) AS 'rows_received' ,
          sum(DECODE(counter_name, 'rle rows produced', counter_value, NULL)) AS 'rle_rows_produced' ,
          sum(DECODE(counter_name, 'rows produced', counter_value, NULL)) AS 'rows_prod' ,
          sum(DECODE(counter_name, 'consumer stall (us)', counter_value, NULL)) AS 'cons_stall' ,
          sum(DECODE(counter_name, 'producer stall (us)', counter_value, NULL)) AS 'prod_stall' ,
          sum(DECODE(counter_name, 'cumulative size of raw temp data (bytes)', counter_value, NULL)) AS 'temp_data'
     from dc_execution_engine_profiles
    where transaction_id= :t_id
      and statement_id= :s_id
      and node_name = (select local_node_name())
    group by 1, 2
    order by 1, 2 ;
 path_id | operator_name | num_operators | num_nodes | bytes_received | bytes_sent | execution_time_us | rows_received | rle_rows_produced | rows_prod | cons_stall | prod_stall | temp_data
---------+---------------+---------------+-----------+----------------+------------+-------------------+---------------+-------------------+-----------+------------+------------+----------
      -1 | NewEENode     |             1 |         1 |                |            |              1907 |               |             55619 |     55619 |            |            |
      -1 | Root          |             1 |         1 |                |            |             84804 |               |                   |     55619 |            |            |
       2 | GroupByHash   |             8 |         1 |                |            |            115847 |               |             45751 |     45751 |            |            |        0
       2 | GroupByPipe   |             2 |         1 |                |            |             31552 |               |             50581 |     50581 |            |            |
       2 | NetworkRecv   |             2 |         1 |        1752275 |            |             42063 |         87732 |             87732 |     87732 |            |            |
       2 | NetworkSend   |             2 |         1 |                |     640179 |              4509 |               |             22017 |     22017 |    3439817 |          0 |
       2 | ParallelMerge |             1 |         1 |                |            |             15525 |               |             14024 |     14024 |            |            |
       2 | ParallelUnion |             5 |         1 |                |            |              4998 |               |             63840 |     63840 |            |            |
       2 | StorageUnion  |             4 |         1 |                |            |             10491 |               |             50581 |     50581 |            |            |
       3 | ExprEval      |             2 |         1 |                |            |              6482 |               |             50583 |     50583 |            |            |
       3 | Join          |             2 |         1 |                |            |             21632 |               |             50583 |     50583 |            |            |        0
       4 | Join          |             2 |         1 |                |            |            278566 |               |             50583 |     50583 |            |            |        0
       5 | Scan          |             2 |         1 |                |            |            293481 |               |             50583 |     50583 |            |            |
       6 | NetworkRecv   |             1 |         1 |        1208577 |            |              8309 |         60000 |             60000 |     60000 |            |            |
       6 | NetworkSend   |             1 |         1 |                |    1211754 |              2046 |               |             15052 |     15052 |     346612 |          0 |
       6 | Scan          |             1 |         1 |                |            |             80978 |               |             15052 |     15052 |            |            |
       6 | StorageUnion  |             1 |         1 |                |            |              2632 |               |             15052 |     15052 |            |            |
       8 | GroupByHash   |             1 |         1 |                |            |              2332 |               |                 4 |         4 |            |            |        0
       8 | GroupByPipe   |             1 |         1 |                |            |             12961 |               |                 4 |         4 |            |            |
       8 | NetworkRecv   |             1 |         1 |             99 |            |              6988 |            10 |                10 |        10 |            |            |
       8 | NetworkSend   |             1 |         1 |                |        153 |                67 |               |                 4 |         4 |     356037 |          0 |
       8 | Scan          |             1 |         1 |                |            |             42909 |               |                 4 |         4 |            |            |
       8 | StorageUnion  |             1 |         1 |                |            |              1237 |               |                 4 |         4 |            |            |
(23 rows)
有了数据透视格式,您可以轻松查看操作符之间计数器值的转换并识别执行查询时数据流可能存在的问题。
请记住,查询从下往上执行,但其路径可能并行发生。
例如,在上一个查询中,路径 3 连接需要等待较早的路径完成才能执行;也就是说,它必须评估在较早的路径中创建的表达式。
路径 4 和 8 可以并行执行。
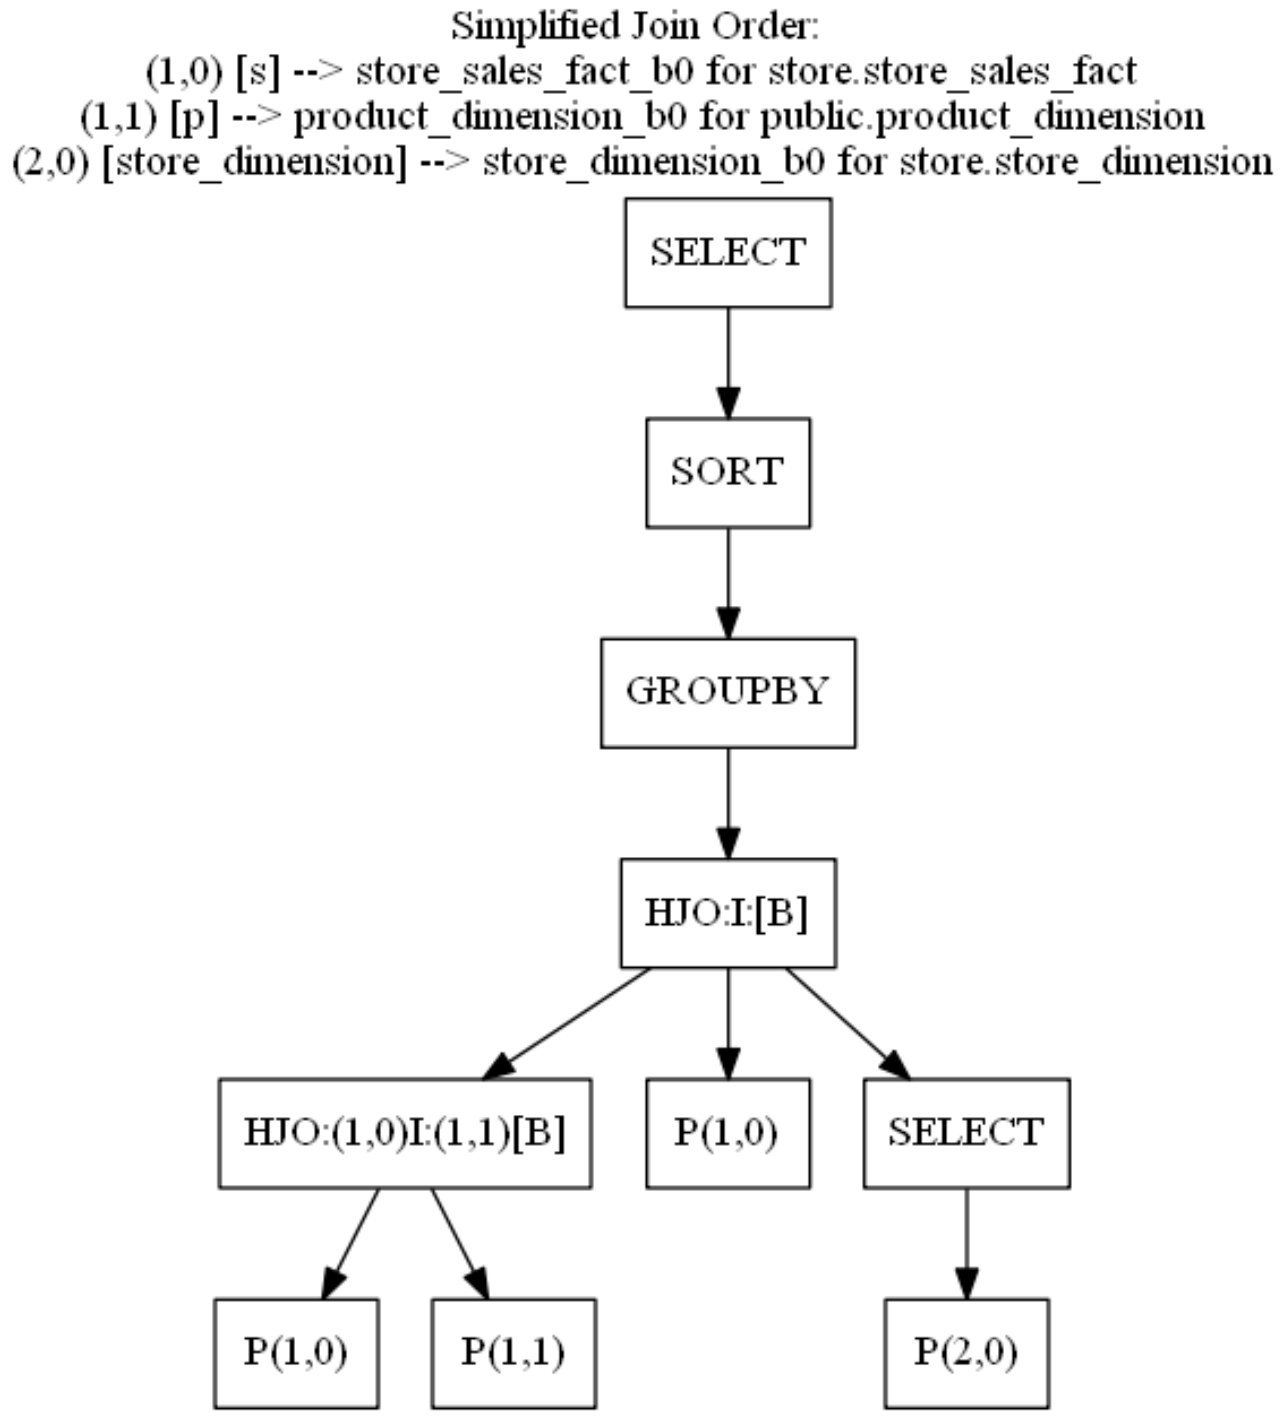
如阅读查询计划中所述,查询图可帮助您了解运算符如何并行或顺序工作。
有关查询图的示例,请参见以下简化连接图。
简化计划没有路径名称,但此图清楚地说明了哪些运算符并行运行以及哪些运算符需要来自前一个运算符的数据才能开始工作:
3.5 检查 SIPs 性能
当使用 SIPs(横向信息传递)时,Vertica 会在通过连接运算符之前从连接的外部表中过滤数据。要过滤的记录基于连接的内部连接表上的谓词;这些谓词位于不属于连接键的列上。
在关联之前过滤数据可以提高性能,因为 Vertica 仅物化满足连接条件的列的数据。
在 Vertica 7.2.x 中对 SIPs 功能的三项增强:
- Vertica 将 SIPs 优化应用于
MergeJoin和HashJoin。 - EXECUTION_ENGINE_PROFILES 表现在具有 counter_tag 列。counter_tag 是一个字符串,它唯一地标识可能需要区分不同实例的运算符的计数器。
- 新的 SIPs 相关计数器。
- SIPsProcessedRows:SIPs 表达式处理的行数
- SIPSrunedRows:SIPs 表达式过滤的行数
查看 SIPs 运算符中的计数器可以帮助您看到外部连接中的额外过滤器减少了查询需要处理的元组数量。有时,减少的数据量太少,不足以证明额外的过滤器是合理的。在这些情况下,禁用该特定查询的 SIPs 可能会提高其性能。
要禁用特定查询的 SIP,请将以下提示添加到您的查询中:
/* +add_vertica_options(BASIC,DISABLE_SIPS) */
3.5.1 DC_SIPS_STATISTICS 系统表
为了完成对 SIPs 信息的分析,Vertica 在 7.2.x 中添加了一个新的数据收集器表:DC_SIPS_STATISTICS 。
在此表中,您可以看到 SIPs 进程裁剪的行数。裁剪的行数可能无法抵消 SIPs 裁剪行所需的时间。发生这种情况时,性能改进不会很显著,可以禁用 SIPs。
3.5.2 案例
=> SELECT node_name,
		  TIME,
		  sip_expr_id,
		  sip_entries,
		  rows_processed,
		  rows_pruned,
		  blocks_processed,
		  blocks_pruned,
		  blocks_pruned_BY_valuelist
	 FROM dc_sips_statistics
	WHERE transaction_id = :t_id
	  AND statement_id = :s_id
	  AND node_name = (SELECT LOCAL_NODE_NAME());
-[ RECORD 1 ]---------------+-------------------------------
 node_name                  | v_vmartdb_node0001
 time                       | 2024-08-08 21:01:56.275266+00
 sip_expr_id                | 2
 sip_entries                | 20154
 rows_processed             | 20480
 rows_pruned                | 0
 blocks_processed           | 10159
 blocks_pruned              | 0
 blocks_pruned_by_valuelist | 0
-[ RECORD 2 ]---------------+-------------------------------
 node_name                  | v_vmartdb_node0001
 time                       | 2024-08-08 21:01:56.275297+00
 sip_expr_id                | 3
 sip_entries                | 5
 rows_processed             | 20480
 rows_pruned                | 0
 blocks_processed           | 10159
 blocks_pruned              | 0
 blocks_pruned_by_valuelist | 0
-[ RECORD 3 ]---------------+-------------------------------
 node_name                  | v_vmartdb_node0001
 time                       | 2024-08-08 21:01:56.275355+00
 sip_expr_id                | 2
 sip_entries                | 4
 rows_processed             | 60000
 rows_pruned                | 20480
 blocks_processed           | 0
 blocks_pruned              | 10159
 blocks_pruned_by_valuelist | 0
3.5.3 结果分析
如果 SIPs 进程裁剪了大量行,那么与 SIPs 相关的开销就是值得的。
如果 SIPs 进程没有裁剪任何行,或者只裁剪了少量行,那么 SIP 进程就不会带来任何好处。
3.6 检查执行计划
您应该在检查执行计划的同时分析查询执行情况,以便了解数据流。
3.6.1 QUERY_PLAN_PROFILES 系统表
执行查询时,Vertica 会将查询计划保存在 QUERY_PLAN_PROFILES 系统表中。
3.6.2 案例
以下查询显示了查询计划以及其他信息,例如运行时间和特定路径上分配的内存。在此查询中,执行计划被截断为 70 个字符以便于演示。
=> SELECT path_id,
		  path_line_index pos,
		  running_time,
		  memory_allocated_bytes AS mem_alloc,
		  read_from_disk_bytes read_from_disk,
		  LEFT(path_line, 70)
	 FROM query_plan_profiles
	WHERE transaction_id = :t_id
	  AND statement_id = :s_id
	ORDER BY path_id,path_line_index;
 path_id | pos |   running_time  | mem_alloc | read_from_disk | left
---------+-----+-----------------+-----------+----------------+------------------------------------------------------------------------
       2 |   1 | 00:00:00.765351 | 746200704 |                | +-GROUPBY HASH (SORTOUTPUT) (GLOBAL RESEGMENT GROUPS) (LOCAL RESEGMEN
       2 |   2 |				 |           |                | | Group By: s.product_key, p.product_description
       2 |   3 |				 |           |                | | Execute on: AllNodes
       3 |   1 | 00:00:00.732285 |  28023488 |                | | +---> JOIN HASH[Semi] [Cost: 21K, Rows: 2M] (PATH ID: 3) Inner (BRO
       3 |   2 |                 |           |                | | | Join Cond:(s.store_key = VAL(3))
       3 |   3 |                 |           |                | | | Materializeat Input: s.store_key
       3 |   4 |                 |           |                | | | Materializeat Output: s.product_key
       3 |   5 |                 |           |                | | | Execute on: All Nodes
       4 |   1 |  00:00:00.72732 |  37829248 |                | | | +-- Outer -> JOINHASH [Cost: 14K, Rows: 5M] (PATH ID: 4) Inner (B
       4 |   2 |                 |           |                | | | | Join Cond:(s.product_key = p.product_key) AND (s.product_v
       4 |   3 |                 |           |                | | | | Executeon: All Nodes
       5 |   1 | 00:00:00.591365 |  15884032 |              0 | | | | +-- Outer ->STORAGE ACCESS for s [Cost: 6K, Rows: 5M] (PATH ID:
       5 |   2 |                 |           |                | | | | | Projection: store.store_sales_fact_b0
       5 |   3 |                 |           |                | | | | | Materialize: s.product_key, s.product_version
       5 |   4 |                 |           |                | | | | | Executeon: All Nodes
       5 |   5 |                 |           |                | | | | | RuntimeFilters: (SIP2(HashJoin): s.product_key), (SIP3(H
       6 |   1 | 00:00:00.613828 |  28816384 |              0 | | | | +-- Inner ->STORAGE ACCESS for p [Cost: 266, Rows: 60K] (PATH I
       6 |   2 |                 |           |                | | | | | Projection: public.product_dimension_b0
       6 |   3 |                 |           |                | | | | | Materialize: p.product_key, p.product_version, p.product_
       6 |   4 |                 |           |                | | | | | Executeon: All Nodes
       8 |   1 |  00:00:00.51101 |  32135168 |              0 | | | | +---> STORAGE ACCESS for store_dimension [Cost: 34, Rows: 16] (P
       8 |   2 |                 |           |                | | | | | Projection: store.store_dimension_b0
       8 |   3 |                 |           |                | | | | | Materialize: store_dimension.store_key
       8 |   4 |                 |           |                | | | | | Filter: (store_dimension.store_state = 'MA')
       8 |   5 |                 |           |                | | | | | Execute on: All Nodes
(25 rows)
如果查询计划太大而无法分析,请重点关注最慢的路径以及与该特定路径相邻的路径。
=> \set path_id 4
=> SELECT path_id,
		  path_line_index pos,
		  running_time,
		  memory_allocated_bytes AS mem_alloc,
		  read_from_disk_bytes read_from_disk,
		  LEFT(path_line, 70)
	 FROM query_plan_profiles
	WHERE transaction_id = :t_id
	  AND statement_id = :s_id
	  AND path_id BETWEEN :path_id -2 AND :path_id +2
	ORDER BY path_id, path_line_index;
 path_id | pos |   running_time  | mem_alloc | read_from_disk | left
---------+-----+-----------------+-----------+----------------+------------------------------------------------------------------------
       2 |   1 | 00:00:00.765351 | 746200704 |                | +-GROUPBY HASH (SORT OUTPUT) (GLOBAL RESEGMENT GROUPS) (LOCAL RESEGMEN
       2 |   2 |                 |           |                | | Group By: s.product_key, p.product_description
       2 |   3 |                 |           |                | | Execute on: All Nodes
       3 |   1 | 00:00:00.732285 |  28023488 |                | | +---> JOIN HASH [Semi] [Cost: 21K, Rows: 2M] (PATH ID: 3) Inner (BRO
       3 |   2 |                 |           |                | | | Join Cond: (s.store_key = VAL(3))
       3 |   3 |                 |           |                | | | Materialize at Input: s.store_key
       3 |   4 |                 |           |                | | | Materialize at Output: s.product_key
       3 |   5 |                 |           |                | | | Execute on: All Nodes
       4 |   1 |  00:00:00.72732 |  37829248 |                | | | +-- Outer -> JOIN HASH [Cost: 14K, Rows: 5M] (PATH ID: 4) Inner (B
       4 |   2 |                 |           |                | | | | Join Cond: (s.product_key = p.product_key) AND (s.product_v
       4 |   3 |                 |           |                | | | | Execute on: All Nodes
       5 |   1 | 00:00:00.591365 |  15884032 |              0 | | | | +-- Outer -> STORAGE ACCESS for s [Cost: 6K, Rows: 5M] (PATH ID:
       5 |   2 |                 |           |                | | | | | Projection: store.store_sales_fact_b0
       5 |   3 |                 |           |                | | | | | Materialize: s.product_key, s.product_version
       5 |   4 |                 |           |                | | | | | Execute on: All Nodes
       5 |   5 |                 |           |                | | | | | Runtime Filters: (SIP2(HashJoin): s.product_key), (SIP3(H
       6 |   1 | 00:00:00.613828 |  28816384 |              0 | | | | +-- Inner -> STORAGE ACCESS for p [Cost: 266, Rows: 60K] (PATH I
       6 |   2 |                 |           |                | | | | | Projection: public.product_dimension_b0
       6 |   3 |                 |           |                | | | | | Materialize: p.product_key, p.product_version, p.product_
       6 |   4 |                 |           |                | | | | | Execute on: All Nodes
(20 rows)
3.6.3 结果分析
在检查执行计划的同时分析查询执行情况,以便了解查询执行时的数据流。着重关注查询执行时间、使用的内存量以及从磁盘读取的数据,查看是否存在任何可能影响查询性能的异常情况。
3.7 检查资源分配
每个执行的查询都会使用系统资源。同时执行的多个查询可能会导致系统资源争抢。通过资源池为不同的业务场景分配适合其工作负载的资源,以获得良好的查询性能。
3.7.1 RESOURCE_ACQUISITIONS 系统表
RESOURCE_ACQUISITIONS 系统表包含给定查询获取的资源。
3.7.2 示例查询
以下查询返回有关特定 transaction_id 和 statement_Id 的资源请求的信息。
SELECT node_name,
       request_type,
       pool_name,
       memory_kb,
       filehandles,
       threads,
       succeeded,
       result,
       failing_resource
  FROM resource_acquisitions
 WHERE transaction_id = :t_id
   AND statement_id = :s_id
 ORDER BY node_name;
      node_name     | request_type | pool_name | memory_kb | filehandles | threads | succeeded | result  | failing_resource
--------------------+--------------+-----------+-----------+-------------+---------+-----------+---------+------------------
 v_vmartdb_node0001 | Acquire      | general   |    102400 |           0 |       0 | 		 t | Granted |
 v_vmartdb_node0001 | Reserve      | general   |   1548488 |          54 |      56 | 		 t | Granted |
 v_vmartdb_node0002 | Reserve      | general   |   1548488 |          51 |      53 | 		 t | Granted |
 v_vmartdb_node0003 | Reserve      | general   |   1548488 |          51 |      53 | 		 t | Granted |
(4 rows)
上述结果中request_type = 'Acquire'(获取特定资源的请求)仅发生在初始化节点。此项显示优化器用于规划查询的资源。默认值为 100 MB。
但是,如果在 QUERY_EVENTS 系统表中出现 MEMORY_LIMIT_HIT 事件,则表示 100 MB 不足以规划查询。查询可能过于复杂,或者查询表上的 projection 可能太多,优化器无法在使用完 100 MB 之前创建最佳计划。
要解决此问题,请简化查询,删除任何未使用和不必要的投影,或增加优化器可用于规划查询的内存。
要增加可用内存,可调整 MaxOptMemMB 配置参数:
=> ALTER TABLE dbname SET MaxOptMemMB = 150;
在执行节点中,ReserveRequest 请求预留资源以执行查询。
如果预留内存不足以执行查询,则会出现 AcquireAdditional 请求。
根据操作符的需求,AcquireAdditional 请求可能会成功,也可能不会成功。succeeded列显示 Vertica 是否授予了额外资源。
如果请求未成功,结果列会指示原因,如下例所示:
v_vmartdb_node0001 | 45045996273723096 | 1 | AcquireAdditional | t |             | Granted                                                                                                                  | 151.03
v_vmartdb_node0001 | 45035996273723096 | 1 | AcquireAdditional | t |             | Granted                                                                                                                  | 228.03
v_vmartdb_node0001 | 45035996273723096 | 1 | AcquireAdditional | f | Memory(KB)  | Request exceeds limits: Memory(KB) Exceeded: Requested = 161480705, Free = 7744915 (Limit = 246861296, Used = 239116381) | 382.03
v_vmartdb_node0001 | 45035996273723096 | 1 | AcquireAdditional | f | Memory (KB) | Request exceeds limits: Memory(KB) Exceeded: Requested = 161480705, Free = 7744915 (Limit = 246861296, Used = 239116381) | 382.03
RequestAdditional 请求最常发生在 HashJoin 或 GROUP BY HASH 中。
3.7.3 结果分析
如果查询请求的资源多于 Vertica 为该查询预留的资源,请进一步分析以找出优化器未正确规划查询的原因。
此问题可能是表统计信息的问题。如果统计信息基于 10% 的样本,请运行 ANALYZE_HISTOGRAM 以增加统计样本并提高统计信息的准确性。
3.8 查询所使用的 PROJECTIONS
为了更好地理解优化器创建该计划的原因,您需要了解所使用的 PROJECTION 及其特征。
3.8.1 PROJECTIONS_USAGE 系统表
PROJECTIONS_USAGE 表包含有关 Vertica 用于每个执行查询的 PROJECTION 的信息。
3.8.2 示例查询
通过以下SQL可获得某个查询所使用的 PROJECTION 。通常在一个查询中 Vertica 只会使用b0、b1中的一个。
但当有节点宕机时,可能会看到具有不同偏移量的 Projection 出现在一个执行计划中。
=> SELECT node_name,
		  projection_name,
		  anchor_table_name
	 FROM projection_usage
	WHERE transaction_id = :t_id
	  AND statement_id = :s_id;
     node_name      |    projection_name   | anchor_table_name
--------------------+----------------------+-------------------
 v_vmartdb_node0001 | product_dimension_b0 | product_dimension
 v_vmartdb_node0001 | store_dimension_b0   | store_dimension
 v_vmartdb_node0001 | store_sales_fact_b0  | store_sales_fact
(3 rows)
使用上述查询,您可以将表和投影信息保存在变量中。
使用投影名称定义变量允许您重复使用查询,而无需多次修改和输入相同的信息。
\set t_proj '''store_sales_fact_b0'''
\set t_name '''store_sales_fact'''
\set t_schema '''store'''
3.8.3 结果分析
通常,Vertica 查询仅使用相同的偏移投影,例如 product_dimension_b0。
如果您看到投影访问不同的偏移投影,如 product_dimension_b0 和 product_dimension_b1,则表连接可能会影响查询性能。
3.9 检查表分区
分区是表的属性。如果对表进行了分区,则该表的所有projection都使用相同的表达式进行分区。定义分区是数据库逻辑设计的一部分,必须由用户定义。
Vertica 数据库设计器 (DBD) 不推荐分区表达式。分区可以提高查询执行期间的并行性。
为了获得最佳结果,请对事实表进行分区,因为:
- 如果分区键上有谓词,则扫描时间会缩短,因为 Vertica 可以轻松找到与谓词匹配的 ROS 容器。如果不需要分区表的 ROS 容器,Vertica 可以在查询执行期间消除对容器的处理。此过程称为分区裁剪。为了消除 ROS 容器,Vertica 将查询谓词与分区相关的元数据进行比较。
- 来自不同分区的数据存储在磁盘上的单独文件,从而改善并行执行。
- 分区表可以使用 DROP_PARTITIONS 删除分区数据,避免使用 DELETE 删除数据产生删除向量。
- 对于事实表,分区是进行数据生命周期管理最有效的方法。
3.9.1 TABLES 系统表
TABLES 系统表包含有关数据库中所有表的信息,包括表是否已分区,以及分区表的分区方式。
3.9.2 示例查询
查询 TABLES 系统表以查看表是否已分区并确定分区表达式。分区表达式定义如何对分区进行排序。
=> SELECT table_schema,
		  table_name,
		  owner_name,
		  partition_expression,
		  create_time
	 FROM tables
	WHERE table_name = :t_name
	  AND table_schema = :t_schema;
 table_schema | table_name       | owner_name | partition_expression         | create_time
--------------+------------------+------------+------------------------------+----------------------------------------------
 store        | store_sales_fact | dbadmin    | store_sales_fact.store_key   | 2016- 08-02 17:48:43.60541+00
(1 row)
3.9.3 结果分析
如果您的表很大或为事实表,请对其进行分区,以便 Vertica 可以组织磁盘上的数据,从而提高查询性能。当谓词条件满足分区设置时, Vertica 将应用分区裁剪只读取所需的分区数据。
由于不同的分区数据存放在单独的文件中,因此分区可以提高并行性。
分区还可以提升数据删除时的性能。
有关分区的更多详细信息,请参阅 Vertica 文档中的使用表分区。
3.10 检查 PROJECTIONS
在评估查询性能时,检查查询正在访问的投影非常重要。检查 Projection 的如下项目:
- 是否刷新了数据
- 是否分段
- pre-join Projection
- super projection
- 分段表达式
- 是否按字段分段,从而均匀分布数据并减少查询中的分段
- 是否是实时聚合投影(live aggregate projection)
3.10.1 PROJECTIONS 系统表
PROJECTIONS 系统表包含有关投影的重要信息。PROJECTIONS 系统表中的 created_epoch 列显示投影是在哪个时期创建的。
3.10.1.1 示例查询
=> SELECT projection_schema,
		  projection_name,
		  is_prejoin,
		  is_up_to_date,
		  has_statistics,
		  is_segmented,
		  segment_expression,
		  is_super_projection,
		  created_epoch
	 FROM projections
	WHERE anchor_table_name = :t_name
	  AND projection_schema = :t_schema;
-[ RECORD 1 ]--------+------------------------------------------------------------
 projection_schema   | store
 projection_name     | store_sales_fact_b0
 is_prejoin          | f
 is_up_to_date       | t
 has_statistics      | t
 is_segmented        | t
 segment_expression  | hash(store_sales_fact.date_key, store_sales_fact.product_key, store_sales_fact.product_version, store_sales_fact.store_key, store_sales_ fact.promotion_key, store_sales_fact.customer_key, store_sales_fact.employee_key, store_sales_fact.pos_transaction_number, store_sales_fact.sales_quantity, store_ sales_fact.sales_dollar_amount, store_sales_fact.cost_dollar_amount, store_sales_ fact.gross_profit_dollar_amount, store_sales_fact.transaction_time, store_sales_ fact.tender_type, store_sales_fact.transaction_type)
 is_super_projection | t
 created_epoch       | 12
-[ RECORD 2 ]--------+------------------------------------------------------------
 projection_schema   | store
 projection_name     | store_sales_fact_b1
 is_prejoin          | f
 is_up_to_date       | t
 has_statistics      | t
 is_segmented        | t
 segment_expression  | hash(store_sales_fact.date_key, store_sales_fact.product_key, store_sales_fact.product_version, store_sales_fact.store_key, store_sales_ fact.promotion_key, store_sales_fact.customer_key, store_sales_fact.employee_key, store_sales_fact.pos_transaction_number, store_sales_fact.sales_quantity, store_ sales_fact.sales_dollar_amount, store_sales_fact.cost_dollar_amount, store_sales_ fact.gross_profit_dollar_amount, store_sales_fact.transaction_time, store_sales_ fact.tender_type, store_sales_fact.transaction_type)
 is_super_projection | t
 created_epoch       | 12
3.10.1.2 结果分析
查看此 projection 信息时,请考虑以下几点:
- 默认情况下,在从 COPY 和 INSERT INTO 语句创建自动投影时,Vertica 会自动分段前 32 列数据(新版本缺省为 8,某些情况下可能会导致数据倾斜,建议适当调大),此参数有助于避免数据倾斜。
拥有 32 个分段列会使哈希算法变得复杂,并且可能占用大量 CPU,尤其是当多个分段列为 VARCHAR(1000) 时。对于这些投影,请查看默认分段,看看性能是否会因更好的投影分段而受益。有关更多信息,请参阅 Vertica 文档中的分段设计。 - 查看
query-specific projections和superprojection的分段,看看改进分段是否有助于提高性能。 - 如果表有统计信息,优化器会创建一个低成本查询计划,为查询选择最佳投影。及时使用
ANALYZE_STATISTICS函数更新表的统计信息以保证执行计划的准确。
3.10.2 PROJECTION_COLUMNS 系统表
查询 PROJECTION_COLUMNS 系统表以检查投影 ORDER BY 子句。
然后,您可以查看哪些列是 ORDER BY 子句的一部分以及位于哪个位置。
此外,如果 ORDER BY 列具有统计信息,您可以找出统计信息的类型、列中的数据类型以及使用的编码类型(如果有)。
3.10.2.1 示例查询
=> SELECT projection_name,
          projection_column_name,
          column_position,
          sort_position,
          encoding_type,
          access_rank,
          statistics_type,
          statistics_updated_timestamp
     FROM projection_columns
    WHERE sort_position >= 0
      AND projection_name = :t_proj
      AND table_schema = :t_schema
      ORDER BY projection_name, sort_position;
 projection_name     | projection_column_name     | column_position | sort_position | encoding_type | access_rank | statistics_type | statistics_updated_timestamp
---------------------+----------------------------+-----------------+---------------+---------------+-------------+-----------------+-------------------------------
 store_sales_fact_b0 | employee_key               |               6 |             0 |          AUTO |           0 |        ROWCOUNT | 2016-02-26 14:44:41.275664+00
 store_sales_fact_b0 | customer_key               |               5 |             1 |          AUTO |           0 |        ROWCOUNT | 2016-02-26 14:44:41.275664+00
 store_sales_fact_b0 | promotion_key              |               4 |             2 |          AUTO |           0 |        ROWCOUNT | 2016-02-26 14:44:41.275664+00
 store_sales_fact_b0 | store_key                  |               3 |             3 |          AUTO |           0 |        ROWCOUNT | 2016-02-26 14:44:41.275664+00
 store_sales_fact_b0 | product_key                |               1 |             4 |          AUTO |           0 |        ROWCOUNT | 2016-02-26 14:44:41.275664+00
 store_sales_fact_b0 | product_version            |               2 |             5 |          AUTO |           0 |        ROWCOUNT | 2016-02-26 14:44:41.275664+00
 store_sales_fact_b0 | date_key                   |               0 |             6 |          AUTO |           0 |        ROWCOUNT | 2016-02-26 14:44:41.275664+00
 store_sales_fact_b0 | pos_transaction_number     |               7 |             7 |          AUTO |           0 |        ROWCOUNT | 2016-02-26 14:44:41.275664+00
 store_sales_fact_b0 | sales_quantity             |               8 |             8 |          AUTO |           0 |        ROWCOUNT | 2016-02-26 14:44:41.275664+00
 store_sales_fact_b0 | sales_dollar_amount        |               9 |             9 |          AUTO |           0 |        ROWCOUNT | 2016-02-26 14:44:41.275664+00
 store_sales_fact_b0 | cost_dollar_amount         |              10 |            10 |          AUTO |           0 |        ROWCOUNT | 2016-02-26 14:44:41.275664+00
 store_sales_fact_b0 | gross_profit_dollar_amount |              11 |            11 |          AUTO |           0 |        ROWCOUNT | 2016-02-26 14:44:41.275664+00
 store_sales_fact_b0 | transaction_type           |              12 |            12 |          AUTO |           0 |        ROWCOUNT | 2016-02-26 14:44:41.275664+00
 store_sales_fact_b0 | transaction_time           |              13 |            13 |          AUTO |           0 |        ROWCOUNT | 2016-02-26 14:44:41.275664+00
 store_sales_fact_b0 | tender_type                |              14 |            14 |          AUTO |           0 |        ROWCOUNT | 2016-02-26 14:44:41.275664+00
(15 rows)
3.10.2.2 结果分析
编码减少了存储在磁盘上的数据占用空间,因此在查询执行期间,需要从磁盘读取的字节数更少。编码算法的相关信息在 Vertica 文档的 EncodingType 中进行了描述。
数据库设计器 (DBD) 使用 1% 的数据样本来定义每个投影列的最佳编码。最佳编码基于字段类型和基数。如果未定义编码,Vertica 将在投影 DDL 中指定 AUTO。此设置指定使用数据类型的最佳编码,而不考虑基数。
下表列出了 Vertica 数据类型的最佳和默认编码。
| Data Type + ENCODING hint | INTEGER, NUMERIC (<=18), DATE, TIMESTAMP, etc. | NUMERIC (19+) | FLOAT | CHAR/VARCHAR | BOOLEAN | Notes |
|---|---|---|---|---|---|---|
| default aka AUTO | Delta Int Pack | LZO | LZO | String_LZO | LZO | Use if nothing else below applies. 如果下面的编码方式均不适用,请使用AUTO。 |
| NONE | Delta Int Pack | LZO | LZO | LZO | LZO | Don’t use. |
| RLE | RLE+LZO | RLE+LZO | RLE+LZO | String RLE+LZO | RLE+LZO | Use when the column is sorted and the number repeated records exceeds 10 (on average). 当对列进行排序并且重复记录数超过 10(平均值)时使用。 |
| BLOCK_DICT | Block Dict | Block Dict | Block Dict | Block Dict | Block Dict | Use when there are few distinct values per block. 当每个块只有少数不同值时使用。 |
| BLOCKDICT_COMP | Block Dict Comp | Block Dict Comp | Block Dict Comp | Block Dict Comp | Block Dict Comp | Use when there are few distinct values per block and skew is high. 当每个块中不同的值很少并且偏差较大时使用。 |
| DELTAVAL | Block Delta Val | LZO | LZO | LZO | LZO | Use when integers are in a narrow range. 当整数范围较窄时使用。 |
| GCDDELTA | Block GCD Delta Val | LZO | LZO | LZO | LZO | Use when integers are a multiple of a common factor 当整数是公因数的倍数时使用 |
| COMMONDELTA_COMP | Common Delta | LZO | Common Delta | LZO | LZO | Use if the number of deltas per block is less than the range of values in the block, and less than the number of distinct values in the block. 如果每个块的增量数小于块中的值范围,并且小于块中不同值的数量,则使用。 |
| DELTARANGE_COMP | Delta Range | LZO | Delta Range | LZO | LZO | Use for floating point/integer data that has many distinct values per block. 用于每个块具有许多不同值的浮点/整数数据。 |
| DELTARANGE_COMP_SP | Delta Range | LZO | Delta Range | LZO | LZO | Use with single-precision floating point data. 与单精度浮点数据一起使用。 |
使用编码算法对列进行编码和解压,Vertica 都需要使用 CPU 来进行计算。因此,如果系统的性能瓶颈是CPU,则删除编码可能有助于提高性能。
3.10.3 PROJECTIONS_STORAGE 系统表
查询 PROJECTIONS_STORAGE 系统表以查看每个节点上的投影有多大。
3.10.3.1 示例查询
SELECT node_name,
	   projection_schema,
	   projection_name,
	   SUM(row_count) row_count,
	   ROUND(SUM(used_bytes)/1024^2::NUMERIC(10,3),3) used_GB,
	   COUNT(DISTINCT node_name) num_nodes,
	   SUM(ros_count) ros_count
  FROM projection_storage
 WHERE node_name IN ( SELECT node_name FROM nodes WHERE is_ephemeral = 'f' )
   AND projection_name = :t_proj
   AND projection_schema = :t_schema
 GROUP BY node_name, projection_schema, projection_name
 ORDER BY 2,3,1;
 node_name          | projection_schema | projection_name     | row_count | used_GB | num_nodes | ros_count
--------------------+-------------------+---------------------+-----------+---------+-----------+-----------
 v_test_db_node0001 | store             | store_sales_fact_b0 |   1250032 |  29.586 |         1 | 1
 v_test_db_node0002 | store             | store_sales_fact_b0 |   1250571 |  29.583 |         1 | 1
 v_test_db_node0003 | store             | store_sales_fact_b0 |   1250344 |  29.594 |         1 | 1
 v_test_db_node0004 | store             | store_sales_fact_b0 |   1249053 |  29.565 |         1 | 1
(4 rows)
3.10.3.2 结果分析
如果您发现一个节点的数据多于其他节点,请查看 row_count 列,
这意味着表数据倾斜。请检查您的 projection 的分段字段设置。
如果您发现一个节点的 ros_count 高得多,则可能表明 Tuple Mover 在该节点上无法正常工作。
Vertica 的性能受执行最慢的那个节点影响。可以从 PROJECTIONS_STORAGE 系统表检查是否存在数据倾斜的问题。
