点击关注公众号,干货第一时间送达
Hystrix 差不多介绍完了。
前两篇文章:Springcloud 之 Hystrix 服务熔断 和 Springcloud 之 Hystrix 服务降级
小编分别给大家演示了 Hystrix 服务熔断 和 服务降级。
属于服务层面,不可视化的。
今天,带来一个可视化的东西。
Hystrix Dashborad 可视化服务监控。
老样子,看下下面友情提示
(友情提示:该篇文章是在上篇:Springcloud 之 Hystrix 服务降级 的 IDEA 工程基础上做改进,下面不再赘述IDEA工程建设细节)
一、Hystrix Dashboard 概述
Hystrix提供了准实时的调用监控(Hystrix Dashboard),持续地记录所有通过 Hystrix发起的请求执行情况,并以统计报表和图形的形式展示给用户,包括每秒执行多少成功、多少失败等。
看不懂?
没关系,我们之间来演示。
二、Hystrix Dashboard 搭建
1,按照前面文章讲解的方式,新建 Module
(如果小伙伴对IDEA新建 Module 有疑惑,可以翻看小编之前的文章:Springcloud 之 Eureka 服务搭建,有详细演示)
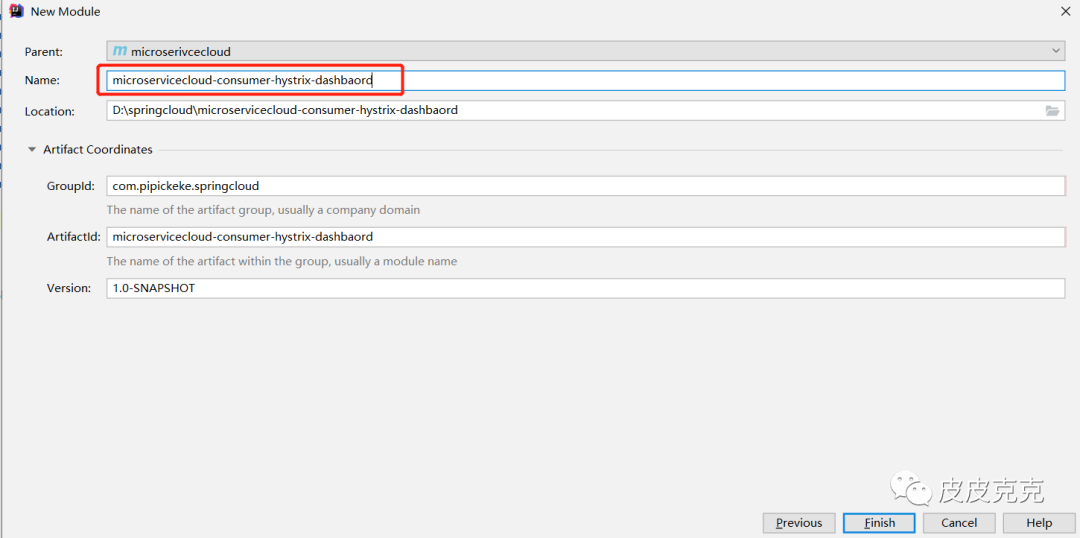
2,添加依赖
        <dependency>
            <groupId>org.springframework.cloud</groupId>
            <artifactId>spring-cloud-starter-netflix-hystrix</artifactId>
        </dependency>

        <dependency>
            <groupId>org.springframework.cloud</groupId>
            <artifactId>spring-cloud-starter-netflix-hystrix-dashboard</artifactId>
        </dependency>
3,application.yml 配置文件
server:
  port: 9001
4,主启动类,添加 @EnableHystrixDashboard 注解
@SpringBootApplication
@EnableHystrixDashboard
public class HystrixDashboardApplication {

    public static void main(String[] args) {
        SpringApplication.run(HystrixDashboardApplication.class,args);
    }
}
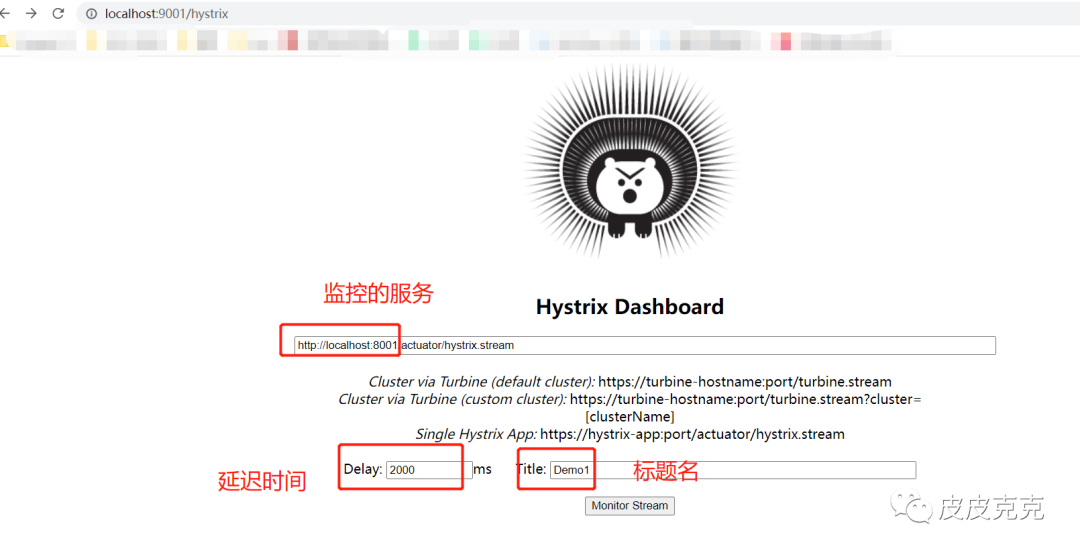
5,启动服务,浏览器地址输入:http://localhost:9001/hystrix
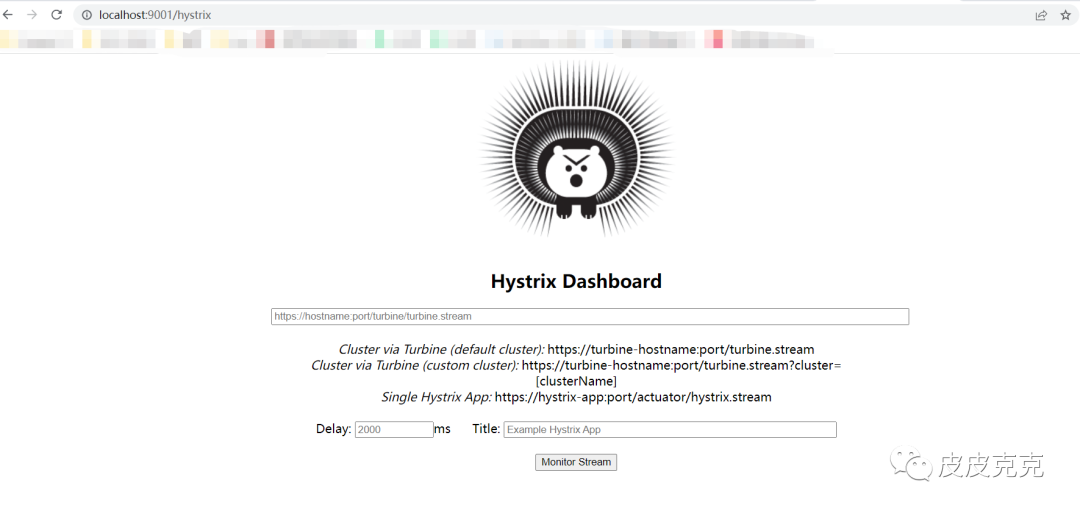
可以看到该界面,则代表我们搭建的 HystrixDashboard 服务正常。
下面,好戏开始!
三、Hystrix Dashboard 服务实时监控
HystrixDashboard 会监控通过 Hystrix 发出的请求,因此为了方便测试。
小编在上篇文章:Springcloud 之 Hystrix 服务降级
的工程基础上做修改。
主要修改 microservicecloud-provider-dept-hystrix-8001
(友情提示:该项目代码细节,可以翻看上篇文章)
1,添加 actuator 依赖
<!--                actuator监控信息-->
        <dependency>
            <groupId>org.springframework.boot</groupId>
            <artifactId>spring-boot-starter-actuator</artifactId>
        </dependency>
2,yml 配置文件添加 hystrix监控点
#开启 hystrix 监控
management:
  endpoints:
    web:
      exposure:
        include: ["hystrix-stream"]
3,测试监控
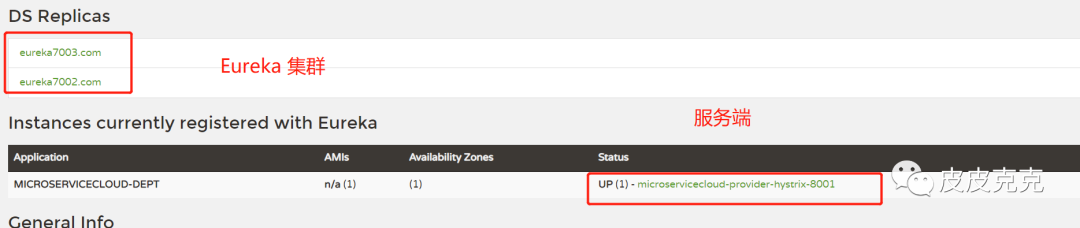
(1)启动各项服务:
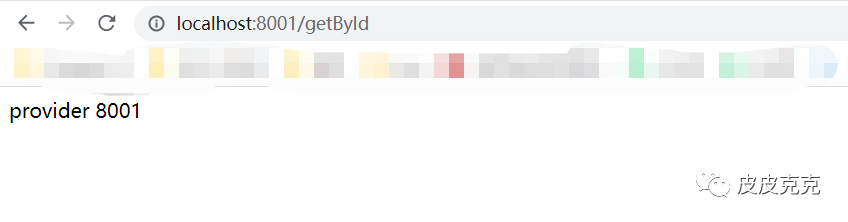
(2)调用接口:http://localhost:8001/getById
(3)浏览器地址输入:http://localhost:8001/actuator/hystrix.stream
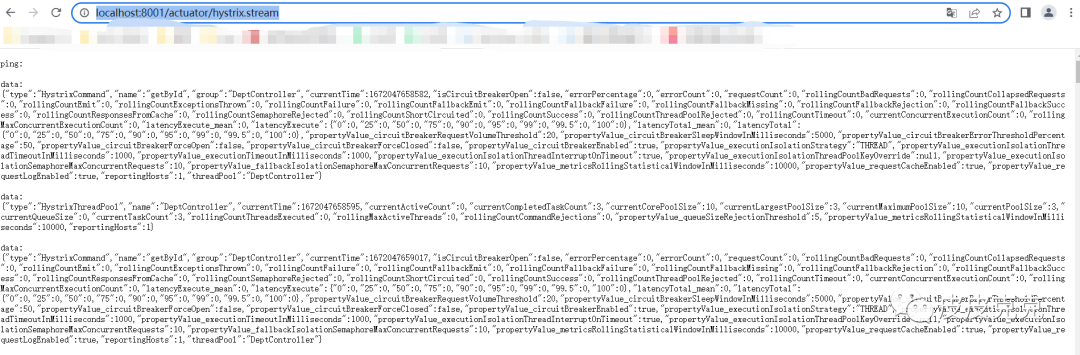
可以看到实时滚动的字符串信息。
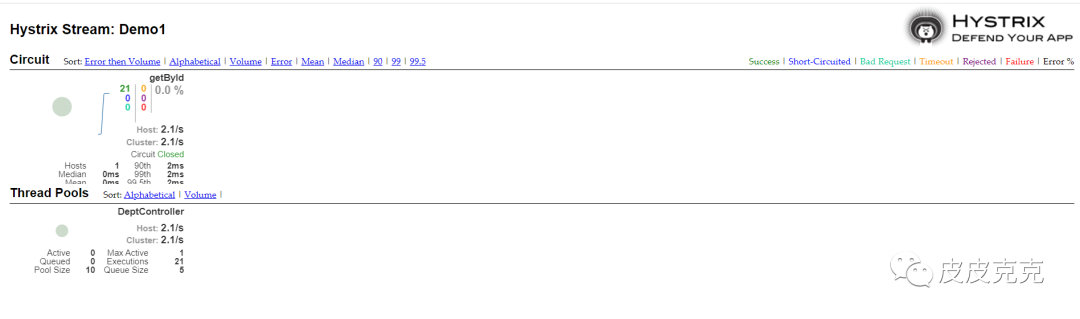
(4)在Hystrix 主界面,输入信息,可以看到实时监控
实时监控如下: