一、Elasticsearch Watcher 介绍
1.1 Watcher 概念概述
Watcher 是 Elasticsearch 提供的一项监控和告警服务,允许用户定义、管理警报规则,并持续跟踪网络和数据的变化。基于 Elasticsearch 的分布式架构,Watcher 可以对基础设施、索引数据、集群健康等多种指标进行实时监控和自动化告警。当预设条件被触发时,Watcher 会及时发送通知。这项功能特别适用于日志数据的监控、应用性能追踪,以及其他需要自动化响应的场景,帮助运维人员快速响应潜在问题,提升系统稳定性和可靠性。
1.2 Watcher 组成结构
一个 Watcher 由多个部分组成,其中部分是可选项,如下:
# 一个 Watcher的语法结构通常如下:
PUT _watcher/watch/my-first-watcher
{
  "metadata": {
    "color": "blue"
  },
  "trigger": {...},
  "input": {...},
  "condition": {...},
  "actions": {...},
  "transform": {...},
}
-
Trigger(触发器)
定义 Watcher 的触发时间,通常基于时间间隔,如每分钟、每小时或特定时间段。Trigger 决定了 Watcher 何时被激活。
-
Input(输入)
定义 Watcher 监控的数据来源,通常为 Elasticsearch 查询。Input 获取需要监控的数据,并作为 Watcher 的输入。如果没有指定条件,默认行为为 always。常见的条件类型包括:
- **always:**始终执行 Actions。
- **never:**从不执行 Actions。
- **compare:**对查询结果进行简单比较。
- **array_compare:**比较数组中的值。
- **script:**使用自定义脚本判断是否执行。
-
Condition(条件)
定义触发 Actions 的条件。当查询结果满足条件时,执行后续操作。例如,某种错误日志超出阈值时触发警报。
-
Action(动作)
定义当条件满足时执行的操作,如发送邮件、调用 Webhook、索引文档或记录日志。常见操作包括邮件通知、Webhook 请求、索引或日志记录。
-
Throttle Period(限流周期)(可选)
防止 Watcher 在短时间内多次触发,设置限流周期可限制触发频率。指定时间段内只允许触发一次。
-
Transform(转换)(可选)
对 Input 的结果进行加工,以便后续处理。例如,修改或转换查询结果。
-
Metadata(元数据)(可选)
为 Watcher 添加附加信息,用于跟踪、文档化或特定操作时传递数据。
1.3 Watcher 功能介绍
Watcher 的主要功能包括:
1)定时监控数据
Watcher 可以定时查询 Elasticsearch 数据,支持设置触发的时间间隔(如每分钟、每小时或每天),并根据查询结果执行相应操作,适用于任何需要周期性监控的场景。
2)条件判断
Watcher 支持对查询结果进行条件判断。用户可以设定条件,例如当查询结果数量超过某个阈值(如错误日志数超过 10)时,触发后续操作或告警。
3)发送警报
当条件满足时,Watcher 可以发送警报,支持以下方式:
- 发送电子邮件通知
- 调用 Webhook,集成外部系统(如 Slack等)
- 记录日志,创建警报
- 将数据索引到 Elasticsearch
- 使用 Jira 或 ServiceNow 创建工单
4)多数据源输入
除了 Elasticsearch 数据外,Watcher 还可以通过 HTTP 请求、Webhook 等方式监控其他系统的数据,从而实现跨系统的综合监控。
5) 多种触发方式
- 时间触发:通过时间触发器执行操作,如每分钟运行一次。
- 手动触发:用户可以手动执行 Watcher 以测试或立即获取结果。
6) Throttle(限流)功能
Watcher 支持 Throttle Period,避免同一警报在短时间内重复触发。例如,设置限流周期为 5 分钟,即使条件满足,警报在该周期内只会触发一次。
7)多步骤查询处理
支持复杂查询流程,可以执行多个查询步骤,处理多个数据集,最终判断是否满足触发条件。
8) 数据转换与处理
Watcher 支持 Transform 功能,可在查询后对数据进行处理或转换,用户可以根据需求自定义数据格式或进行计算,以便更好地进行告警或通知。
9)支持自定义脚本
Watcher 支持 Painless 脚本,允许编写自定义逻辑进行复杂的条件判断和操作,确保在满足特定逻辑时才触发警报。
10 )集成 Elasticsearch 环境
Watcher 完全集成于 Elasticsearch 和 Kibana 中,用户可以通过 Kibana UI 或 Elasticsearch RESTful API 管理和创建 Watcher,亦可与 Elasticsearch 的监控、索引和查询功能紧密结合。
11)告警的灵活性
Watcher 支持灵活定制告警行为,如同时发送电子邮件和 Webhook,或针对不同条件设置不同级别的告警,支持多动作执行。
12) 错误处理与重试机制
Watcher 内置错误处理与重试机制,确保在通知或执行操作失败时进行重试并记录错误日志,确保警报不会丢失。
二、Watcher 示例演示
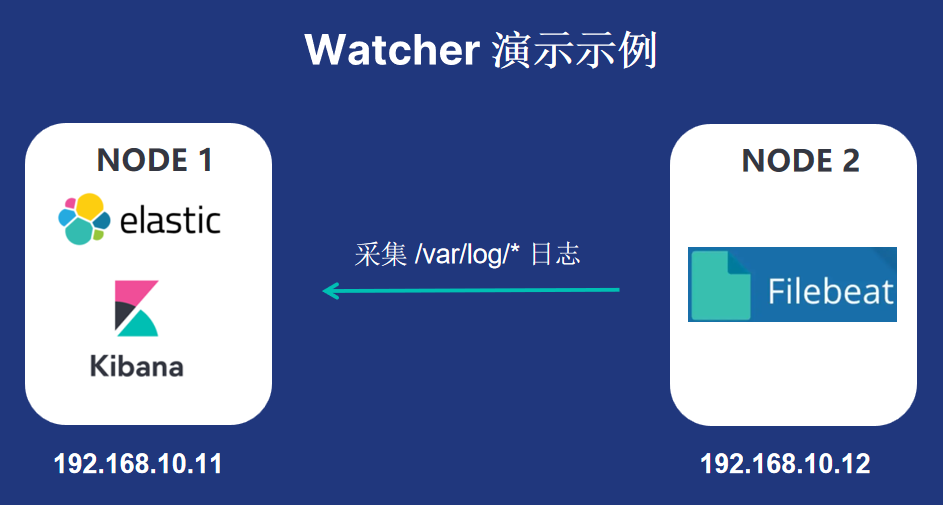
本次选择两台 linux 服务器,其中一台 (192.168.10.11)部署 ES、Kibana ,另一台 (192.168.10.12) 部署 Filebeat 用于采集该服务器上 /var/log 目录下的一些日志信息,并将采集到的日志信息传送到 ES,并通过 Kibana 在 ES 索引里展示。

filebeat.yml 配置文件信息如下:
filebeat.inputs:
- type: log
  enabled: true
  paths:
    - /var/log/secure
    - /var/log/messages
    - /var/log/dmesg
    - /var/log/lastlog

# 输出到 Elasticsearch
output.elasticsearch:
  hosts: ["192.168.10.11:9200"]
  username: "elastic"
  password: "esuser"

# 配置 ILM 策略
setup.ilm.enabled: true  # 启用 ILM 策略
setup.ilm.rollover_alias: "linux-log"  # 使用 linux-log 作为滚动索引的别名
setup.ilm.pattern: "{now/d}-000001"  # 索引滚动模式

# 配置索引模板
setup.template.name: "linux-log"
setup.template.pattern: "linux-log-*"

# 自动设置 Kibana 索引
setup.kibana:
  host: "192.168.10.11:5601"
  username: "elastic"
  password: "esuser"
创建索引模版
使用 Kibana 开发工具创建一个索引模版。
PUT _template/linux-log-template
{
  "index_patterns": ["linux-log-*"],
  "settings": {
    "index.lifecycle.name": "filebeat",
    "index.lifecycle.rollover_alias": "linux-log",
    "number_of_shards": 1,
    "number_of_replicas": 0
  },
  "mappings": {
    "properties": {
      "log.file.path": {
        "type": "keyword"
      },
      "message": {
        "type": "text"
      },
      "@timestamp": {
        "type": "date"
      }
    }
  }
}
启动 Filebeat
[root@es-ck-node2 ~]# cd /root/filebeat/filebeat-7.12.1-linux-x86_6
[root@es-ck-node2 filebeat-7.12.1-linux-x86_64]# ./filebeat -e -c filebeat.yml -d "publish"
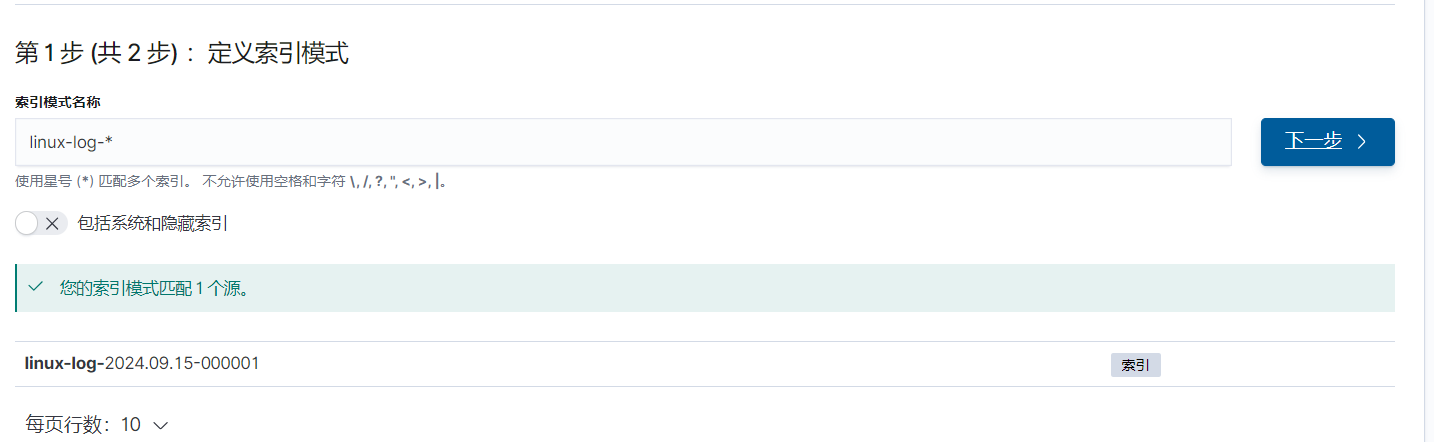
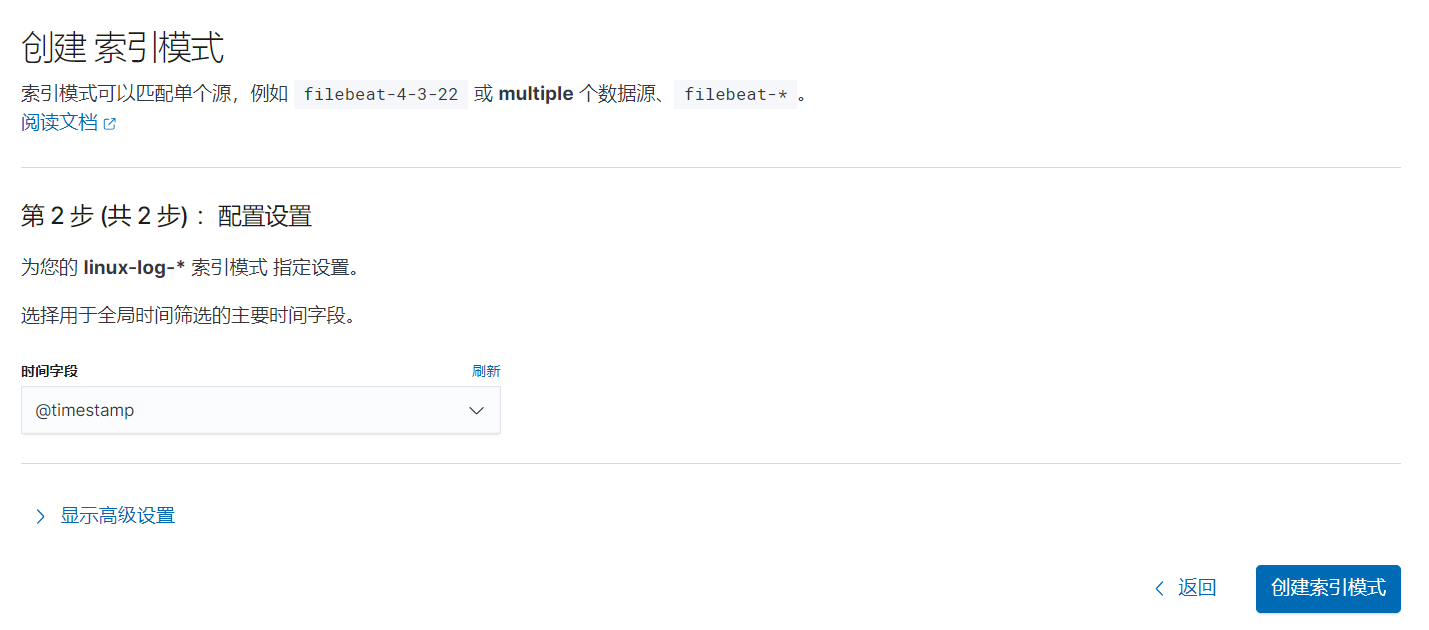
创建索引模式
然后将索引模版和生成的索引相匹配。
创建 Watcher
在 Kibana Dev Tools 中运行以下脚本来创建 Watcher:
# 该 Watcher 的含义是检测 /var/log 日志中有无登录 root 用户失败的告警,每分钟执行一次,如果有告警,并将告警以邮件方式发送给 admin@es.com 邮箱。

PUT _watcher/watch/root_failed_login_alert
{
  "trigger": {
    "schedule": {
      "interval": "1m"
    }
  },
  "input": {
    "search": {
      "request": {
        "indices": ["linux-log-*"],
        "body": {
          "query": {
            "bool": {
              "must": [
                {
                  "match": {
                    "message": "su: FAILED SU (to root"
                  }
                }
              ],
              "filter": {
                "range": {
                  "@timestamp": {
                    "from": "now-1m"
                  }
                }
              }
            }
          }
        }
      }
    }
  },
  "condition": {
    "compare": {
      "ctx.payload.hits.total": {
        "gt": 0
      }
    }
  },
  "actions": {
    "email_admin": {
      "email": {
        "to": ["admin@es.com"],
        "subject": "Root Failed Login Alert",
        "body": {
          "text": "Alert: Found a failed SU attempt to root in /var/log within the last minute."
        }
      }
    }
  }
}

# 详细说明:
Trigger: 设置为每分钟运行一次 ("interval": "1m"),监控 Filebeat 接收到的日志。
Input: 在 linux-log-* 索引中查找 message 包含 "su: FAILED SU (to root" 的日志,并且仅查询最近一分钟的数据。
Condition: 如果查询结果中找到匹配日志(即 hits.total > 0),则触发告警。
Actions: 当检测到告警时,向 admin@es.com 发送邮件,告知有 root 登录失败的告警信息。
查看 Watcher 是否生效
# 可通过 watcher ID 来查看 Watcher 是否生效
GET _watcher/watch/root_failed_login_alert
查看 Watcher 的执行情况
GET _watcher/stats
模拟 Watcher 运行
# 如果想手动测试该 Watcher 的执行情况,可使用以下命令来手动触发
POST _watcher/watch/root_failed_login_alert/_execute
禁用或启用 Watcher
# 禁用 Watcher
POST _watcher/watch/root_failed_login_alert/_disable

# 启用 Watcher
POST _watcher/watch/root_failed_login_alert/_enable
查询 Watcher 历史信息
# 查询与特定 Watcher ID 相关的历史记录。可通过 Watcher ID 查询 .watcher-history-* 索引中的记录:
GET .watcher-history-*/_search
{
  "query": {
    "term": {
      "watch_id": "root_failed_login_alert"  # 替换为你的 Watcher ID
    }
  }
}
删除 Watcher
DELETE _watcher/watch/root_failed_login_alert

# 验证是否删除
GET _watcher/watch/root_failed_login_alert
三、故障案例分析
3.1 背景描述
业务人员反馈在 Kibana 中根据业务配置了大量 Watcher,有些 Watcher 是为了安全监控,通过检测日志里有无违反安全方面的信息触发告警,还有些是用来检测业务的数据是否有异常,比如 索引日志里有无业务关注的异常信息,如果有则会触发告警并以短信或者邮件方式通知对应业务人员。
因近期 ES 集群异常,逐台重启了集群服务器,导致大量 Watcher 失效,导致业务无法正常接收到告警,需要排查原因。
3.2 排查过程
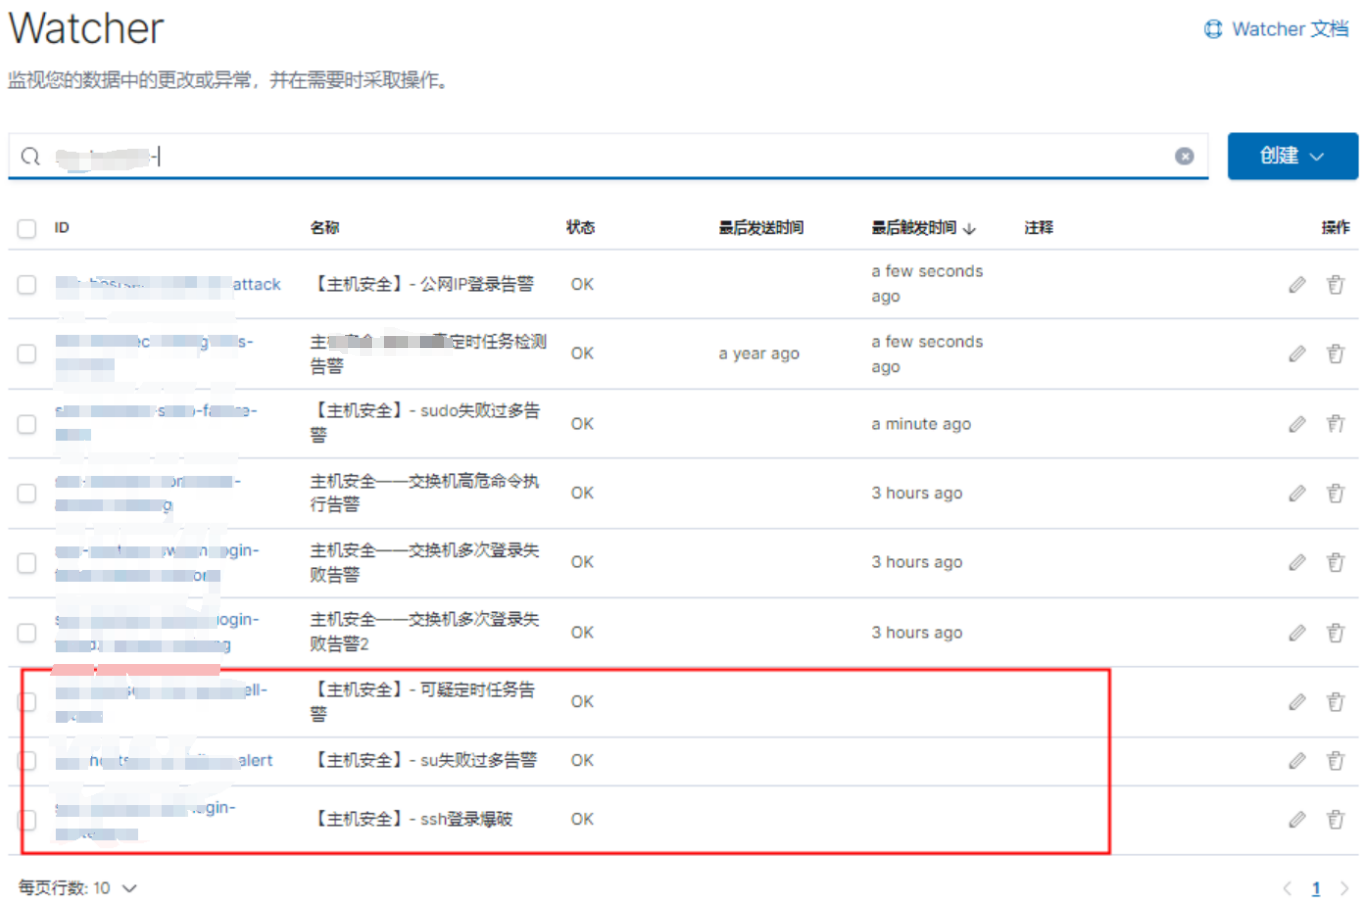
登录 Kibana,查看到当前配置了几百个 Watcher ,很多 Watcher 最后发送时间和最后触发时间异常
1) 根据Watcher ID 查询异常信息
# 如下查询某个异常 Watcher 信息,结果如下
GET _xpack/watcher/watch/xxx-hostxxx-ssh-xxxx-force
{
  "found" : true,
  "_id" : "xxx-hostxxx-ssh-xxxx-force",
  "_version" : 1,
  "_seq_no" : 111626089,
  "_primary_term" : 94,
  "status" : {
    "state" : {
      "active" : true,
      "timestamp" : "2024-08-28T08:37:03.548Z"
    },
    "actions" : {
      "xxx_notify" : {
        "ack" : {
          "timestamp" : "2024-08-28T08:37:03.548Z",
          "state" : "awaits_successful_execution"
        }
      }
    },
    "version" : 1
  },
  "watch" : {
    "trigger" : {
      "schedule" : {
        "interval" : "5m"
      }
    },
    "input" : {
      "search" : {
        "request" : {
          "search_type" : "query_then_fetch",
          "indices" : [
            "xxx_host_log_xxxx_server_xxxx_*"
          ],
          "rest_total_hits_as_int" : true,
          "body" : {
            "query" : {
              "bool" : {
                "must" : [
                  {
                    "range" : {
                      "@timestamp" : {
                        "gte" : "now-5m",
                        "lte" : "now"
                      }
                    }
                  },
                  {
                    "term" : {
                      "source.keyword" : "/var/log/remote/secure.log"
                    }
                  },
                  {
                    "match_phrase" : {
                      "content" : "Failed password"
                    }
                  }
                ]
              }
            },
            "_source" : [
              "@timestamp",
              "content"
            ]
          }
        }
      }
    },
    "condition" : {
      "compare" : {
        "xxx.xxxx.xxxx.xxxx" : {
          "gt" : 2
        }
      }
    },
    "actions" : {
      "tm_notify" : {
        "webhook" : {
          "scheme" : "https",
          "host" : "xxxx.xxxx.xxxx",
          "port" : 443,
          "method" : "post",
          "path" : "/home/public/xxxxx_xxxxx_notify",
          "params" : { },
          "headers" : {
            "Content-type" : "application/json;charset=ISO-8859-1"
          },
          "body" : """{"apikey":"ce0baddd417a7","product":"sec","watcher":"xxx-hostxxx-ssh-xxxx-force","title":"xxx-xxx-xxxx","msg":"Suspected ssh login xxxx-xxxx attack","msgLink":"https://xxxx.xxx.xxxx/s/xxxx/goto/cb6330891b9c900cb783c4","users":"xxxxx"}"""
        }
      }
    },
    "metadata" : {
      "name" : "【xxxxx】- ssh登录尝试",
      "xpack" : {
        "type" : "json"
      }
    }
  }
}

# 根据命令查看到的信息显示该 Watcher 异常信息如下:
State:Watcher 处于 Active 状态,显示该 Watcher 正在正常运行。
Actions 状态:Webhook 动作的状态为 "awaits_successful_execution",标志该 Watcher 在前面执行过程中未成功执行,有可能是因为发送 Webhook 过程遇到问题
2)查看 Watcher 状态
GET _watcher/stats
{
  "_nodes" : {
    "total" : 10,
    "successful" : 10,
    "failed" : 0
  },
  "cluster_name" : "xxxxx-xxxx",
  "manually_stopped" : false,
  "stats" : [
    {
      "node_id" : "hW3RxxxxxxxxxxxxxxxxxMg",
      "watcher_state" : "started",
      "watch_count" : 0,
      "execution_thread_pool" : {
        "queue_size" : 0,
        "max_size" : 0
      }
    },
    {
      "node_id" : "pv3jxxxxxxxxxxxxxxxxxDA",
      "watcher_state" : "started",
      "watch_count" : 0,
      "execution_thread_pool" : {
        "queue_size" : 0,
        "max_size" : 1
      }
    },
    {
      "node_id" : "IUDnxxxxxxxxxxxxxxxxxmQ",
      "watcher_state" : "started",
      "watch_count" : 0,
      "execution_thread_pool" : {
        "queue_size" : 0,
        "max_size" : 0
      }
    },
    {
      "node_id" : "XrEUxxxxxxxxxxxxxxxxxPQ",
      "watcher_state" : "started",
      "watch_count" : 0,
      "execution_thread_pool" : {
        "queue_size" : 0,
        "max_size" : 1
      }
    },
    {
      "node_id" : "f88cxxxxxxxxxxxxxxxxxig",
      "watcher_state" : "started",
      "watch_count" : 0,
      "execution_thread_pool" : {
        "queue_size" : 0,
        "max_size" : 0
      }
    },
    {
      "node_id" : "nLHYxxxxxxxxxxxxxxxxxDA",
      "watcher_state" : "started",
      "watch_count" : 0,
      "execution_thread_pool" : {
        "queue_size" : 0,
        "max_size" : 1
      }
    },
    {
      "node_id" : "V0ZQxxxxxxxxxxxxxxxxxyw",
      "watcher_state" : "started",
      "watch_count" : 0,
      "execution_thread_pool" : {
        "queue_size" : 0,
        "max_size" : 8
      }
    },
    {
      "node_id" : "ToBtxxxxxxxxxxxxxxxxxBw",
      "watcher_state" : "starting",
      "watch_count" : 1,
      "execution_thread_pool" : {
        "queue_size" : 0,
        "max_size" : 64
      }
    },
    {
      "node_id" : "egdKxxxxxxxxxxxxxxxxxmw",
      "watcher_state" : "starting",
      "watch_count" : 0,
      "execution_thread_pool" : {
        "queue_size" : 0,
        "max_size" : 96
      }
    },
    {
      "node_id" : "VaDPxxxxxxxxxxxxxxxxxtw",
      "watcher_state" : "started",
      "watch_count" : 0,
      "execution_thread_pool" : {
        "queue_size" : 0,
        "max_size" : 0
      }
    }
  ]
}

# 根据获取到的信息显示有两个节点状态异常
查看到 node_id为 egdKxxxxxxxxxxxxxxxxxmw 和 egdKxxxxxxxxxxxxxxxxxmw 两个 ES 节点 Watcher 状态异常,正常 watcher_state 状态应为 started ,而这两个节点状态为 starting
3)查找节点和 ID 信息
# 通过 GET _cat/nodes?v&h=id,name 查找节点和名称
id   name
XrEU hostname-100.1-9301
ToBt hostname-100.2-9301
f88c hostname-100.3-9300
pv3j hostname-100.4-9301
hW3R hostname-100.5-9300
nLHY hostname-100.6-9300
VaDP hostname-100.7-9300
V0ZQ hostname-100.8-9301
IUDn hostname-100.9-9301
egdK hostname-100.10-9300

# 根据对应的节点名称查找到对应的节点
4)登录异常节点查看日志信息
[2024-08-28T17:27:26,440][INFO ][o.e.x.w.WatcherService   ] [hostname-100.1-9300] stopping watch service, reason [watcher manually marked to shutdown by cluster state update]
[2024-08-28T17:27:26,440][INFO ][o.e.x.w.WatcherLifeCycleService] [hostname-100.1-9300] watcher has stopped
[2024-08-28T17:27:39,022][ERROR][o.e.x.w.WatcherService   ] [hostname-100.1-9300] error starting watcher
org.elasticsearch.ElasticsearchTimeoutException: java.util.concurrent.TimeoutException: Timeout waiting for task.
        at org.elasticsearch.common.util.concurrent.FutureUtils.get(FutureUtils.java:67) ~[elasticsearch-7.12.1.jar:7.12.1]
        at org.elasticsearch.action.support.AdapterActionFuture.actionGet(AdapterActionFuture.java:50) ~[elasticsearch-7.12.1.jar:7.12.1]
        at org.elasticsearch.action.support.AdapterActionFuture.actionGet(AdapterActionFuture.java:44) ~[elasticsearch-7.12.1.jar:7.12.1]
        at org.elasticsearch.xpack.watcher.execution.TriggeredWatchStore.findTriggeredWatches(TriggeredWatchStore.java:144) ~[x-pack-watcher-7.12.1.jar:7.12.1]
        at org.elasticsearch.xpack.watcher.WatcherService.reloadInner(WatcherService.java:238) ~[x-pack-watcher-7.12.1.jar:7.12.1]
        at org.elasticsearch.xpack.watcher.WatcherService.lambda$start$3(WatcherService.java:212) [x-pack-watcher-7.12.1.jar:7.12.1]
        at org.elasticsearch.xpack.watcher.WatcherService$1.doRun(WatcherService.java:408) [x-pack-watcher-7.12.1.jar:7.12.1]
        at org.elasticsearch.common.util.concurrent.ThreadContext$ContextPreservingAbstractRunnable.doRun(ThreadContext.java:732) [elasticsearch-7.12.1.jar:7.12.1]
        at org.elasticsearch.common.util.concurrent.AbstractRunnable.run(AbstractRunnable.java:26) [elasticsearch-7.12.1.jar:7.12.1]
        at java.util.concurrent.ThreadPoolExecutor.runWorker(ThreadPoolExecutor.java:1130) [?:?]
        at java.util.concurrent.ThreadPoolExecutor$Worker.run(ThreadPoolExecutor.java:630) [?:?]
        at java.lang.Thread.run(Thread.java:831) [?:?]
Caused by: java.util.concurrent.TimeoutException: Timeout waiting for task.
        at org.elasticsearch.common.util.concurrent.BaseFuture$Sync.get(BaseFuture.java:232) ~[elasticsearch-7.12.1.jar:7.12.1]
        at org.elasticsearch.common.util.concurrent.BaseFuture.get(BaseFuture.java:54) ~[elasticsearch-7.12.1.jar:7.12.1]
        at org.elasticsearch.common.util.concurrent.FutureUtils.get(FutureUtils.java:65) ~[elasticsearch-7.12.1.jar:7.12.1]


# 日志中的信息显示 Watcher 服务被手动停止,原因是 集群状态更新。尝试重新启动 Watcher 服务时,发生了错误,具体错误是 Timeout waiting for task,即等待某个任务执行超时。可能是由于 Watcher 的内部组件没有在规定时间内完成初始化或读取任务(如触发的 Watcher 未能及时加载)
5)尝试重新激活该 Watcher
根据 Watcher ID 可以尝试重新激活该 Watcher 。
# 停用
POST _watcher/watch/{watch_id}/_deactivate

# 重新激活
POST _watcher/watch/{watch_id}/_activate
在生产环境尝试采用上述方式重新激活异常状态的某个 Watcher ID,但该 Watcher 依然状态异常,最后的触发时间依然是很久之前。

点击上图箭头指向的位置,进入下图。

然后点击 “保存监视”
然后返回,点击该Watcher ID,进入下图,点击 “停用”

然后再点击 “启用”
节点的 Watcher 状态卡在 “starting” 可能由以下原因导致:
- 资源不足(CPU、内存、I/O)
- 线程池任务积压
- 集群健康状态异常
- 磁盘 I/O 问题
- 网络连接问题
- Watcher 索引问题
根据上面罗列的几种 Watcher 状态异常原因,逐一进行了排查,最后决定对异常两个节点进行重启。
然后逐一对两个异常节点进行了重启,重启后,再查看集群 Watcher 状态,显示所有节点的 watcher_state 状态都为 started。
GET _watcher/stats
{
  "_nodes" : {
    "total" : 10,
    "successful" : 10,
    "failed" : 0
  },
  "cluster_name" : "xxxxx-xxxx",
  "manually_stopped" : false,
  "stats" : [
    {
      "node_id" : "hW3RxxxxxxxxxxxxxxxxxMg",
      "watcher_state" : "started",
      "watch_count" : 0,
      "execution_thread_pool" : {
        "queue_size" : 0,
        "max_size" : 0
      }
    },
    {
      "node_id" : "pv3jxxxxxxxxxxxxxxxxxDA",
      "watcher_state" : "started",
      "watch_count" : 0,
      "execution_thread_pool" : {
        "queue_size" : 0,
        "max_size" : 1
      }
    },
    {
      "node_id" : "IUDnxxxxxxxxxxxxxxxxxmQ",
      "watcher_state" : "started",
      "watch_count" : 0,
      "execution_thread_pool" : {
        "queue_size" : 0,
        "max_size" : 0
      }
    },
    {
      "node_id" : "XrEUxxxxxxxxxxxxxxxxxPQ",
      "watcher_state" : "started",
      "watch_count" : 0,
      "execution_thread_pool" : {
        "queue_size" : 0,
        "max_size" : 1
      }
    },
    {
      "node_id" : "f88cxxxxxxxxxxxxxxxxxig",
      "watcher_state" : "started",
      "watch_count" : 0,
      "execution_thread_pool" : {
        "queue_size" : 0,
        "max_size" : 0
      }
    },
    {
      "node_id" : "nLHYxxxxxxxxxxxxxxxxxDA",
      "watcher_state" : "started",
      "watch_count" : 0,
      "execution_thread_pool" : {
        "queue_size" : 0,
        "max_size" : 1
      }
    },
    {
      "node_id" : "V0ZQxxxxxxxxxxxxxxxxxyw",
      "watcher_state" : "started",
      "watch_count" : 0,
      "execution_thread_pool" : {
        "queue_size" : 0,
        "max_size" : 8
      }
    },
    {
      "node_id" : "ToBtxxxxxxxxxxxxxxxxxBw",
      "watcher_state" : "started",
      "watch_count" : 1,
      "execution_thread_pool" : {
        "queue_size" : 0,
        "max_size" : 64
      }
    },
    {
      "node_id" : "egdKxxxxxxxxxxxxxxxxxmw",
      "watcher_state" : "started",
      "watch_count" : 0,
      "execution_thread_pool" : {
        "queue_size" : 0,
        "max_size" : 96
      }
    },
    {
      "node_id" : "VaDPxxxxxxxxxxxxxxxxxtw",
      "watcher_state" : "started",
      "watch_count" : 0,
      "execution_thread_pool" : {
        "queue_size" : 0,
        "max_size" : 0
      }
    }
  ]
}
然后持续观察了下集群配置的哪些 Watcher,那些异常的 Watcher 的最后触发时间也都发生了改变,并和业务相关人员联系询问得知告警也都正常了。
四、(附录) Watcher 和 Alerting 对比
Elasticsearch 的 Alerting 功能是一个强大的、灵活的、跨应用的告警系统。它不仅可以满足常规的告警需求,还可以与 Elasticsearch 的其他功能紧密集成,帮助用户实时监控系统和应用的健康状况,并在问题发生时快速反应。
在 Elasticsearch 的新版本中,Alerting 不仅涵盖 Watcher 的功能,还支持 Kibana 中的各种应用,如 Metrics、Logs、APM 等,提供了跨应用的告警能力,另外可通过 Kibana 图形界面操作,不需要编写复杂的 json 代码。
如果有更复杂的需求,也可以结合 Watcher 来实现定制化的告警逻辑。
在 Elasticsearch 中,Watcher 和 Alerting 两者都涉及到订阅级别和收费问题。
-
收费情况
- Watcher 是收费的,并且只在 高级订阅许可中提供。也就是说,使用 Watcher 进行复杂告警和自动化任务时,需要订阅至少 白金 或 企业 级别的许可。
- Alerting 在基础许可(Basic License)中免费提供,即所有用户,包括使用开源或免费版的 ES 用户,都可以使用基本的 Alerting 功能。Kibana Alerting(高级功能) 可能有一些更复杂的功能(如更丰富的集成或更复杂的告警条件),这些功能需要 白金级 或 企业级 许可才能使用。
-
适用场景
- Watcher 适用于需要高度自定义告警场景的企业用户,特别是在需要手写复杂 JSON 配置和实现高度定制化自动化时。
- Alerting 是 Elasticsearch 中用于统一告警的基础功能,提供了一个简单、直观的图形化界面,适合大多数用户的需求,尤其是那些不需要太复杂自定义告警逻辑的场景。
总结对比:
| 特性 | Watcher | Alerting |
|---|---|---|
| 收费模式 | 收费,仅在白金及企业级许可中提供 | 基础功能免费,复杂功能需高级订阅 |
| 使用场景 | 适用于复杂、自定义的告警和自动化需求 | 适用于图形化操作和常见告警场景 |
| 配置方式 | 通过手写 JSON,复杂的定制化告警 | 在 Kibana 中通过 UI 界面轻松创建 |
| 通知方式 | 支持多种通知方式,如邮件、Webhook、Slack | 基础版提供多种通知方式,集成广泛 |
| 灵活性 | 高度灵活,支持复杂逻辑 | 灵活,但复杂告警场景需要高级订阅 |