


在前面4个章节我们对Trace数据从Tempo的Distributor组件接收到Ingester组件写入持久化存储的过程进行讲解。通过阅读源码了解到数据整个流动过程中涉及多次写入指标依据配置项参数的限流、限制判断逻辑。本节将对所有的限流逻辑进行讲解,以及当出现对应的限流时会输出怎样的日志,又该如何调整哪些配置参数。
1. Distributor
1.1单租户接收数据包的大小
Distributor判断是否超过租户10秒内接收数据包的总大小,如果超过则会输出以下错误日志:
参数1:当前配置的限流最大值;
参数2:当前接收的书记办大小;
参数3:租户ID。
"RATE_LIMITED: ingestion rate limit (%d bytes) exceeded while adding %d bytes for user %s"
可以根据是否有如上日志输出,特别是关键字RATE_LIMITED:,确定是否需要调整rate_limit_bytes配置
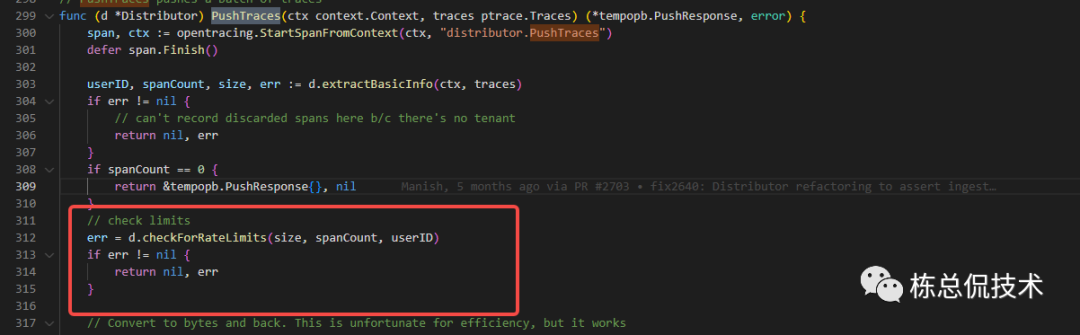
该限流依赖Distributor组件的rate_limit_bytes配置项,该配置默认15MB。
# Per-user ingestion rate limit (bytes) used in ingestion.
# Results in errors like
#   RATE_LIMITED: ingestion rate limit (15000000 bytes) exceeded while
#   adding 10 bytes
[rate_limit_bytes: <int> | default = 15000000 (15MB) ]
2. Ingester
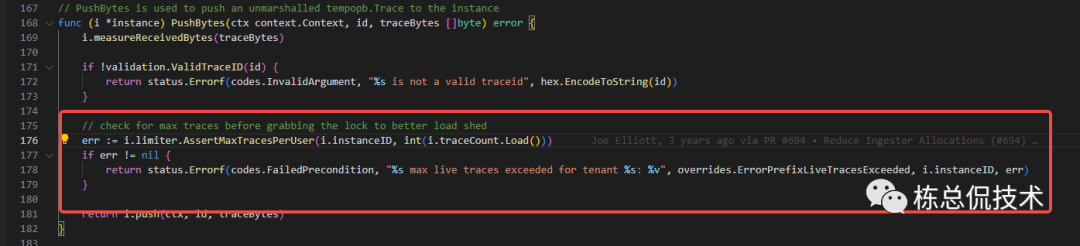
2.1 租户支持的LiveTrace数量限制
Insatnce(租户)中liveTrace数组的长度是否超过限制。liveTrace的数量限制由两个参数决定max_traces_per_user、max_global_traces_per_user,若为0则不进行限制。
max_traces_per_user由Instance的单个实例所拥有,表示单个Ingester实例的限制数量
max_global_traces_per_user由所有的Ingester实例共有,单个Ingester实例的限制数量= max_global_traces_per_user/ 实例数量
如果某个租户接收的LiveTrace数量超过以上配置,则会返回错误至Distributor发起调用的PushBytesV2函数。
"%s max live traces exceeded for tenant %s: %v"
在接收到错误返回后,Distributor的指标distributor_ingester_append_failures_total
会累加加一,通过查询该指标是否大于0确定是否有存在因为租户的liveTrace数量限制而导致指标被过滤。(需要先接入Prometheus监控)
若查询到该指标大于0,还需要查找discarded_spans_total
指标通过reason字段确定是什么原因导致span被拒绝要解决因为租户的liveTrace数量限制而导致指标被过滤。有两种配置优化方案:
1.增加LiveTrace长度的判断限制
增加配置max_traces_per_user、max_global_traces_per_user的值。
2.加快Ingester将LiveTrace清理
减少trace_idle_period,降低LiveTrace停留在Ingester的时间,
减少flush_check_period,增快检测是否需要将LiveTrace处理成CompletingBlocks
ingester:

   # amount of time a trace must be idle before flushing it to the wal.
   # (default: 10s)
   [trace_idle_period:]

   # how often to sweep all tenants and move traces from live -> wal -> completed blocks.
   # (default: 10s)
   [flush_check_period:]
2.2 单个租户接收Trace包的限流
判断当前租户的liveTrace包大小+即将接收的Trace包大小是否超过配置的单个租户最大Trace
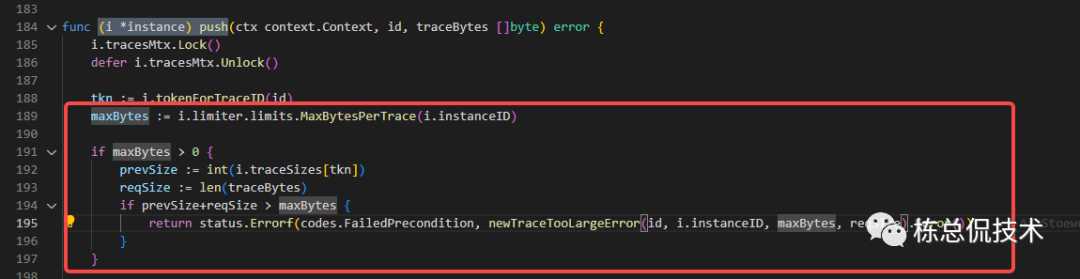
如果超过限制将会返回错误信息至Distributor的pushButesV2接口:
"%s max size of trace (%d) exceeded while adding %d bytes to trace %s for tenant %s"
单个租户接收Trace限流由配置max_bytes_per_trace决定,默认5MB。
# Maximum size of a single trace in bytes.  A value of 0 disables the size
# check.
# This limit is used in 3 places:
#  - During search, traces will be skipped when they exceed this threshold.
#  - During ingestion, traces that exceed this threshold will be refused.
#  - During compaction, traces that exceed this threshold will be partially dropped.      # During ingestion, exceeding the threshold results in errors like
#    TRACE_TOO_LARGE: max size of trace (5000000) exceeded while adding 387 bytes
[max_bytes_per_trace: <int> | default = 5000000 (5MB) ]
与LiveTrace的数量限制一样也可以从监控指标distributor_ingester_append_failures_total确定是否有指标被过滤,通过discarded_spans_total确定原因,如果是包大小限制,则考虑调大max_bytes_per_trace配置。
2.3 单个LiveTrace包大小限制
判断单个LiveTrace的数据包大小是否超过配置值,累加之前接收的span大小,再次判断Trace当前的总包大小是否超过最大支持。
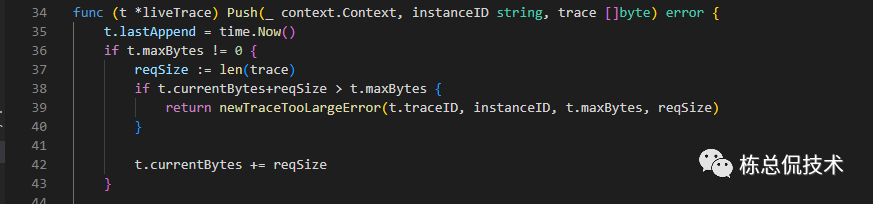
该限制由配置max_bytes_per_trace决定,默认支持5MB
global:
  # Maximum size of a single trace in bytes.  A value of 0 disables the size
  # check.
  # This limit is used in 3 places:
  #  - During search, traces will be skipped when they exceed this threshold.
  #  - During ingestion, traces that exceed this threshold will be refused.
  #  - During compaction, traces that exceed this threshold will be partially dropped.
  # During ingestion, exceeding the threshold results in errors like
  #    TRACE_TOO_LARGE: max size of trace (5000000) exceeded while adding 387 bytes
   [max_bytes_per_trace: <int> | default = 5000000 (5MB) ]
在出现该限制时,也会返回与2.1、2.2一样的错误返回。
"%s max size of trace (%d) exceeded while adding %d bytes to trace %s for tenant %s"
需要通过discarded_spans_total
的reason
字段确定原因,然后对max_bytes_per_trace
配置进行调整
通过汇总对Trace数据经过Distributor组件、Ingester组件限流的分析,可以得出如下结论:
整个写入流程总共经过4次判断,1次在Distributor组件,3次在Ingester组件
Distributor组件的限流将会输出错误日志
Ingester组件需要通过查询指标
distributor_ingester_append_failures_total
确定是否有发生限流丢弃数据,通过discarded_spans_total
确定是在哪个流程丢弃数据。
到这里,我们不仅了解了Trace数据整个写入流程,同时对Trace数据写入流程中限流逻辑进行了汇总讲解。相信大家在遇到对应的问题,知道该对哪个或哪些配置项进行调整。从下一节开始将会带来Tempo中数据查询到Grafana展示的代码逻辑讲解。
往期回顾:
Grafana Tempo源码解读(四)Ingester组件将数据写入持久化存储
Grafana Tempo源码解读(三)Ingester组件接收Trace数据的过程
Grafana Tempo源码解读(二)Distributor对Trace数据的处理和发送至Ingester
Grafana Tempo源码解读(一)Distributor建立监听接收Trace数据
